
Substance-related acute toxicity deaths in Canada from 2016 to 2017: A review of coroner and medical examiner files

Download in PDF format
(3.1 MB, 114 pages)
Organization: Public Health Agency of Canada
Published: December 2022
Table of contents
- Dedication
- Messages from collaborators
- Contributors and acknowledgements
- Executive summary
- Introduction
- About the data
- Findings
- Limitations
- Conclusions
- Definitions included in this report
- References
List of figures
- Figure 1. Boxplot of the number of people who died per day due to a substance-related acute toxicity, by sex and manner of death, Canada, 2016 and 2017.
- Figure 2. Number of people who died due to a substance-related acute toxicity by the year and month of death, sex, and manner of death, Canada, 2016 to 2017.
- Figure 3. Average number of people who died due to a substance-related acute toxicity by year and day of the week of death, Canada, 2016 to 2017.
- Figure 4. Counts and crude mortality rates (per 100,000 population) of people who died due to a substance-related acute toxicity by province or territory, Canada, 2016 and 2017.
- Figure 5. Number of residents who died due to acute toxicity and associated crude mortality rates (deaths per 100,000 population) in municipalities with populations of 100,000 or more, Canada, 2016 to 2017.
- Figure 6. Percent of people who died due to a substance-related acute toxicity in each age group by sex and manner of death, Canada, 2016 to 2017.
- Figure 7. Mortality rate of people who died due to a substance-related acute toxicity by sex, manner of death, and age group, Canada, 2016 to 2017.
- Figure 8. Who the people who died due to a substance-related acute toxicity were living with by sex and manner of death, Canada (excluding all British Columbia and 681 Ontario cases), 2016 and 2017.
- Figure 9. Percent distribution and crude mortality rate (per 100,000 population) of people 15 years and older who died due to a substance-related acute toxicity by relationship status and sex, Canada, 2016 and 2017.
- Figure 10. Percent distribution and crude mortality rate (per 100,000 population) of people 15 years and older who died due to a substance-related acute toxicity by relationship status and manner of death, Canada, 2016 and 2017.
- Figure 11. Percent distribution and crude mortality rate (per 100,000 population) of people 15 years and older who died due to a substance-related acute toxicity by occupation, Canada, 2016 and 2017.
- Figure 12. Percent distribution and crude mortality rate (per 100,000 population) of people 15 years and older who died due to a substance-related acute toxicity by work industry, Canada, 2016 and 2017.
- Figure 13. Percentage of people who died due to a substance-related acute toxicity who had a documented history of substance use, Canada, 2016 and 2017.
- Figure 14. Percentage of people who died due to a substance-related acute toxicity with an accessible family doctor to receive regular care from, Canada (excluding all British Columbia cases), 2016 and 2017.
- Figure 15. Percentage of people who died due to a substance-related acute toxicity who had contact with health services in the year before their death, Canada, 2016 and 2017.
- Figure 16. Time of the acute toxicity event that resulted in death among people who died due to a substance-related acute toxicity by sex and manner of death, Canada (excluding 681 Ontario cases), 2016 and 2017.
- Figure 17. Apparent mode of drug use during the acute toxicity event that resulted in death among people who died due to a substance-related acute toxicity by sex and manner of death, Canada, 2016 and 2017.
- Figure 18. Presence of drugs or alcohol at the scene of the acute toxicity event that resulted in death among people who died due to a substance-related acute toxicity by sex and manner of death, Canada (excluding all British Columbia cases), 2016 and 2017.
- Figure 19. Presence of a witness during the acute toxicity event that resulted in death among people who died due to a substance-related acute toxicity by sex and manner of death, Canada (excluding all British Columbia cases), 2016 and 2017.
- Figure 20. Percent distribution of number of substances causing death among people who died due to a substance-related acute toxicity by sex, Canada, 2016 and 2017.
- Figure 21. Percent distribution of number of substances detected among people who died due to a substance-related acute toxicity by sex, Canada, 2016 and 2017.
- Figure 22. Percent distribution of number of substances causing death among people who died due to a substance-related acute toxicity by manner of death, Canada, 2016 and 2017.
- Figure 23. Percent distribution of number of substances detected among people who died due to a substance-related acute toxicity by manner of death, Canada, 2016 and 2017.
- Figure 24. Top substances causing death among people who died due to a substance-related acute toxicity by province or territory, Canada, 2016 and 2017
- Figure 25. Top substances detected among people who died due to a substance-related acute toxicity by province or territory, Canada, 2016 and 2017
List of tables
- Table 1. Number of people who died due to a substance-related acute toxicity by province or territory and year of death, Canada, 2016 to 2017.
- Table 2. Percent distribution and age-adjusted mortality rate (per 100,000 population) of people who died due to a substance-related acute toxicity by province or territory and sex, Canada, 2016 and 2017.
- Table 3. Percent distribution and age-adjusted mortality rate (per 100,000 population) of people who died due to a substance-related acute toxicity by province or territory and manner of death, Canada, 2016 and 2017.
- Table 4. Percent distribution of people who died due to substance-related acute toxicity and associated age-adjusted mortality rates (per 100,000 population) by place of residence, sex, and manner of death, Canada, 2016 and 2017.
- Table 5. Percent distribution and crude mortality rate (per 100,000 population) of people who died due to a substance-related acute toxicity by sex and manner of death, Canada, 2016 and 2017.
- Table 6. Percent distribution and crude mortality rate (per 100,000 population) of people who died due to a substance-related acute toxicity by sex and age, Canada, 2016 and 2017.
- Table 7. Percent distribution and crude mortality rate (per 100,000 population) of people who died due to a substance-related acute toxicity by age and manner of death, Canada, 2016 and 2017.
- Table 8. Percent distribution of people who died due to a substance-related acute toxicity by sex, manner of death, and type of residence, Canada, 2016 and 2017.
- Table 9. Percent distribution of people who died due to a substance-related acute toxicity by sex and recent transitions in where people lived, Canada, 2016 and 2017.
- Table 10. Percent distribution of people who died due to a substance-related acute toxicity by if they had children, their sex, and their manner of death, Canada (excluding all British Columbia and 681 Ontario cases), 2016 and 2017.
- Table 11. Percent distribution of people who died due to a substance-related acute toxicity by employment status or income source, sex, and manner of death, Canada, 2016 and 2017.
- Table 12. Percent distribution and crude mortality rate (per 100,000 population) of people 15 years and older who died due to a substance-related acute toxicity by occupation, sex, and manner of death, Canada, 2016 and 2017.
- Table 13. Percent distribution and crude mortality rate (per 100,000 population) of people 15 years and older who died due to a substance-related acute toxicity by work industry, sex, and manner of death, Canada, 2016 and 2017.
- Table 14. Substance use history of people who died due to a substance-related acute toxicity by sex and manner of death, Canada, 2016 and 2017.
- Table 15. Health services contact in the year before their death of people who died due to a substance-related acute toxicity by sex and manner of death, Canada, 2016 and 2017.
- Table 16. Place where the acute toxicity event that resulted in death took place among people who died due to a substance-related acute toxicity by sex and manner of death, Canada, 2016 and 2017.
- Table 17. Setting where the acute toxicity event that resulted in death took place among people who died due to a substance-related acute toxicity by sex and manner of death, Canada, 2016 and 2017.
- Table 18. Presence of others when drugs or alcohol were taken during the acute toxicity event that resulted in death among people who died due to a substance-related acute toxicity by sex and manner of death, Canada, 2016 and 2017.
- Table 19. Substances included in each substance type category.
- Table 20. Number and percent distribution of substance types identified as causing death among people who died due to a substance-related acute toxicity by sex, Canada, 2016 and 2017.
- Table 21. Number and percent distribution of substance types detected among people who died due to a substance-related acute toxicity by sex, Canada, 2016 and 2017.
- Table 22. Number and percent distribution of substance types causing death among people who died due to a substance-related acute toxicity by manner of death, Canada, 2016 and 2017.
- Table 23. Number and percent distribution of substance types detected among people who died due to a substance-related acute toxicity by manner of death, Canada, 2016 and 2017.
Download in PDF format
(3.1 MB, 114 pages)
Organization: Public Health Agency of Canada
Published: December 2022
Table of contents
- Dedication
- Messages from collaborators
- Contributors and acknowledgements
- Executive summary
- Introduction
- About the data
- Findings
- Limitations
- Conclusions
- Definitions included in this report
- References
List of figures
- Figure 1. Boxplot of the number of people who died per day due to a substance-related acute toxicity, by sex and manner of death, Canada, 2016 and 2017.
- Figure 2. Number of people who died due to a substance-related acute toxicity by the year and month of death, sex, and manner of death, Canada, 2016 to 2017.
- Figure 3. Average number of people who died due to a substance-related acute toxicity by year and day of the week of death, Canada, 2016 to 2017.
- Figure 4. Counts and crude mortality rates (per 100,000 population) of people who died due to a substance-related acute toxicity by province or territory, Canada, 2016 and 2017.
- Figure 5. Number of residents who died due to acute toxicity and associated crude mortality rates (deaths per 100,000 population) in municipalities with populations of 100,000 or more, Canada, 2016 to 2017.
- Figure 6. Percent of people who died due to a substance-related acute toxicity in each age group by sex and manner of death, Canada, 2016 to 2017.
- Figure 7. Mortality rate of people who died due to a substance-related acute toxicity by sex, manner of death, and age group, Canada, 2016 to 2017.
- Figure 8. Who the people who died due to a substance-related acute toxicity were living with by sex and manner of death, Canada (excluding all British Columbia and 681 Ontario cases), 2016 and 2017.
- Figure 9. Percent distribution and crude mortality rate (per 100,000 population) of people 15 years and older who died due to a substance-related acute toxicity by relationship status and sex, Canada, 2016 and 2017.
- Figure 10. Percent distribution and crude mortality rate (per 100,000 population) of people 15 years and older who died due to a substance-related acute toxicity by relationship status and manner of death, Canada, 2016 and 2017.
- Figure 11. Percent distribution and crude mortality rate (per 100,000 population) of people 15 years and older who died due to a substance-related acute toxicity by occupation, Canada, 2016 and 2017.
- Figure 12. Percent distribution and crude mortality rate (per 100,000 population) of people 15 years and older who died due to a substance-related acute toxicity by work industry, Canada, 2016 and 2017.
- Figure 13. Percentage of people who died due to a substance-related acute toxicity who had a documented history of substance use, Canada, 2016 and 2017.
- Figure 14. Percentage of people who died due to a substance-related acute toxicity with an accessible family doctor to receive regular care from, Canada (excluding all British Columbia cases), 2016 and 2017.
- Figure 15. Percentage of people who died due to a substance-related acute toxicity who had contact with health services in the year before their death, Canada, 2016 and 2017.
- Figure 16. Time of the acute toxicity event that resulted in death among people who died due to a substance-related acute toxicity by sex and manner of death, Canada (excluding 681 Ontario cases), 2016 and 2017.
- Figure 17. Apparent mode of drug use during the acute toxicity event that resulted in death among people who died due to a substance-related acute toxicity by sex and manner of death, Canada, 2016 and 2017.
- Figure 18. Presence of drugs or alcohol at the scene of the acute toxicity event that resulted in death among people who died due to a substance-related acute toxicity by sex and manner of death, Canada (excluding all British Columbia cases), 2016 and 2017.
- Figure 19. Presence of a witness during the acute toxicity event that resulted in death among people who died due to a substance-related acute toxicity by sex and manner of death, Canada (excluding all British Columbia cases), 2016 and 2017.
- Figure 20. Percent distribution of number of substances causing death among people who died due to a substance-related acute toxicity by sex, Canada, 2016 and 2017.
- Figure 21. Percent distribution of number of substances detected among people who died due to a substance-related acute toxicity by sex, Canada, 2016 and 2017.
- Figure 22. Percent distribution of number of substances causing death among people who died due to a substance-related acute toxicity by manner of death, Canada, 2016 and 2017.
- Figure 23. Percent distribution of number of substances detected among people who died due to a substance-related acute toxicity by manner of death, Canada, 2016 and 2017.
- Figure 24. Top substances causing death among people who died due to a substance-related acute toxicity by province or territory, Canada, 2016 and 2017
- Figure 25. Top substances detected among people who died due to a substance-related acute toxicity by province or territory, Canada, 2016 and 2017
Dedication
In memory of each person represented in this report.
To those affected by substance-related harms, and those who work to reduce its impacts on individuals and communities.
Your strength. Your commitment. Your compassion. Your determination.
We dedicate this work to you.
Messages from collaborators
The messages below express several key collaborators' reflections on the study and how its findings can inform efforts to address the overdose crisis.
Message from the Chief Public Health Officer of Canada
"Substance-related harms has long been a public health concern in Canada, and one that has been especially apparent since 2016. That year, a sharp increase occurred in the number of Canadians dying from substance-related acute toxicity in many jurisdictions. That same year, the Government of Canada committed to a fulsome and evidence-informed public health response to address this crisis. While a national surveillance system was introduced to capture the toll of drug toxicity deaths and other substance-related harms, research was also needed to better understand the potential drivers of the crisis. This time-limited study was developed to improve our understanding of the people who lost their lives, including the circumstances in which they lived and died.
Each person described in this study died in 2016 or 2017, at a time when many broad-scale efforts to reduce substance-related harms were just beginning to be introduced or expand across the country. Tragically, recent surveillance data suggest that the overdose crisis in Canada has worsened considerably since 2017, and particularly since the onset of the COVID-19 pandemic. This descriptive review of coroner and medical examiner files helps us to better understand the evolving nature of this crisis and identify opportunities to act on the root causes and broader conditions that contribute to harms related to substance use. These data can also help us identify groups of Canadians who are at higher risk of harms, better understand their situation and needs, and tailor supports accordingly. This includes efforts to meet people "where they are at" and improve access to evidence-based harm reduction-oriented services and supports and treatment for substance use disorders. This report provides a baseline to assess our progress as evidence-based efforts to prevent substance-related deaths and other harms continue to evolve and expand in many jurisdictions across Canada.
This study is the first of its kind to collect detailed death investigation data from all of Canada's provinces and territories to paint a national picture of substance-related acute toxicity deaths. It was made possible through strong partnerships between justice and health sectors. Thank you to all the coroners, medical examiners, public health experts, researchers, subject matter experts and dedicated partners who made this work possible. These collaborative efforts are key to preventing further deaths and other substance-related harms in Canada."
Message from the Chair of the National Forum of Chief Coroners and Chief Medical Examiners
"Canada's coroners and medical examiners are at the forefront of the overdose crisis. For people who die, a coroner or medical examiner must answer important questions about their death: who were they? When did they die? By what means? While looking for answers, the coroner or medical examiner may discover information that could help save lives in the future.
The Chief Coroners and Chief Medical Examiners of Canada, together with our partners at the Public Health Agency of Canada, continue to work together to explore how death investigations can be used to inform scientific studies on substance-related mortality. We have opened our files to researchers, and we have helped them better understand our investigative methods.
Our first hope for this project is that lives may be saved. But it is becoming rapidly clear that coroners and medical examiners benefit equally from this openness. For our community, projects such as this study and others focused on reducing substance-related deaths have prompted a new era of sharing ideas and methods that will lead to more consistent practices across the country. We have learned and continue to learn about how death investigations are conducted across provinces and territories, how new methods are used, and how these results may be interpreted.
As Chair of the National Forum of Chief Coroners and Chief Medical Examiners of Canada, it is a privilege to dedicate this work to all those whom we serve, and especially to those who cannot speak for themselves."
Message from an Executive Board Member of the Canadian Association of People who Use Drugs (CAPUD)
"I feel grateful and privileged to be a part of creating this report. I want to thank the Public Health Agency of Canada for leading this project, and for breaking ground within their organization to include a person from the community of people who use or used drugs as an investigator. I encourage all researchers and institutions to do the same. This work has been a source of pride and also a source of deep grief.
People I love are included here, in these numbers and graphs. Each one of these thousands of data points represents a person who was loved and vital to the lives of others. Many people dispute or dismiss the value of people who use substances as members of society. We live in a country which embraces human rights and humanistic values. Nonetheless, more times than I care to count, I have heard people say that those who have passed away due to accidental overdoses "deserved it", read in online comments that they "asked for it", and even heard some care providers question if it was worth their time to treat them for overdoses. I will not quote any one person here, because it is not about any person, but about a social convention that dismisses all people who die from acute toxicity.
I shared a photo of my cousin recently, grinning with his motorcycle. The next photo shows him beside a man with a sagging face in a long-term care facility. This was his friend who was left with permanent and severe cognitive and physical impairment after an accident. When a tragedy like this strikes, most people offer help, vow to keep in touch, say things won't change, then slowly drift away. My cousin would drive eight hours each way, every month, to take his friend out or to get a haircut and shave just as he would have done when his friend was well. He kept that up for many years, until his death. He made sure his loved ones received elaborate gifts, conspicuously delivered, on birthdays and holidays. When we had a family reunion, he bought plane tickets for family who could not afford to come. He offered to help me buy a home. He was always there for me, whether it was to talk in the middle of the night, help me forget my troubles with a joke or story, listen, or protect me. To some people in his community, he was a problem, a drug pusher, a criminal. But he was the kindest, bravest, and most good-hearted and loyal person I have ever known. Whatever you think of the moral grey areas in which some people who use substances exist, we are all people first. Flawed like all people and loved like all people.
My cousin's mother still cries, every day. It has been three years now since his death. She lives in agony, like thousands of mothers. They not only must wake each day to a world that is wrong, twisted into some nightmare where their children have vanished, but they must do this in a world that blames them, and their children, for their deaths. Instead of sympathy, they get stigma; instead of help, they get hate.
It is often said that a society shows its values in how it treats the least among us. What does it say about us that this is the reality for so many hundreds of thousands of grieving widowed spouses, orphaned children, parents, and family members? I dream of a better world. I imagine myself in the future speaking to young people about the fear, shame, hiding, criminalization, and stigma that is so common now, and which I believe contributes to these deaths. I imagine them expressing horror when they hear of the thousands of deaths, often of young people in the first half of life. I imagine their gratitude and joy when they learn how this horror was ended by dedicated people, working to end the dying.
Please use this data with the respect it deserves. Please, follow the example of this project by including and collaborating with people with lived and living experience in your own work. Most of all, please use this data to become one of those I will thank, decades from now, for helping to end this epidemic of death. I thank you, readers, for caring enough to look at this report.
Stay safe."
Contributors and acknowledgements
This report was prepared by the study investigator team as a product of the Public Health Agency of Canada and the Federal, Provincial, and Territorial Special Advisory Committee on the Epidemic of Opioid Overdoses.
Investigator team
In alphabetical order:
- Brandi Abele, Canadian Association of People Who Use Drugs Board of Directors, Saskatchewan, Canada
- Matthew Bowes, Nova Scotia Medical Examiner Service, Nova Scotia, Canada
- Songul Bozat-Emre, Provincial Information Management and Analytics, Manitoba Health, Manitoba, Canada
- Jessica Halverson, Migration Health Branch, Immigration, Refugees and Citizenship Canada, Ontario, Canada
- Dirk Huyer, Office of the Chief Coroner for Ontario/Ontario Forensic Pathology Service, Ontario, Canada
- Beth Jackson, Health Equity Policy Division, Strategic Policy Branch, Public Health Agency of Canada, Ontario, Canada
- Graham Jones, Department of Laboratory Medicine and Pathology, Faculty of Medicine and Dentistry, University of Alberta, Alberta, Canada
- Fiona Kouyoumdjian, Ontario Ministry of Health, Ontario, Canada
- Jennifer Leason, Department of Anthropology and Archaeology, University of Calgary, Alberta, Canada
- Regan Murray, Collaboration on Death Investigation Data, Health Promotion and Chronic Disease Prevention Branch, Public Health Agency of Canada, Ontario, Canada
- Erin Rees, Public Health Risk Sciences Division, National Microbiology Laboratory, Public Health Agency of Canada, Quebec, Canada
- Jenny Rotondo (Principal investigator), Substance-Related Harms Division, Health Promotion and Chronic Disease Prevention Branch, Public Health Agency of Canada, Ontario, Canada
- Emily Schleihauf, Collaboration on Death Investigation Data Initiative Division, Health Promotion and Chronic Disease Prevention Branch, Public Health Agency of Canada, Ontario, Canada
- Amanda VanSteelandt (Principal investigator), Substance-Related Harms Division, Health Promotion and Chronic Disease Prevention Branch, Public Health Agency of Canada, Ontario, Canada
Study team authors
- Jenny Rotondo, Tanya Kakkar, Devanshi Shah, and Richelle Baddeliyanage from the Substance-Related Harms Division, Health Promotion and Chronic Disease Prevention Branch, Public Health Agency of Canada, Ontario, Canada
- Jacqueline Burt from the Office of Drug Research and Surveillance, Controlled Substances Directorate, Health Canada, Ontario, Canada
Acknowledgements
We would like to acknowledge that each case in this study was first and foremost a person. The reported numbers represent people from many walks of life who are mourned by family and friends. As demonstrated in this report, substance-related deaths have taken a heavy toll on Canadians. We would like to thank everyone taking part in efforts to prevent substance-related harms throughout Canada.
This report would not be possible without the collaboration of Canada's Chief Coroners and Chief Medical Examiners as well as public health partners, including (in alphabetical order) Simon Avis, Shamara Baidoobonso, Thambirajah Balachandra, Matthew Bowes, Kathryn Braun, Marguerite Cameron, Elaine Chan, Craig Chatterton, Akmal Coetzee-Khan, Elisapi Suluk Copland, Nash Denic, Justin Dyck, Garth Eggenberger, Greg Forestell, Heather Hannah, Dana Johnson, Heather Jones, Cathy Menard, Janice Nieswandt, Miles Partington, Paul-André Perron, Khen Sagadraca, Aarthi Velusamy, Clive Weighill, John Younes, and numerous other partners.
Thanks also go to our dedicated data abstractors, including (in alphabetical order), Raahyma Ahmad, Michele Boileau-Falardeau, Kelsey Boldt, Jacqueline Burt, Bhumika Deb, Maria Hartley, Claire Healey, Nousin Hussain, Khadija Ibrahim, Tanya Kakkar, Alice Karavetian, Asvini Keethakumar, Hannah Mercader, Alexandra Nunn, Julia Sohn, Amanda VanSteelandt, Rochelle White, and numerous other abstractors.
Finally, we would like to thank the many people who have contributed to the roll-out of this study. We would especially like to thank the current study team members who helped prepare the data and review this report, including (in alphabetical order) Shanti Aguilar-Cardenas, Raahyma Ahmad, Richelle Baddeliyanage, Jacqueline Burt, Yi-Shin Chang, Aganeta Enns, Mallory Flynn, Geneviève Gariépy, Diana George, Jingru Ha, Keltie Hamilton, Mohammad Howard-Azzeh, Tanya Kakkar, Heather Orpana, Jennifer Pennock, Jenny Rotondo, Devanshi Shah, Amanda VanSteelandt, Jeyasakthi Venugopal, and Rania Wasfi. Our thanks also go out to past team members, including (in alphabetical order) Ruh Afza, Jean-Francois Asselin, Laurence Caron-Poulin, Jenne Cunliffe, Noushon Farmanara, Mihaela Gheorghe, Ahash Jeevakanthan, Laura MacDougall, Sarah McDermott, Arhum Waheed, Abdelhamid Zaghlool, and numerous others over the years.
Disclaimer
This report is based on data and information compiled and provided by the provincial and territorial offices of Chief Coroners and Chief Medical Examiners from across Canada. However, the analyses, conclusions, opinions, and statements expressed herein are those of the authors, and do not necessarily reflect those of the data providers or the Federal, Provincial, and Territorial Special Advisory Committee on the Epidemic of Opioid Overdoses.
Executive summary
Purpose of this report
This report provides an overview of findings from a chart review study of coroner and medical examiner death investigations of people who died due to substance-related acute toxicity in Canada from January 1, 2016 to December 31, 2017. This is the first time such a study has been conducted in Canada at the national level. The sociodemographic and socioeconomic characteristics of the people who died, the substances involved, and the circumstances surrounding the acute toxicity event and death were examined across sexes and manners of death. Findings between this report and others, such as provincial and territorial reports, may vary due to differences in case definitions, methodology, available data sources, and/or data analysis.
About the data
Data from investigations of people who died from acute toxicity (excluding homicides) were collected from coroner and medical examiner files. All Canadian provinces and territories participated in the study. Due to variations in data availability across coroner and medical examiner files, the findings represent a minimum estimate of people who died with a particular characteristic (that is, at least this many people died). Population estimates from the 2016 Census were used to calculate mortality ratesFootnote 1 To protect privacy, all values less than 10 were suppressed and all counts were randomly rounded to base 3 prior to calculating percentages and crude mortality rates. This means that percentages may not always add up to 100%.
Key findings
Overview
- 9,414 people died due to substance-related acute toxicity, including 4,164 people who died in 2016 and 5,247 people who died in 2017.
- 70% of people who died were male and the remaining 30% were female.
- 84% of people died accidentally, 13% of people died by suicide, and the manner of death was undetermined for 4% of people.
- The average age of people who died was 43.0 years. For females who died, the average age was 45.3 years, while the average age of males who died was 42.1 years.
Yearly, monthly, and daily counts
- Based on data from this study, at least 12 people died on average per day in 2016 and 2017 from acute toxicity. Daily death counts ranged from 2 to 30.
- In both 2016 and 2017, small decreases in the number of people who died were observed in February, May, and October. The average number of people who died (or were found dead) increased over the week from the lowest counts on Mondays to the highest counts on Sundays.
Geographical trends
- Between 2016 and 2017, the greatest proportion of people who died lived in Ontario (32%), but British Columbia was the province with the highest age-adjusted mortality rate (at least 25.2 deaths per 100,000 population).
- Based on available residence information, a greater proportion of deaths occurred among people living in urban municipalities (83%) compared to rural municipalities (12%). Urban municipalities had higher age-adjusted mortality rates compared to rural municipalities (13.3 versus 10.3 deaths per 100,000 population). This pattern was observed across both sexes and all manners of death.
- The 30 municipalities with the most deaths accounted for 51% of all people who died due to substance-related acute toxicity.
Sociodemographic factors
- Females accounted for 30% of people who died overall, and 53% of people who died by suicide.
- Among all age groups under 70 years old, males and people who died accidentally accounted for the greatest proportion of people who died due to acute toxicity and had the highest associated mortality rates. The proportion of females and people who died by suicide increased with age.
- The majority of people who died were residing in a private dwelling at the time of death (at least 73%). A smaller percentage were experiencing homelessness (at least 8%) or living in supportive or transitional housing (at least 5%). At least 10% of people who died had been released from an institution in the previous 12 months.
- Information on who the person who died was living with was unknown or unavailable for 25% of people who died. Based on available information, people who died commonly lived alone (at least 24%) or with family (at least 18%). Differences were observed across sexes and manners of death.
- Although the greatest percentage of people 15 years and older who died were single (at least 31%), mortality rates were greatest among people who were divorced or separated (24.3 deaths per 100,000 population). At least 34% of people who died had at least 1 child of any age.
- Information on employment or income source was missing for 49% of people who died. At least 20% of people who died were employed and at least 18% were unemployed.
- Information on occupation and work industry was not available in coroner and medical examiner files for 75% and 79% of cases, respectively. Based on available data, mortality rates were greatest among people 15 years and older working in an occupation categorized as "trades, transport, equipment operator, or related" (at least 21.4 deaths per 100,000 population), and in the construction industry (at least 19.6 deaths per 100,000 population), though differences exist across sexes and manners of death.
Substance use history and interaction with health services
- The majority of people who died of a substance-related acute toxicity had a history of drug or alcohol use (at least 81%) documented in their coroner or medical examiner file, and at least 14% had a history of a non-fatal acute toxicity event.
- At least 36% of all people who died from a substance-related acute toxicity had access to a family doctor from whom they could receive regular care and at least 73% had contact with health services in the year before their death. Almost half of all people who died had sought outpatient treatment (for any reason) in the year before their death.
Acute toxicity event
- The time of the acute toxicity event was unknown or unobserved among 63% of people who died, and the place was unknown among 7%. Acute toxicity events leading to death most often took place during the evening from 6:00 pm to 11:59 pm (at least 11%) and nighttime from 12:00 am to 5:59 am (at least 13%) and in a personal residence setting (at least 67%).
- Information on the apparent mode of consumption was missing for 54% of people who died. The most commonly reported apparent mode of consumption was oral (at least 18%), followed by injection (at least 14%), smoking (at least 10%), and nasal insufflation or intranasal use (also known as sniffing or snorting, at least 8%).
- People who died due to a substance-related acute toxicity were most commonly found deceased with no evidence that the acute toxicity event was witnessed (at least 46%). This was especially common among people who died by suicide (at least 63%).
Substances involved
- Stimulants (44%), fentanyl opioids (44%), and non-fentanyl opioids (37%) were the most common substance types identified as causing death. Alcohol was detected in 34% of people who died and benzodiazepines in 28%.
- While the majority of coroner and medical examiner files identified 1 (30%) or 2(24%) substances as causing death, 3 (18%) and 4 (17%) substances were most often detected. Only 8% of people who died had only 1 substance detected.
- While the substances identified as causing death varied by province and territory, ethanol (alcohol) and cocaine were usually among the top 3 substances, and fentanyl among the top 10.
Conclusion
The results in this report provide additional contextual information on people who have died from acute toxicity not currently available at the national level, which can further inform programs and policies. In addition, these findings can serve as an important baseline to assess changes in the overdose crisis over time. Future products from this study will further detail the study methodology, examine specific populations, and provide in-depth analysis of additional factors.
Introduction
Acute toxicity, sometimes referred to as poisoning or overdose, can occur when the use of substances causes a sudden deterioration in health, which may or may not be reversibleFootnote 2. In Canada, substance-related acute toxicity has become a major public health crisis due to the rising number of deaths over timeFootnote 3 Footnote 4. The gradual increase in people who died of acute toxicity involving opioids from 2000 to 2015 was followed by a sharp increase in 2016Footnote 5, largely linked to the rising presence of fentanyl in the drug supplyFootnote 3.
While numerous reports describe people who died due to acute toxicity at the provincial or territorial levelFootnote 6 Footnote 7 Footnote 8 Footnote 9, consolidated nation-wide information from Canada remains limitedFootnote 10 Footnote 11. To better understand the people who died, the circumstances of their death, and the substances involved, the Public Health Agency of Canada, in collaboration with provincial and territorial Chief Coroners and Chief Medical Examiners and the Public Health Network Council's Special Advisory Committee on the Epidemic of Opioid Overdoses, conducted 2 national studies using coroner and medical examiner information. Findings from the first study - a qualitative analysis exploring coroner and medical examiner impressions of the context, characteristics, and trends in people who died due to acute toxicity - were published in 2018Footnote 12. The second study, and the focus of this report, is a national chart review study of the coroner and medical examiner files of people who died from a substance-related acute toxicity in Canada in 2016 and 2017. This is the first time such a study has been conducted in Canada.
This report provides an overview of findings related to the timing and geography of the deaths, the characteristics of those who died, the circumstances of death, and the substances involved in the acute toxicity event. The data provide a snapshot of people who died due to acute toxicity during 2016 and 2017, which is prior to i) the implementation of many policies, programs, and interventions aimed at decreasing substance-related harms; ii) changes in available substances and the drug supply; and iii) the COVID-19 pandemicFootnote 13 Footnote 14 Footnote 15 Footnote 16 Footnote 17. As the data are from 2016 and 2017, some findings, such as the patterns of substances involved, may differ from more recent years, particularly during the COVID-19 pandemicFootnote 15. This study provides a unique baseline for monitoring, evaluation, and research activities, and may be used to capture changes over the course of the overdose crisis.
Language statement
Considerable stigma is associated with substance use and substance use disorders - due in part to the language used to discuss these topicsFootnote 18. For people with lived and living experience of substance use and their loved ones, this stigma can be harmful and may create barriers to health and wellness. This report uses person-first language (for example, 'people who died') rather than identity-first language (for example, 'decedents') to support efforts to reduce stigma and to remind the reader that reported data represent human lives.
About the data
Case definition
This national chart review study aimed to describe and compare people who died due to substance-related acute toxicity across Canada near the beginning of the overdose crisis. All people who died in Canada between January 1, 2016 and December 31, 2017 from an acute toxicity resulting from the direct effects of the administration of exogenous substances where 1 or more of the substances was a drug or alcohol were included in the study. People who died due to chronic substance use, medical assistance in dying, palliative or comfort care, homicide, occupational exposure, trauma where an intoxicant contributed to the circumstances of the injury (such as a motor vehicle accident), adverse drug effects (such as anaphylactic shock), or acute toxicity due to products of combustion (such as carbon monoxide) were excluded from the study.
Data source
Deaths are investigated by coroners and medical examiners to determine the cause, manner, and circumstances of deathFootnote 19 Coroner and medical files involving people who met the case definition in all provinces and territories were reviewed carefully to collect information on socio-demographic factors, drug and medical history, proximal circumstances of death, and toxicological findings using a standardized data collection tool. More information on documents available in the coroner and medical examiner files is available in the Definitions section.
Data availability and preparation
This report provides a high-level overview of data collected on the 9,414 people identified as having died due to an acute toxicity in Canada in 2016 and 2017. Substantial efforts were made to ensure consistent data collection. Of note, office closures due to COVID-19 resulted in electronically available information being used for some Quebec and Ontario cases (Table 1). Also, some case files from 2017 in Manitoba were only partially abstracted and may have less information about social or medical history than other Manitoba cases. Finally, only electronic data were available for British Columbia, and British Columbia data were only available for people who experienced accidental or undetermined acute toxicity deaths involving "street drugs" or pharmaceutical substances not prescribed to them. As such, British Columbia data for people who experienced acute toxicity deaths by suicide or due solely to prescribed substances or alcohol were not available. Given these limitations, data from these provinces may be excluded from certain analyses where information on the variables of interest were systematically not available.
| Province or territory | 2016 | 2017 | Total | Data notes |
|---|---|---|---|---|
| British Columbia | 993 | 1,494 | 2,487 | Data from British Columbia were only available for people who experienced accidental or undetermined acute toxicity deaths involving "street drugs" or pharmaceutical substances not prescribed to them. As such, data for people who experienced acute toxicity deaths by suicide or due solely to prescribed substances or alcohol were not available. All data for British Columbia were obtained from a provincial electronic information system rather than full case files. As some variables from the chart review study were not available, British Columbia cases have a higher proportion of missing data compared to other provinces and territories. |
| Alberta | 807 | 951 | 1,758 | Data were obtained from physical files. |
| Saskatchewan | 123 | 123 | 246 | Data were obtained from physical or electronic files. |
| Manitoba | 180 | 198 | 378 | Some cases from 2017 were only partially abstracted due to COVID-19 related pressures. These cases may have slightly less information about the social or medical history of the person who died. Data were obtained from physical files |
| Ontario | 1,311 | 1,710 | 3,021 | Delays in data collection due to COVID-19-related closures resulted in data for 681 cases from 2017 (23% of all cases) being mapped from a provincial electronic information system (the Opioid Investigative Aid) rather than full case files. Mapped cases have a higher proportion of missing data compared to the fully abstracted cases as some variables from the chart review study did not have mapping equivalents in the Opioid Investigative Aid. |
| Quebec | 534 | 537 | 1,068 | Delays in data collection due to COVID-19-related closures resulted in 426 cases from 2017 (40% of all cases) being partially abstracted from electronically available brief coroner reports rather than full case files. The partially abstracted cases contain significantly more missing data. |
| New Brunswick | 66 | 63 | 126 | Data were obtained from physical files |
| Nova Scotia | 84 | 99 | 183 | Data were obtained from physical files |
| Prince Edward Island | 15 | 15 | 30 | Data were obtained from physical files |
| Newfoundland and Labrador | 30 | 42 | 75 | Data were obtained from physical files |
| Yukon | sup | sup | 21 | Data were obtained from physical files |
| Northwest Territories | sup | sup | sup | Data were obtained from physical files |
| Nunavut | sup | sup | sup | Data were obtained from physical files |
| Total | 4,164 | 5,247 | 9,414 | |
Note: Counts have been randomly rounded to base 3 and numbers less than 10 have been suppressed (sup). |
||||
Data analysis
Descriptive analyses, stratified by sex and manner of death, were conducted to identify differences in people who died from acute toxicity by their demographics, home and work life, circumstances of death, and the substances involved. The availability of the variables of interest varied across cases and jurisdictions. Therefore, descriptive analyses represent the minimum proportion of people who died from acute toxicity with a given characteristic. Furthermore, categories presented for income source, occupation and industry, substances involved, and mode of consumption are not mutually exclusive. As such, percentages in corresponding tables will not sum to 100%.
Evidence that the self-identified gender of the person who died may have differed from their sex assigned at birth was present in only 24 coroner and medical examiner files. Because this information was not systematically collected across files, analyses in this report were based on the biological sex at birth of people who died. Similarly, fewer than 10 cases had an unknown manner of death (that is, the manner of death was uncategorized at the time of data collection), these cases were assigned to undetermined manner of death to ensure that their information would not be suppressed.
Analyses of urban and rural differences were conducted after linking the study dataset to the Statistics Canada Postal Code Conversion File Plus using the postal code of residence for the person who died. More information on how the data were linked and related methods are available in the analysis of area-level characteristics of substance-related acute toxicity deathsFootnote 20.
Analyses focusing on what substances were involved in the acute toxicity event leading to death were conducted at the substance-specific and substance type levels. Detected metabolites known to be unique to a specific parent substance were used to indicate the presence of the parent substance. Note that some substances (such as amphetamine or morphine) are active metabolites and their presence could mean that either they or their parent substance were consumed (for example, methamphetamine for amphetamine and heroin for morphine). Substances can be present in toxicology reports as a result of a person's intentional use, unintentional use (due to, for example, contaminated drugs, medication errors, or the substance being mistaken for food), therapeutic use of a prescribed medication, or therapeutic use while receiving care from emergency medical services, in an emergency department, or at a hospital. More information is available in the section of this report looking at the substances involved.
Statistics Canada's 2016 Census dataFootnote 21 and annual 2016 and 2017Footnote 22 provincial, territorial, and national population estimates were used to calculate crude and age-adjusted mortality rates. Mortality rates were age-adjusted using the 2016 Canadian Census population as a reference to control for differences in age distributions when comparing rates across provinces and territories. Age-adjusted rates were calculated using the following age group categories: 19 years or less, 20 to 29 years, 30 to 39 years, 40 to 49 years, 50 to 59 years, 60 to 69 years, and 70 years or greater. Unless otherwise indicated, crude mortality rates were used. Pearson's chi-square tests and t-tests were used to test for statistically significant differences in categorical and continuous variables between groups, respectively. Rate ratios and associated 95% confidence intervals were used to compare mortality rates. Statistical analyses were conducted using SAS Enterprise Guide 7.1, R Version 4.1.1, and RStudio Version 1.3.959Footnote 23 Footnote 24 Footnote 25
To protect privacy, all values less than 10 were suppressed and all counts were randomly rounded to base 3. With base 3 suppression, values that are a multiple of 3 remain unchanged. However, values that are not a multiple of 3 have a 2/3 chance of rounding to the nearest multiple of 3 and a 1/3 chance of rounding to the second nearest multiple of 3. For example, a 13 will be rounded to either a 12 (2/3 likelihood) or a 15 (1/3 likelihood). Row and column totals were also independently, randomly rounded to base 3. Thus, if the values in columns or rows in a table were summed, they would not always equal the total. All percentages and crude rates were calculated using numbers that were randomly rounded to base 3.
Findings
Results from this study indicate that while Canadians from many walks of life are affected by acute toxicity, some identity and socio-demographic factors are associated more frequently with acute toxicity death than others. To highlight disproportionately affected groups, this section contains an overview of study findings analyzed by sex (male and female) and manner of death (accident, suicide, and undetermined). Other factors may affect which people have died due to acute toxicity in Canada, such as age and the substances involved. Future analyses will examine some of these factors in greater depth (for example by examining deaths among youth) as well as other topics not addressed in this report (for example, race and medical history).
Overview
A total of 9,414 people met the study case definition: 4,164 people who died in 2016 and 5,247 people who died in 2017 (Table 1). Females accounted for 30% of all cases and 70% were male (Figure 6). For manners of death, 84% of people died accidentally, 13% of people died by suicide, and the manner of death was undetermined for 4% of people. Data were collected in all provinces and territories. The average age of people who died was 43.0 years [standard deviation (sd) = 13.9 years] (Table 6). For females who died, the average age was 45.3 years (sd = 15.0 years), while the average age of males who died was 42.1 years (sd = 13.2 years).
Yearly, monthly, and daily counts of people who died
Although the effects of acute toxicity are experienced immediately after using a substance, death may not occur until several days or weeks later due to medical intervention. This section discusses the date of death.
Daily counts of people who died
Based on data from this study, at least 12 people died on average per day in 2016 and 2017 from acute toxicity. Daily death counts ranged from 2 to 30.
As seen in Figure 1, the average daily number of deaths was greater among males (average: 9.0, range: 1 to 21) compared to females (average: 3.8, range: 0 to 12). Similarly, more people died accidentally each day (average: 10.8, range: 2 to 26), compared to the number of people who died by suicide (average: 1.6, range: 0 to 8).
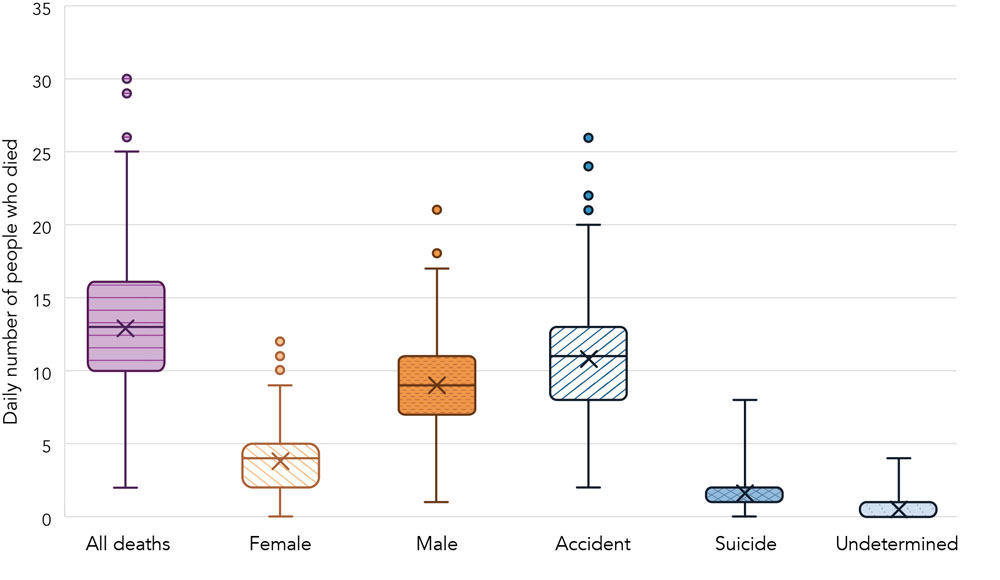
Note: For notes on reading a boxplot, please see the Definitions section. Data from British Columbia were only available for people who experienced accidental or undetermined acute toxicity deaths involving "street drugs" or pharmaceutical substances not prescribed to them. As such, data for people who experienced acute toxicity deaths by suicide or due solely to prescribed substances or alcohol were not available.
Figure 1 - Text description
| Value | All deaths | Sex | Manner of death | |||
|---|---|---|---|---|---|---|
| Female | Male | Accident | Suicide | Undetermined | ||
| Minimum | 2 | 0 | 1 | 2 | 0 | 0 |
| Quartile 1 | 10 | 2 | 7 | 8 | 1 | 0 |
| Median | 13 | 4 | 9 | 11 | 1 | 0 |
| Quartile 3 | 16 | 5 | 11 | 13 | 2 | 1 |
| Maximum | 30 | 12 | 21 | 26 | 8 | 4 |
| Inter-quartile range | 6 | 3 | 4 | 5 | 1 | 1 |
| Average | 12.9 | 3.8 | 9.0 | 10.8 | 1.6 | 0.5 |
| Standard deviation | 4.1 | 2.0 | 3.3 | 3.9 | 1.3 | 0.7 |
Note: For notes on the values included in this table, please see the Definitions section. Data from British Columbia were only available for people who experienced accidental or undetermined acute toxicity deaths involving "street drugs" or pharmaceutical substances not prescribed to them. As such, data for people who experienced acute toxicity deaths by suicide or due solely to prescribed substances or alcohol were not available. |
||||||
Number of people who died by month and day of the week
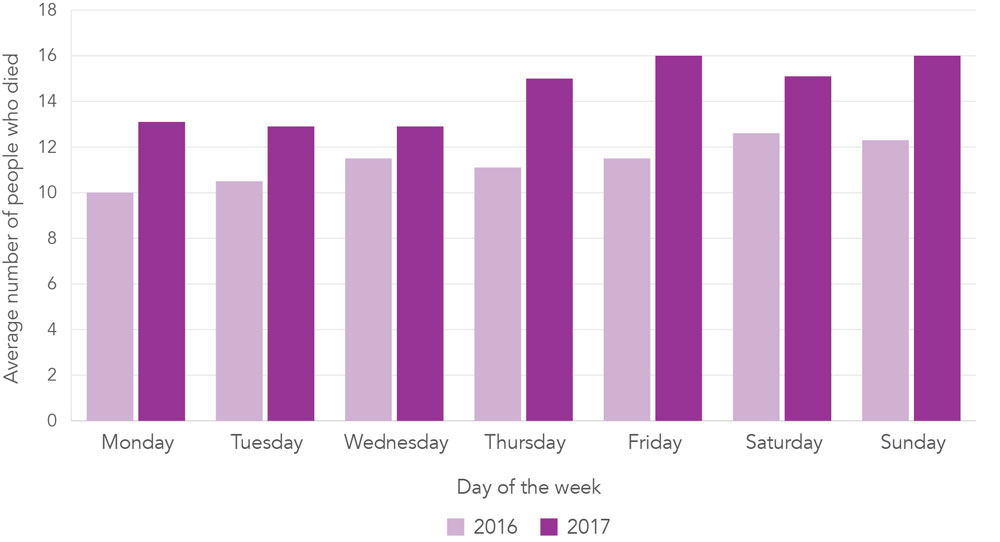
In both 2016 and 2017, small decreases in the number of people who died were observed in February, May, and October. The average number of people who died (or were found dead) increased over the week from the lowest counts on Mondays to the highest counts on Sundays.
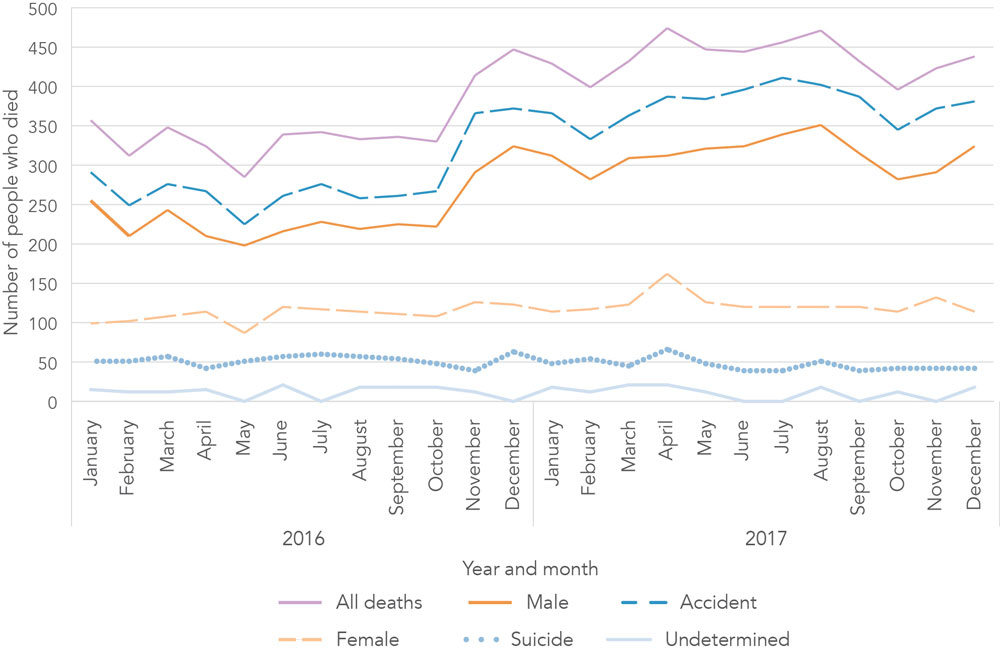
On average, 392 people died each month due to acute toxicity in 2016 and 2017, although changes were observed over time (Figure 2). Monthly counts ranged from 285 to 357 during the first 10 months of 2016. In November 2016, there was a 25% increase, with numbers jumping to 414. Monthly counts remained high from December 2016 to December 2017 (range: 396 to 474).
While this increase in monthly counts was observed among females, males, and people who died accidentally, there was no substantial change in the number of people who died by suicide by month. From 2016 to 2017 there was a 12% decrease in the average number dying by suicide (at least 53 in 2016 compared to at least 46 in 2017).
Generally, the average number of people who died (or were found dead) increased over the week from the lowest counts on Mondays (10.0 in 2016 and 13.1 in 2017) to the highest counts on Sundays (12.3 in 2016 and 16.0 in 2017) (Figure 3).
Note: Data from British Columbia were only available for people who experienced accidental or undetermined acute toxicity deaths involving "street drugs" or pharmaceutical substances not prescribed to them. As such, data for people who experienced acute toxicity deaths by suicide or due solely to prescribed substances or alcohol were not available. The date of death reflects when the person died, was pronounced dead, or was found dead. Counts are randomly rounded to base three, and those based on numbers less than 10 have been suppressed (sup).
Figure 2 - Text description
| Year | Month | All deaths | Sex | Manner of death | |||
|---|---|---|---|---|---|---|---|
| Female | Male | Accident | Suicide | Undetermined | |||
| 2016 | January | 357 | 99 | 255 | 291 | 51 | 15 |
| February | 312 | 102 | 210 | 249 | 51 | 12 | |
| March | 348 | 108 | 243 | 276 | 57 | 12 | |
| April | 324 | 114 | 210 | 267 | 42 | 15 | |
| May | 285 | 87 | 198 | 225 | 51 | sup | |
| June | 339 | 120 | 216 | 261 | 57 | 21 | |
| July | 342 | 117 | 228 | 276 | 60 | sup | |
| August | 333 | 114 | 219 | 258 | 57 | 18 | |
| September | 336 | 111 | 225 | 261 | 54 | 18 | |
| October | 330 | 108 | 222 | 267 | 48 | 18 | |
| November | 414 | 126 | 291 | 366 | 39 | 12 | |
| December | 447 | 123 | 324 | 372 | 63 | sup | |
| 2017 | January | 429 | 114 | 312 | 366 | 48 | 18 |
| February | 399 | 117 | 282 | 333 | 54 | 12 | |
| March | 432 | 123 | 309 | 363 | 45 | 21 | |
| April | 474 | 162 | 312 | 387 | 66 | 21 | |
| May | 447 | 126 | 321 | 384 | 48 | 12 | |
| June | 444 | 120 | 324 | 396 | 39 | sup | |
| July | 456 | 120 | 339 | 411 | 39 | sup | |
| August | 471 | 120 | 351 | 402 | 51 | 18 | |
| September | 432 | 120 | 315 | 387 | 39 | sup | |
| October | 396 | 114 | 282 | 345 | 42 | 12 | |
| November | 423 | 132 | 291 | 372 | 42 | sup | |
| December | 438 | 114 | 324 | 381 | 42 | 18 | |
Note: Data from British Columbia were only available for people who experienced accidental or undetermined acute toxicity deaths involving "street drugs" or pharmaceutical substances not prescribed to them. As such, data for people who experienced acute toxicity deaths by suicide or due solely to prescribed substances or alcohol were not available. The date of death reflects when the person died, was pronounced dead, or was found dead. Counts are randomly rounded to base three and those based on numbers less than 10 have been suppressed (sup). |
|||||||
Note: Data from British Columbia were only available for people who experienced accidental or undetermined acute toxicity deaths involving "street drugs" or pharmaceutical substances not prescribed to them. As such, data for people who experienced acute toxicity deaths by suicide or due solely to prescribed substances or alcohol were not available. The date of death reflects when the person died, was pronounced dead, or was found dead.
Figure 3 - Text description
| Weekday | 2016 | 2017 |
|---|---|---|
| Monday | 10.0 | 13.1 |
| Tuesday | 10.5 | 12.9 |
| Wednesday | 11.5 | 12.9 |
| Thursday | 11.1 | 15.0 |
| Friday | 11.5 | 16.0 |
| Saturday | 12.6 | 15.1 |
| Sunday | 12.3 | 16.0 |
|
Note: Data from British Columbia were only available for people who experienced accidental or undetermined acute toxicity deaths involving "street drugs" or pharmaceutical substances not prescribed to them. As such, data for people who experienced acute toxicity deaths by suicide or due solely to prescribed substances or alcohol were not available. The date of death reflects when the person died, was pronounced dead, or was found dead. | ||
Geographical trends
Provinces and territories
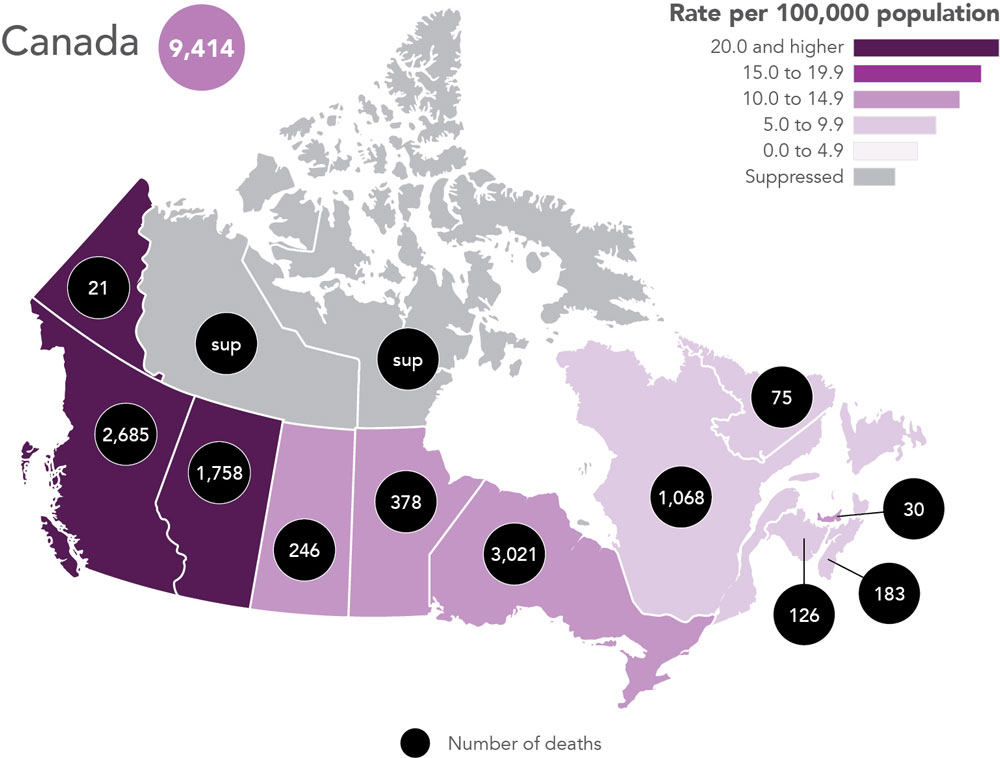
Between 2016 and 2017, the greatest proportion of people who died lived in Ontario (32%), but British Columbia was the province with the highest age-adjusted mortality rate (at least 25.2 deaths per 100,000 population).
Provincial and territorial crude mortality rates are depicted in Figure 4 while age-adjusted mortality rates are displayed in Table 2 and Table 3 to allow for comparison across provinces and territories. Ontario (32%), British Columbia (29%), and Alberta (19%) accounted for the greatest proportion of people who died due to acute toxicity (Table 2). Age-adjusted mortality rates were highest in British Columbia (at least 25.2 per 100,000 population), the Yukon (at least 26.3 per 100,000 population), and Alberta (at least 20.3 per 100,000 population). Similar trends were observed in males and people who died accidentally (Table 2 and Table 3). Among people who died by suicide, Ontario (31%) and Quebec (24%) accounted for the greatest proportion of deaths while age-adjusted mortality rates were highest in Alberta (at least 2.7 per 100,000 population) and Manitoba (at least 2.5 per 100,000 population) (Table 3). Although data for people who died by suicide were not available in our study for British Columbia, we estimate that approximately 199 people experienced acute toxicity death by suicide in 2016 and 2017 based on data from the British Columbia Coroner's ServiceFootnote 26, corresponding to a crude mortality rate of 2.0 per 100,000 population.
Although mortality rates were greater in males compared to females in all provinces, this difference was not statistically significant in New Brunswick, Prince Edward Island, Newfoundland and Labrador, and the Yukon (Table 2).
Note: Data from British Columbia were only available for people who experienced accidental or undetermined acute toxicity deaths involving "street drugs" or pharmaceutical substances not prescribed to them. As such, data for people who experienced acute toxicity deaths by suicide or due solely to prescribed substances or alcohol were not available. Counts and crude mortality rates are based on counts randomly rounded to base 3, and numbers less than 10 have been suppressed (sup).
Figure 4 - Text description
| Province or territory | Number of deaths | Crude mortality rate |
|---|---|---|
| British Columbia | 2,685 | 27.4 |
| Alberta | 1,758 | 20.8 |
| Saskatchewan | 246 | 10.8 |
| Manitoba | 378 | 14.3 |
| Ontario | 3,021 | 10.8 |
| Quebec | 1,068 | 6.5 |
| New Brunswick | 126 | 8.2 |
| Nova Scotia | 183 | 9.7 |
| Prince Edward Island | 30 | 10.1 |
| Newfoundland and Labrador | 75 | 7.1 |
| Yukon | 21 | 26.9 |
| Northwest Territories | sup | sup |
| Nunavut | sup | sup |
| Canada | 9,414 | 13.0 |
| Note: Data from British Columbia were only available for people who experienced accidental or undetermined acute toxicity deaths involving "street drugs" or pharmaceutical substances not prescribed to them. As such, data for people who experienced acute toxicity deaths by suicide or due solely to prescribed substances or alcohol were not available. Counts and crude mortality rates are based on counts randomly rounded to base three, and numbers less than 10 have been suppressed (sup). | ||
| Province or territory | All deaths | Female | Male | Male to female rate ratio (95% confidence interval) | |||
|---|---|---|---|---|---|---|---|
| % | Rate | % | Rate | % | Rate | ||
| British Columbia | 29% | 25.2 | 17% | 9.6 | 31% | 41.1 | 4.3 (3.9, 4.8) |
| Alberta | 19% | 20.3 | 18% | 12.1 | 19% | 28.3 | 2.3 (2.1, 2.6) |
| Saskatchewan | 3% | 11.2 | 4% | 9.0 | 2% | 13.3 | 1.5 (1.1, 1.9) |
| Manitoba | 4% | 14.8 | 6% | 12.8 | 3% | 16.8 | 1.3 (1.1, 1.6) |
| Ontario | 32% | 10.9 | 35% | 6.9 | 31% | 14.9 | 2.2 (2.0, 2.3) |
| Quebec | 11% | 6.4 | 15% | 5.0 | 10% | 7.8 | 1.6 (1.4, 1.8) |
| New Brunswick | ≤1% | 8.1 | 2% | 7.9 | ≤1% | 8.2 | 1.0 (0.7, 1.5) |
| Nova Scotia | 2% | 9.7 | 2% | 6.3 | 2% | 13.2 | 2.1 (1.5, 2.8) |
| Prince Edward Island | ≤1% | 10.5 | sup | sup | ≤1% | 13.7 | 1.9 (0.9, 3.9) |
| Newfoundland and Labrador | ≤1% | 7.1 | ≤1% | 5.5 | ≤1% | 8.8 | 1.6 (1.0, 2.6) |
| Yukon | ≤1% | 26.3 | sup | sup | ≤1% | 38.7 | 2.7 (1.0, 7.9) |
| Northwest Territories | sup | sup | sup | sup | sup | sup | sup |
| Nunavut | sup | sup | sup | sup | sup | sup | sup |
| Canada | 100% | 13.0 | 100% | 7.7 | 100% | 18.2 | 2.4 (2.3, 2.5) |
Note: Data from British Columbia were only available for people who experienced accidental or undetermined acute toxicity deaths involving "street drugs" or pharmaceutical substances not prescribed to them. As such, data for people who experienced acute toxicity deaths by suicide or due solely to prescribed substances or alcohol were not available. Percentages are based on counts randomly rounded to base 3, and percentages and age-adjusted mortality rates based on numbers less than 10 have been suppressed (sup). |
|||||||
| Province or territory | Accident | Suicide | Undetermined | |||
|---|---|---|---|---|---|---|
| % | Rate | % | Rate | % | Rate | |
| British Columbia | 31% | 25.0 | unavailable | unavailable | 5% | 0.2 |
| Alberta | 19% | 17.2 | 16% | 2.7 | 12% | 0.4 |
| Saskatchewan | 3% | 9.0 | 3% | 1.6 | 5% | 0.6 |
| Manitoba | 3% | 10.3 | 5% | 2.5 | 15% | 2.0 |
| Ontario | 31% | 8.9 | 31% | 1.5 | 35% | 0.4 |
| Quebec | 9% | 4.1 | 24% | 1.9 | 19% | 0.4 |
| New Brunswick | ≤1% | 5.9 | 3% | 2.2 | sup | sup |
| Nova Scotia | 2% | 7.4 | 3% | 2.0 | sup | sup |
| Prince Edward Island | ≤1% | 3.7 | sup | sup | 5% | 4.2 |
| Newfoundland and Labrador | ≤1% | 4.6 | 2% | 1.8 | sup | sup |
| Yukon | ≤1% | 18.5 | sup | sup | 0% | 0.0 |
| Northwest Territories | sup | sup | sup | sup | sup | sup |
| Nunavut | sup | sup | sup | sup | sup | sup |
| Canada | 100% | 10.9 | 100% | 1.9 | 100% | 0.5 |
Note: Data from British Columbia were only available for people who experienced accidental or undetermined acute toxicity deaths involving "street drugs" or pharmaceutical substances not prescribed to them. As such, data for people who experienced acute toxicity deaths by suicide or due solely to prescribed substances or alcohol were not available. Accordingly, British Columbia was removed from the Canadian population when calculating the age-adjusted mortality rate for people in Canada who died by suicide. Percentages are based on counts randomly rounded to base 3, and percentages and age-adjusted mortality rates based on numbers less than 10 have been suppressed (sup). |
||||||
Urban and rural municipalities
Based on available residence information, a greater proportion of deaths occurred among people living in urban municipalities (83%) compared to rural municipalities (12%). Urban municipalities had higher age-adjusted mortality rates compared to rural municipalities (13.3 versus 10.3 deaths per 100,000 population). This pattern was observed across both sexes and all manners of death.
Rates were significantly lower among males in rural (13.2 per 100,000 population) versus urban (19.1 per 100,000 population) municipalities [rate ratio (RR) = 0.7, confidence interval (CI) = 0.6, 0.8] (Table 4). Similarly, rates of accidental deaths were also significantly lower in rural (8.1 per 100,000 population) compared to urban (11.1 per 100,000 population) municipalities (RR = 0.7, CI = 0.7, 0.8). Though rates were lower, the difference was not statistically significant for females, deaths by suicide, and undetermined deaths in residents of rural compared to urban municipalities.
For the purposes of this report, urban municipalities include census metropolitan areas (CMAs) with populations of at least 100,000 residents and census agglomerations (CAs) with populations of at least 10,000 residents. Rural municipalities are defined here as all areas outside of CMAs and CAs. Note that people may not have died in their municipalities of residence. More detail is available in the analysis on area-level characteristics of substance-related acute toxicity deathsFootnote 20.
| Population | Place of residence | Percentage | Age-adjusted mortality rate | Rural to urban rate ratio | 95% confidence interval |
|---|---|---|---|---|---|
Total |
Urban | 83% | 13.3 | reference | reference |
| Rural | 12% | 10.3 | 0.8 | 0.7, 0.8 | |
Female |
Urban | 24% | 7.6 | reference | reference |
| Rural | 4% | 7.3 | 1.0 | 0.8, 1.1 | |
Male |
Urban | 59% | 19.1 | reference | reference |
| Rural | 8% | 13.2 | 0.7 | 0.6, 0.8 | |
Accident |
Urban | 70% | 11.1 | reference | reference |
| Rural | 9% | 8.1 | 0.7 | 0.7, 0.8 | |
Suicide |
Urban | 10% | 1.7 | reference | reference |
| Rural | 2% | 1.7 | 1.0 | 0.8, 1.3 | |
Undetermined |
Urban | 3% | 0.5 | reference | reference |
| Rural | ≤1% | 0.5 | 1.0 | 0.7, 1.5 | |
Note: The municipality of residence was unavailable for 5% of cases. For the purposes of this report, urban municipalities include census metropolitan areas (CMAs) with populations of at least 100,000 residents and census agglomerations (CAs) with populations of at least 10,000 residents. Rural municipalities are defined here as all areas outside of CMAs and CAs. Data from British Columbia were only available for people who experienced accidental or undetermined acute toxicity deaths involving "street drugs" or pharmaceutical substances not prescribed to them. As such, data for people who experienced acute toxicity deaths by suicide or due solely to prescribed substances or alcohol were not available. Accordingly, British Columbia was removed from the Canadian population when calculating the age-adjusted mortality rate for people in Canada who died by suicide. Percentages are based on counts randomly rounded to base 3. More information on the statistics used in this table is available in the Definitions section. |
|||||
Municipalities
The 30 municipalities with the most deaths accounted for 51% of all people who died due to substance-related acute toxicity.
Acute toxicity affected many of Canada's municipalities, with 1 or more people dying in at least 23% of them. Crude mortality rates in municipalities with populations of 100,000 or more residents ranged from 1.5 to 18.3 per 100,000 population (Figure 5). Although the municipalities with the greatest number of people who died differed across sexes and manners of death, Toronto, Calgary, Vancouver, and Edmonton had the highest number of people who died in most categories. Note that rates for municipalities with relatively smaller populations may change substantially with even slight changes in the number of people who died.
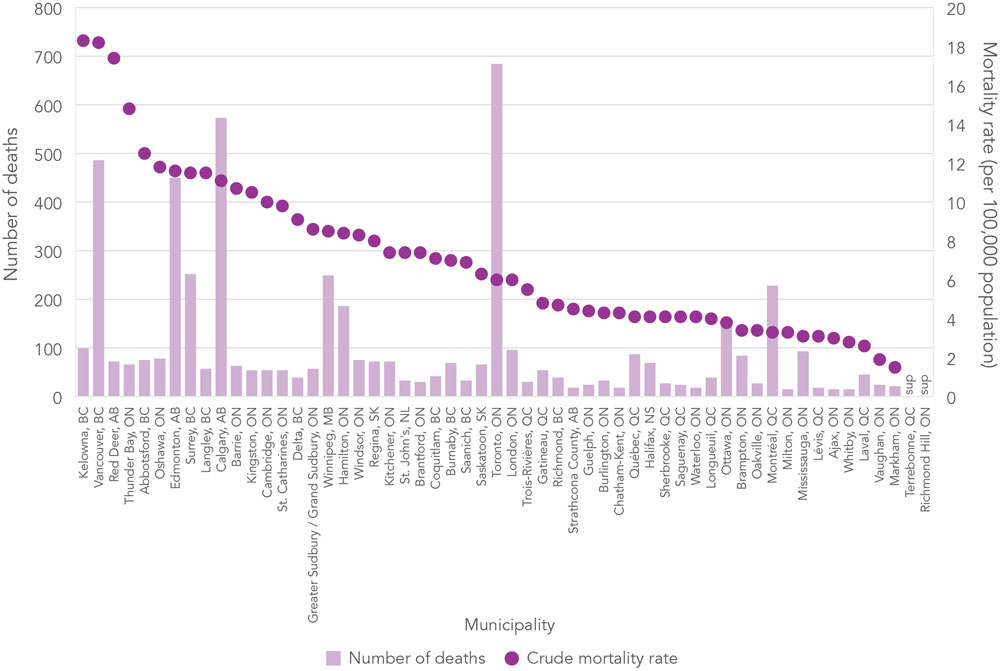
Note: The municipality of residence was unavailable for 5% of cases. Rates for municipalities with relatively smaller populations may change substantially with even slight changes in the number of people who died. Municipalities were selected based on their 2016 and 2017 Statistics Canada population estimatesFootnote 1. Data from British Columbia were only available for people who experienced accidental or undetermined acute toxicity deaths involving "street drugs" or pharmaceutical substances not prescribed to them. As such, data for people who experienced acute toxicity deaths by suicide or due solely to prescribed substances or alcohol were not available. Counts, which are used to calculate crude mortality rates, are randomly rounded to base 3. Numbers less than 10 and crude mortality rates based on these numbers have been suppressed (sup).
Figure 5 - Text description
| Municipality | Number of deaths | Crude mortality rate |
|---|---|---|
| Kelowna, BC | 99 | 18.3 |
| Vancouver, BC | 486 | 18.2 |
| Red Deer, AB | 72 | 17.4 |
| Thunder Bay, ON | 66 | 14.8 |
| Abbotsford, BC | 75 | 12.5 |
| Oshawa, ON | 78 | 11.8 |
| Edmonton, AB | 450 | 11.6 |
| Surrey, BC | 252 | 11.5 |
| Langley, BC | 57 | 11.5 |
| Calgary, AB | 573 | 11.1 |
| Barrie, ON | 63 | 10.7 |
| Kingston, ON | 54 | 10.5 |
| Cambridge, ON | 54 | 10.0 |
| St. Catharines, ON | 54 | 9.8 |
| Delta, BC | 39 | 9.1 |
| Greater Sudbury / Grand Sudbury, ON | 57 | 8.6 |
| Winnipeg, MB | 249 | 8.5 |
| Hamilton, ON | 186 | 8.4 |
| Windsor, ON | 75 | 8.3 |
| Regina, SK | 72 | 8.0 |
| Kitchener, ON | 72 | 7.4 |
| St. John's, NL | 33 | 7.4 |
| Brantford, ON | 30 | 7.4 |
| Coquitlam, BC | 42 | 7.1 |
| Burnaby, BC | 69 | 7.0 |
| Saanich, BC | 33 | 6.9 |
| Saskatoon, SK | 66 | 6.3 |
| Toronto, ON | 684 | 6.0 |
| London, ON | 96 | 6.0 |
| Trois-Rivières, QC | 30 | 5.5 |
| Gatineau, QC | 54 | 4.8 |
| Richmond, BC | 39 | 4.7 |
| Strathcona County, AB | 18 | 4.5 |
| Guelph, ON | 24 | 4.4 |
| Burlington, ON | 33 | 4.3 |
| Chatham-Kent, ON | 18 | 4.3 |
| Québec, QC | 87 | 4.1 |
| Halifax, NS | 69 | 4.1 |
| Sherbrooke, QC | 27 | 4.1 |
| Saguenay, QC | 24 | 4.1 |
| Waterloo, ON | 18 | 4.1 |
| Longueuil, QC | 39 | 4.0 |
| Ottawa, ON | 150 | 3.8 |
| Brampton, ON | 84 | 3.4 |
| Oakville, ON | 27 | 3.4 |
| Montréal, QC | 228 | 3.3 |
| Milton, ON | 15 | 3.3 |
| Mississauga, ON | 93 | 3.1 |
| Lévis, QC | 18 | 3.1 |
| Ajax, ON | 15 | 3.0 |
| Whitby, ON | 15 | 2.8 |
| Laval, QC | 45 | 2.6 |
| Vaughan, ON | 24 | 1.9 |
| Markham, ON | 21 | 1.5 |
| Terrebonne, QC | sup | sup |
| Richmond Hill, ON | sup | sup |
| Note: The municipality of residence was unavailable for 5% of cases. Rates for municipalities with relatively smaller populations may change substantially with even slight changes in the number of people who died. Municipalities were selected based on their 2016 and 2017 Statistics Canada population estimatesFootnote 1. Data from British Columbia were only available for people who experienced accidental or undetermined acute toxicity deaths involving "street drugs" or pharmaceutical substances not prescribed to them. As such, data for people who experienced acute toxicity deaths by suicide or due solely to prescribed substances or alcohol were not available. Counts, which are used to calculate crude mortality rates, are randomly rounded to base three. Numbers less than 10 and crude mortality rates based on these numbers have been suppressed (sup). | ||
Sociodemographic factors
Sex and manner of death
Females accounted for 30% of people who died overall, and 53% of people who died by suicide.
Mortality rates were highest among males (18.3 per 100,000 population) and people who died accidentally (10.9 per 100,000 population) (Table 5).
| Sex | All deaths | Accident | Suicide | Undetermined | ||||||||
|---|---|---|---|---|---|---|---|---|---|---|---|---|
| N | % | Rate | N | % | Rate | N | % | Rate | N | % | Rate | |
| Female | 2,805 | 30% | 7.7 | 2,016 | 21% | 5.5 | 627 | 7% | 2.0 | 162 | 2% | 0.5 |
| Male | 6,603 | 70% | 18.3 | 5,886 | 63% | 16.3 | 555 | 6% | 1.8 | 165 | 2% | 0.5 |
| Total | 9,414 | 100% | 13.0 | 7,902 | 84% | 10.9 | 1,182 | 13% | 1.9 | 330 | 2% | 0.5 |
Note: As fewer than 10 people who died were identified as having a non-binary sex in this study, they were randomly assigned to either male or female to ensure that their information was not suppressed due to small numbers. Data from British Columbia were only available for people who experienced accidental or undetermined acute toxicity deaths involving "street drugs" or pharmaceutical substances not prescribed to them. As such, data for people who experienced acute toxicity deaths by suicide or due solely to prescribed substances or alcohol were not available. Accordingly, British Columbia was removed from the Canadian population when calculating mortality rates for people in Canada who died by suicide. Percentages and crude mortality rates are based on counts randomly rounded to base 3. |
||||||||||||
Age
Among all age groups under 70 years old, males and people who died accidentally accounted for the greatest proportion of people who died due to acute toxicity and had the highest associated mortality rates. The proportion of females and people who died by suicide increased with age.
Males accounted for between 49% and 77% of people who died, depending on the age group (Figure 6). Among all people who died, male to female rate ratios peaked among adults 30 to 34 years old at 3.3 (Table 6, Figure 7). People who died accidentally followed a younger age distribution with mortality rates peaking at 30 to 34 years old (at least 23.0 deaths per 100,000 population) and then again at 45 to 49 years old (at least 18.9 deaths per 100,000 population) (Table 7, Figure 7). Mortality rates among people who died by suicide increased with age, peaking among adults 55 to 64 years old (3.1 per 100,000 population) (Table 7).

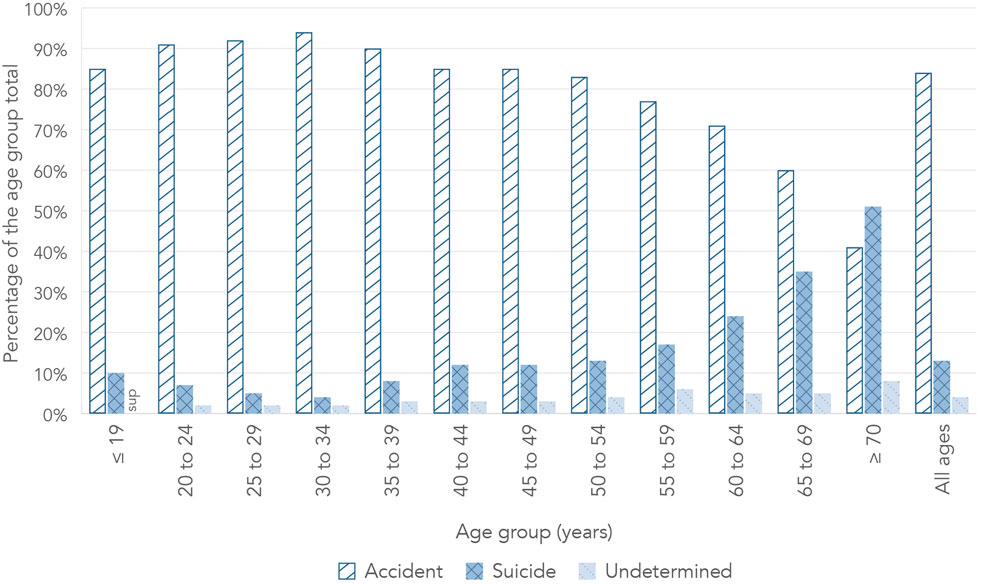
Note: Data from British Columbia were only available for people who experienced accidental or undetermined acute toxicity deaths involving "street drugs" or pharmaceutical substances not prescribed to them. As such, data for people who experienced acute toxicity deaths by suicide or due solely to prescribed substances or alcohol were not available. Percentages are based on counts randomly rounded to base three and those based on numbers less than 10 have been suppressed (sup).
Figure 6 - Text description
| Age group (years) | Sex | Manner of death | |||
|---|---|---|---|---|---|
| Female | Male | Accident | Suicide | Undetermined | |
| ≤ 19 | 45% | 54% | 85% | 10% | sup |
| 20 to 24 | 27% | 73% | 91% | 7% | 2% |
| 25 to 29 | 24% | 76% | 92% | 5% | 2% |
| 30 to 34 | 23% | 77% | 94% | 4% | 2% |
| 35 to 39 | 24% | 76% | 90% | 8% | 3% |
| 40 to 44 | 27% | 73% | 85% | 12% | 3% |
| 45 to 49 | 31% | 69% | 85% | 12% | 3% |
| 50 to 54 | 33% | 67% | 83% | 13% | 4% |
| 55 to 59 | 33% | 67% | 77% | 17% | 6% |
| 60 to 64 | 38% | 63% | 71% | 24% | 5% |
| 65 to 69 | 44% | 56% | 60% | 35% | 5% |
| ≥ 70 | 53% | 49% | 41% | 51% | 8% |
| Unknown | 0% | 0% | 0% | 0% | 0% |
| All ages | 30% | 70% | 84% | 13% | 4% |
| Note: Data from British Columbia were only available for people who experienced accidental or undetermined acute toxicity deaths involving "street drugs" or pharmaceutical substances not prescribed to them. As such, data for people who experienced acute toxicity deaths by suicide or due solely to prescribed substances or alcohol were not available. Percentages are based on counts randomly rounded to base 3 and those based on numbers less than 10 have been suppressed (sup). | |||||
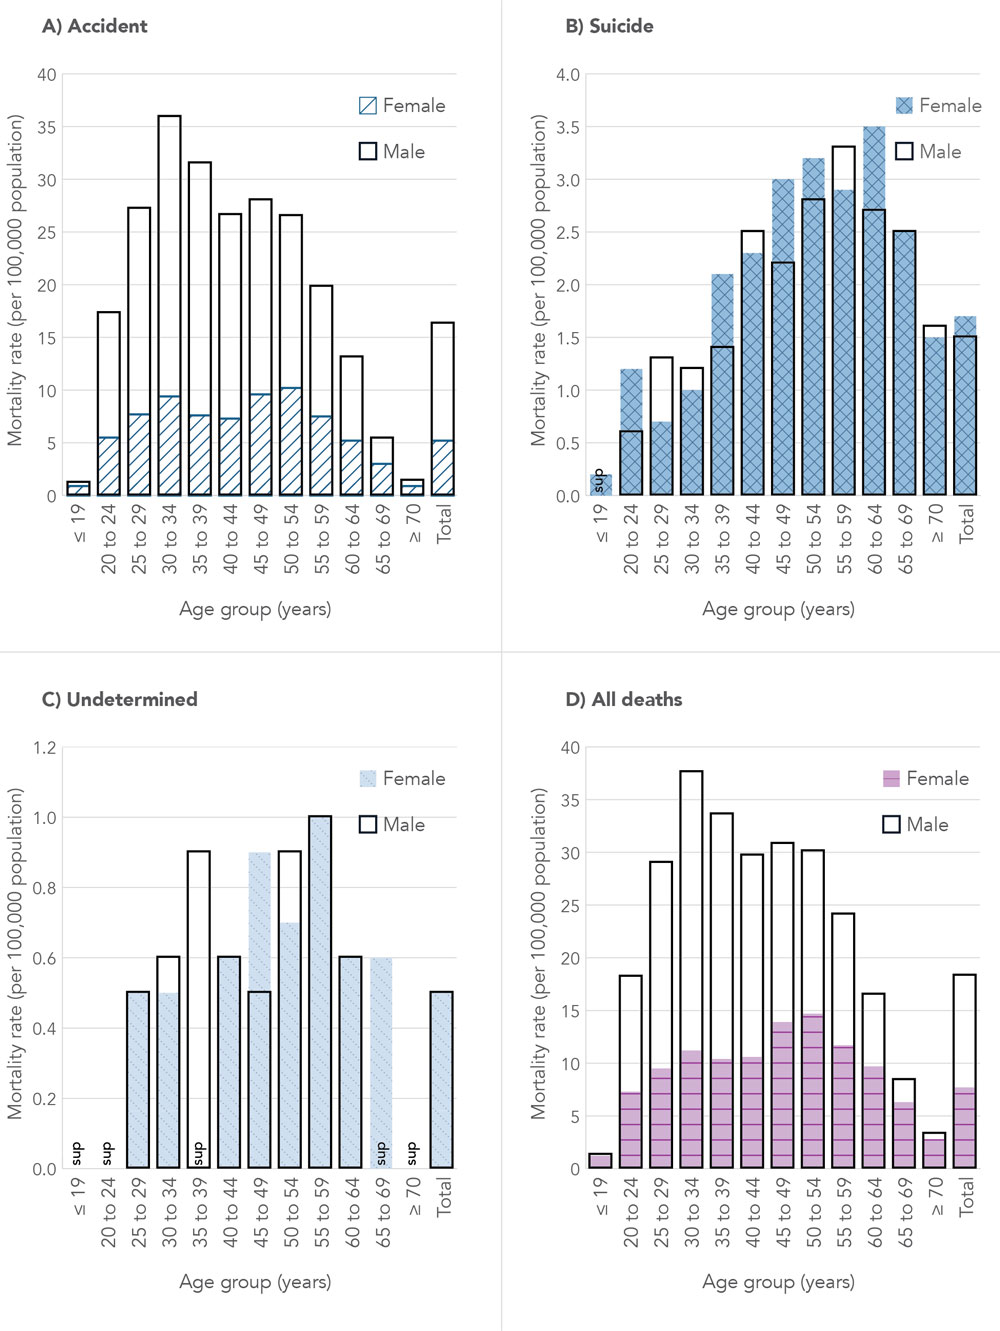
Note: Data from British Columbia were only available for people who experienced accidental or undetermined acute toxicity deaths involving "street drugs" or pharmaceutical substances not prescribed to them. As such, data for people who experienced acute toxicity deaths by suicide or due solely to prescribed substances or alcohol were not available. Accordingly, British Columbia was removed from the Canadian population when calculating mortality rates for people in Canada who died by suicide (graph B). Crude mortality rates are based on counts randomly rounded to base 3 and those based on numbers less than 10 have been suppressed (sup).
Figure 7 - Text description
| Age group (years) | All deaths | Accident | Suicide | Undetermined | ||||||||
|---|---|---|---|---|---|---|---|---|---|---|---|---|
| Female | Male | All | Female | Male | All | Female | Male | All | Female | Male | All | |
| ≤ 19 | 1.2 | 1.3 | 1.3 | 0.9 | 1.2 | 1.1 | 0.2 | sup | 0.1 | sup | sup | sup |
| 20 to 24 | 7.3 | 18.2 | 13.0 | 5.9 | 17.3 | 11.8 | 1.2 | 0.6 | 0.9 | sup | sup | 0.3 |
| 25 to 29 | 9.5 | 29.0 | 19.5 | 8.3 | 27.2 | 18.0 | 0.7 | 1.3 | 1.0 | 0.5 | 0.5 | 0.4 |
| 30 to 34 | 11.2 | 37.6 | 24.5 | 9.9 | 35.9 | 23.0 | 1.0 | 1.2 | 1.0 | 0.5 | 0.6 | 0.5 |
| 35 to 39 | 10.4 | 33.6 | 21.9 | 7.9 | 31.5 | 19.6 | 2.1 | 1.4 | 1.7 | sup | 0.9 | 0.6 |
| 40 to 44 | 10.6 | 29.7 | 20.1 | 7.8 | 26.6 | 17.1 | 2.3 | 2.5 | 2.4 | 0.6 | 0.6 | 0.6 |
| 45 to 49 | 13.9 | 30.8 | 22.3 | 10.0 | 28.0 | 18.9 | 3.0 | 2.2 | 2.6 | 0.9 | 0.5 | 0.7 |
| 50 to 54 | 14.7 | 30.1 | 22.4 | 10.7 | 26.5 | 18.6 | 3.2 | 2.8 | 3.0 | 0.7 | 0.9 | 0.8 |
| 55 to 59 | 11.7 | 24.1 | 17.8 | 7.7 | 19.8 | 13.7 | 2.9 | 3.3 | 3.1 | 1.0 | 1.0 | 1.0 |
| 60 to 64 | 9.7 | 16.5 | 13.0 | 5.4 | 13.1 | 9.2 | 3.5 | 2.7 | 3.1 | 0.6 | 0.6 | 0.7 |
| 65 to 69 | 6.3 | 8.4 | 7.3 | 3.4 | 5.4 | 4.4 | 2.5 | 2.5 | 2.6 | 0.6 | sup | 0.4 |
| ≥ 70 | 2.8 | 3.3 | 3.0 | 1.0 | 1.4 | 1.2 | 1.5 | 1.6 | 1.5 | sup | sup | 0.2 |
| All ages | 7.7 | 18.3 | 13.0 | 5.5 | 16.3 | 10.9 | 1.7 | 1.5 | 1.6 | 0.5 | 0.5 | 0.5 |
Note: Data from British Columbia were only available for people who experienced accidental or undetermined acute toxicity deaths involving "street drugs" or pharmaceutical substances not prescribed to them. As such, data for people who experienced acute toxicity deaths by suicide or due solely to prescribed substances or alcohol were not available. Accordingly, British Columbia was removed from the Canadian population when calculating mortality rates for people in Canada who died by suicide (graph B). Crude mortality rates are based on counts randomly rounded to base 3 and those based on numbers less than 10 have been suppressed. |
||||||||||||
| Age in years | All deaths | Female | Male | Male to female rate ratio (95% confidence interval) | |||
|---|---|---|---|---|---|---|---|
| % | Rate | % | Rate | % | Rate | ||
| Median | 43 |
47 |
41 |
n/a | |||
| Average age (standard deviation) | 43.0 (13.9) |
45.3 (15.0) |
42.1 (13.2) |
n/a | |||
| Age group | |||||||
| 0 to 19 | 2% | 1.3 | 3% | 1.2 | 2% | 1.3 | 1.1 (0.9, 1.5) |
| 20 to 24 | 7% | 13.0 | 6% | 7.3 | 7% | 18.2 | 2.5 (2.1, 3.0) |
| 25 to 29 | 10% | 19.5 | 8% | 9.5 | 11% | 29.0 | 3.0 (2.6, 3.5) |
| 30 to 34 | 13% | 24.5 | 10% | 11.2 | 14% | 37.6 | 3.3 (2.9, 3.8) |
| 35 to 39 | 11% | 21.9 | 9% | 10.4 | 12% | 33.6 | 3.2 (2.8, 3.7) |
| 40 to 44 | 10% | 20.1 | 9% | 10.6 | 10% | 29.7 | 2.8 (2.4, 3.2) |
| 45 to 49 | 11% | 22.3 | 12% | 13.9 | 11% | 30.8 | 2.2 (1.9, 2.5) |
| 50 to 54 | 13% | 22.4 | 14% | 14.7 | 12% | 30.1 | 2.1 (1.8, 2.3) |
| 55 to 59 | 10% | 17.8 | 11% | 11.7 | 10% | 24.1 | 2.1 (1.8, 2.4) |
| 60 to 64 | 6% | 13.0 | 8% | 9.7 | 6% | 16.5 | 1.7 (1.5, 2.0) |
| 65 to 69 | 3% | 7.3 | 5% | 6.3 | 2% | 8.4 | 1.3 (1.1, 1.7) |
| 70 years or more | 3% | 3.0 | 4% | 2.8 | 2% | 3.3 | 1.2 (0.9, 1.5) |
| All ages | 100% | 13.0 | 100% | 7.7 | 100% | 18.3 | 2.4 (2.3, 2.5) |
Note: Data from British Columbia were only available for people who experienced accidental or undetermined acute toxicity deaths involving "street drugs" or pharmaceutical substances not prescribed to them. As such, data for people who experienced acute toxicity deaths by suicide or due solely to prescribed substances or alcohol were not available. "n/a" indicates not applicable. Percentages and crude mortality rates are based on counts randomly rounded to base 3, and those based on numbers less than 10 have been suppressed (sup). |
|||||||
| Age in years | Accident | Suicide | Undetermined | |||
|---|---|---|---|---|---|---|
| % | Rate | % | Rate | % | Rate | |
| Median age | 41 |
53 |
49 |
|||
| Average age (standard deviation) | 41.5 (13.0) |
51.7 (15.2) |
47.5 (15.4) |
|||
| Age group | ||||||
| 0 to 19 | 2% | 1.1 | 2% | 0.1 | sup | sup |
| 20 to 24 | 7% | 11.8 | 4% | 0.9 | 4% | 0.3 |
| 25 to 29 | 11% | 18.0 | 4% | 1.0 | 6% | 0.4 |
| 30 to 34 | 15% | 23.0 | 4% | 1.0 | 7% | 0.5 |
| 35 to 39 | 12% | 19.6 | 7% | 1.7 | 9% | 0.6 |
| 40 to 44 | 10% | 17.1 | 9% | 2.4 | 9% | 0.6 |
| 45 to 49 | 12% | 18.9 | 11% | 2.6 | 11% | 0.7 |
| 50 to 54 | 13% | 18.6 | 14% | 3.0 | 14% | 0.8 |
| 55 to 59 | 9% | 13.7 | 14% | 3.1 | 16% | 1.0 |
| 60 to 64 | 5% | 9.2 | 12% | 3.1 | 10% | 0.7 |
| 65 to 69 | 2% | 4.4 | 9% | 2.6 | 5% | 0.4 |
| 70 years or more | ≤1% | 1.2 | 10% | 1.5 | 5% | 0.2 |
| All ages | 100% | 10.9 | 100% | 1.6 | 100% | 0.5 |
Note: Data from British Columbia were only available for people who experienced accidental or undetermined acute toxicity deaths involving "street drugs" or pharmaceutical substances not prescribed to them. As such, data for people who experienced acute toxicity deaths by suicide or due solely to prescribed substances or alcohol were not available. Accordingly, British Columbia was removed from the Canadian population when calculating mortality rates for people in Canada who died by suicide. Percentages and crude mortality rates are based on counts randomly rounded to base 3, and those based on numbers less than 10 have been suppressed (sup). |
||||||
Home life
Place of residence
The majority of people who died were residing in a private dwelling at the time of death (at least 73%). A smaller percentage were experiencing homelessness (at least 8%) or living in supportive or transitional housing (at least 5%). At least 10% of people who died had been released from an institution in the previous 12 months.
Residence type was unknown or unavailable for 11% of people who died (Table 8). The percentage of people living in a private dwelling was greater among females (at least 77%) compared to males (at least 71%; p < 0.05), and among people who died by suicide (at least 85%) compared to accidental deaths (at least 71%; p < 0.05) (Table 8). Conversely, the percentage of people identified as experiencing homelessness was greater among males (at least 8%) compared to females (at least 6%; p < 0.05), and among people who died by accident (at least 9%) compared to people who died by suicide (at least ≤ 1%; p < 0.05). More information is available in the analysis on homelessness and substance-related acute toxicity deathsFootnote 27 (note that values may be different since preliminary data were used for the brief report). Similarly, the percentage of people living in supportive or transitional housing was greater among males (at least 6%) compared to females (at least 4%; p < 0.05).
There was evidence in coroner and medical examiner files that at least 10% of people who died had recently been released from an institution within the 12 months before death, including at least 10% of females and at least 9% of males (Table 9). There was also evidence in the coroner and medical examiner files that at least 7% of people who died had recently moved, including at least 6% of females and at least 7% of males.
| Type of residence | All deaths | Sex | Manner of death | |||
|---|---|---|---|---|---|---|
| Female | Male | Accident | Suicide | Undetermined | ||
| Private dwelling | 73% | 77% | 71% | 71% | 85% | 78% |
| Experiencing homelessness | 8% | 6% | 8% | 9% | ≤1% | sup |
| Supportive or transitional housing | 5% | 4% | 6% | 6% | sup | sup |
| Other | 4% | 3% | 4% | 3% | 4% | 5% |
| Unknown or unavailable | 11% | 11% | 11% | 11% | 9% | 11% |
Note: Private dwelling was defined as a separate set of living quarters designed (or converted) for human habitation that includes a source of heat or power and an enclosed space that provides shelter/protection from the elements. Experiencing homelessness includes unsheltered, emergency shelter, provisionally accommodated, or at immediate risk of homelessness. Other includes hotels or motels, retirement homes or senior residences, correctional facility or police custody, substance use or addictions treatment facility or harm reduction residence, long-term care facility or nursing home, hospital, and mental health facilities. Supportive housing is generally long-term accommodation that provides a varying range of supportive services depending on the needs of residents. It includes accommodation for people facing barriers to housing or living independently (for example, people with a mental illness, who use substances, or who have lost autonomy in older age). Transitional housing is intended to maximize independence and support the development of social, vocational, recreational, and life skills. These homes can be used to house children and youth, adults or seniors with chronic disabilities, persons seeking recovery from substance use, or persons re-integrating with the community following incarceration. It is considered an intermediate step between emergency shelter and supportive housing and has limits on how long a person or family can stay. Data from British Columbia were only available for people who experienced accidental or undetermined acute toxicity deaths involving "street drugs" or pharmaceutical substances not prescribed to them. As such, data for people who experienced acute toxicity deaths by suicide or due solely to prescribed substances or alcohol were not available. Percentages are based on counts randomly rounded to base 3, and those based on numbers less than 10 have been suppressed (sup). |
||||||
| Recent transitions in where people lived | All deaths | Female | Male |
|---|---|---|---|
| Recently moved from another place | 7% | 6% | 7% |
| Recent release from an institution | 10% | 10% | 9% |
Note: As data on recent moves were not available for 681 people from Ontario, they were excluded from this analysis. Examples of institutions include correctional facilities, remand centres, young offender centre, hospitals, mental health facilities, long-term residential health facilities (for example, nursing homes), other health facilities, or supervised residential facilities that may or may not be related to alcohol or substance use treatment. Data from British Columbia were only available for people who experienced accidental or undetermined acute toxicity deaths involving "street drugs" or pharmaceutical substances not prescribed to them. As such, data for people who experienced acute toxicity deaths by suicide or due solely to prescribed substances or alcohol were not available. Percentages are based on counts randomly rounded to base 3. |
|||
Who the person who died was living with
Based on available information, people who died commonly lived alone (at least 24%) or with family (at least 18%). Differences were observed across sexes and manners of death.
While at least 24% of all people who died lived alone, the percentage was greater among deaths by suicide (at least 36%) and undetermined deaths (at least 33%) compared to accidental deaths (at least 21%) (Figure 8). The percentage who lived alone was similar for females (at least 25%) compared to males (at least 24%). While at least 18% of all people who died lived with family members, the percentage was greater among females (at least 26%) compared to males (at least 14%), and among deaths by suicide (at least 24%) and undetermined deaths (at least 21%) compared to accidental deaths (at least 17%).
Information on who the person who died was living with was unknown or unavailable for 25% of people who died, with a greater proportion of missing information among those who died accidentally (27%) compared to people who died by suicide (19%) and those whose manner of death was undetermined deaths (21%).
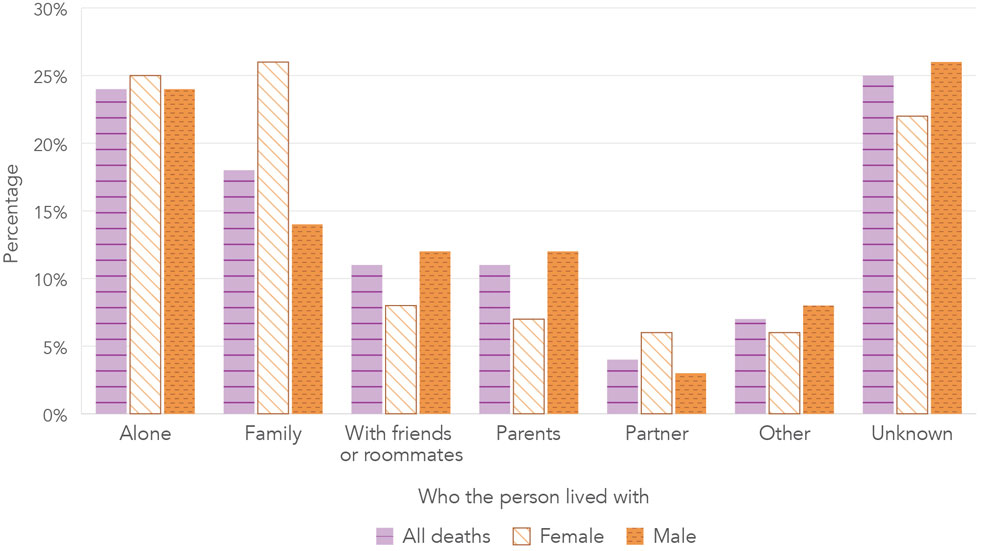
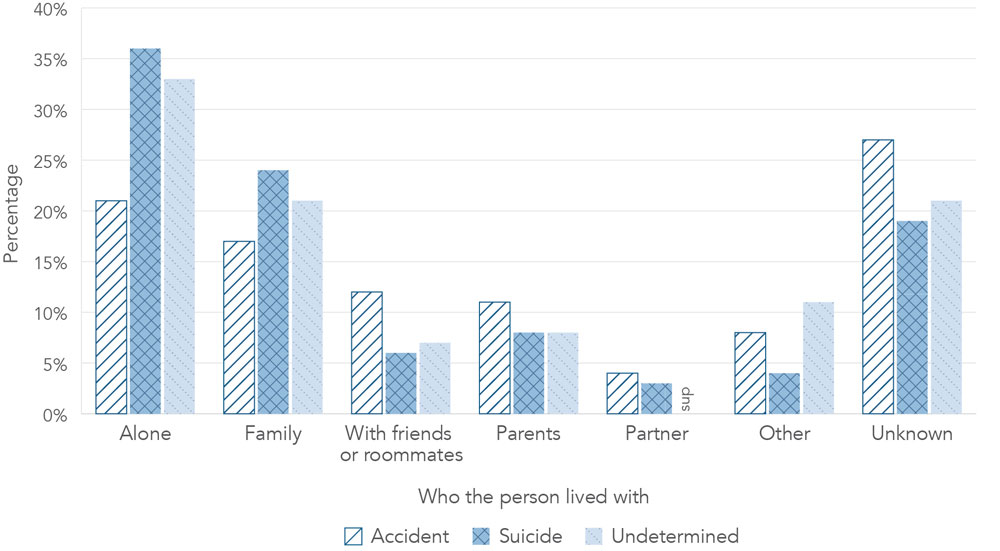
Note: As data on who the person was living with were systematically not available for British Columbia and for 681 people from Ontario, these 2 groups were excluded from this analysis. The family category includes spouse, common-law partners, and children. The partner category includes any partners for which there was no evidence that they were a common-law partner. Percentages are based on counts randomly rounded to base 3, and those based on numbers less than 10 have been suppressed (sup).
Figure 8 - Text description
| Who the person lived with | All deaths | Sex | Manner of Death | |||
|---|---|---|---|---|---|---|
| Female | Male | Accident | Suicide | Undetermined | ||
| Alone | 24% | 25% | 24% | 21% | 36% | 33% |
| Family | 18% | 26% | 14% | 17% | 24% | 21% |
| With friends or roommates | 11% | 8% | 12% | 12% | 6% | 7% |
| Parents | 11% | 7% | 12% | 11% | 8% | 8% |
| Partner | 4% | 6% | 3% | 4% | 3% | sup |
| Other | 7% | 6% | 8% | 8% | 4% | 11% |
| Unknown | 25% | 22% | 26% | 27% | 19% | 21% |
| Note: As data on who the person was living with were systematically not available for British Columbia and 681 people from Ontario, these two groups were excluded from this analysis. The family category includes spouse, common-law partners, and children. The partner category includes any partners for which there was no evidence that they were a common-law partner. Percentages are based on counts randomly rounded to base three and those based on numbers less than 10 have been suppressed. | ||||||
Relationships
Although the greatest percentage of people 15 years and older who died were single (at least 31%), mortality rates were greatest among people who were divorced or separated (at least 24.3 deaths per 100,000 population). At least 34% of people who died had at least 1 child of any age.
Relationship status was unknown for 28% of people 15 years and older who died. Mortality rates were greatest among people who were divorced and or separated people (at least 24.3 deaths per 100,000 population), followed by people who were single (at least 17.8 deaths per 100,000 population). Males had higher mortality rates than females across all marital status categories (Figure 9). Of note, while divorced or separated males accounted for at least 13% of males who died, this group had the highest mortality rate (at least 41.3 per 100,000 population). While the greatest proportion of accidental deaths occurred in single people (at least 34%), the greatest proportion of deaths by suicide occurred in common law or married people (at least 22%), closely followed by divorced and separated people (at least 19%) (Figure 10).
At least 34% of people who died had children, with the percentage being greater among females (at least 47%) compared to males (at least 25%) (Table 10). At least 11% of people who died had 1 or more children under the age of 18 years. Information on if the person who died had children was unknown for 60% of cases.

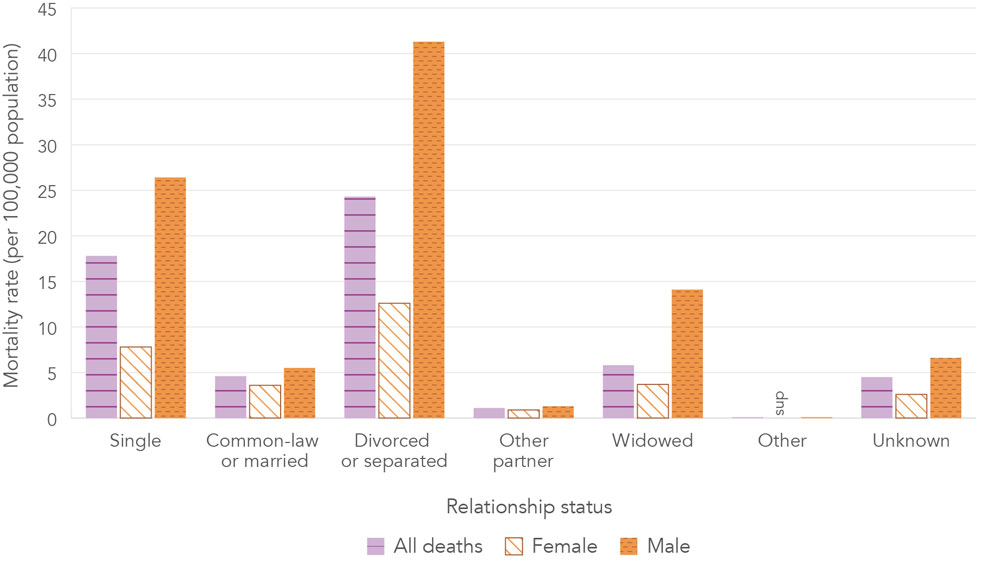
Note: Data from British Columbia were only available for people who experienced accidental or undetermined acute toxicity deaths involving "street drugs" or pharmaceutical substances not prescribed to them. As such, data for people who experienced acute toxicity deaths by suicide or due solely to prescribed substances or alcohol were not available. Accordingly, British Columbia was removed from the Canadian population when calculating mortality rates for people in Canada who died by suicide. Percentages and crude mortality rates are based on counts randomly rounded to base three, and those based on numbers less than 10 have been suppressed (sup).
Figure 9 - Text description
| Relationship status | All deaths | Sex | Manner of death | |||||||||
|---|---|---|---|---|---|---|---|---|---|---|---|---|
| Female | Male | Accident | Suicide | Undetermined | ||||||||
| % | Rate | % | Rate | % | Rate | % | Rate | % | Rate | % | Rate | |
| Single | 31% | 17.8 | 21% | 7.8 | 36% | 26.4 | 34% | 16.4 | 16% | 1.3 | 13% | 0.3 |
| Common-law or married | 16% | 4.6 | 22% | 3.6 | 14% | 5.5 | 16% | 3.6 | 22% | 0.9 | 19% | 0.2 |
| Divorced or separated | 13% | 24.3 | 14% | 12.6 | 13% | 41.3 | 12% | 19.2 | 19% | 5.2 | 10% | 0.7 |
| Other partner | 9% | 1.1 | 12% | 0.9 | 7% | 1.3 | 9% | 0.9 | 8% | 0.2 | 13% | ≤0.1 |
| Widowed | 2% | 5.8 | 3% | 3.7 | ≤1% | 14.1 | ≤1% | 3.1 | 7% | 2.8 | sup | sup |
| Other | ≤1% | ≤0.1 | sup | sup | ≤1% | ≤0.1 | ≤1% | ≤0.1 | 0% | 0.0 | sup | sup |
| Unknown | 28% | 4.5 | 27% | 2.6 | 28% | 6.6 | 27% | 3.7 | 28% | 0.7 | 41% | 0.2 |
| Note: Data from British Columbia were only available for people who experienced accidental or undetermined acute toxicity deaths involving "street drugs" or pharmaceutical substances not prescribed to them. As such, data for people who experienced acute toxicity deaths by suicide or due solely to prescribed substances or alcohol were not available. Accordingly, British Columbia was removed from the Canadian population when calculating mortality rates for people in Canada who died by suicide. Percentages and crude mortality rates are based on counts randomly rounded to base three, and those based on numbers less than 10 have been suppressed (sup). | ||||||||||||
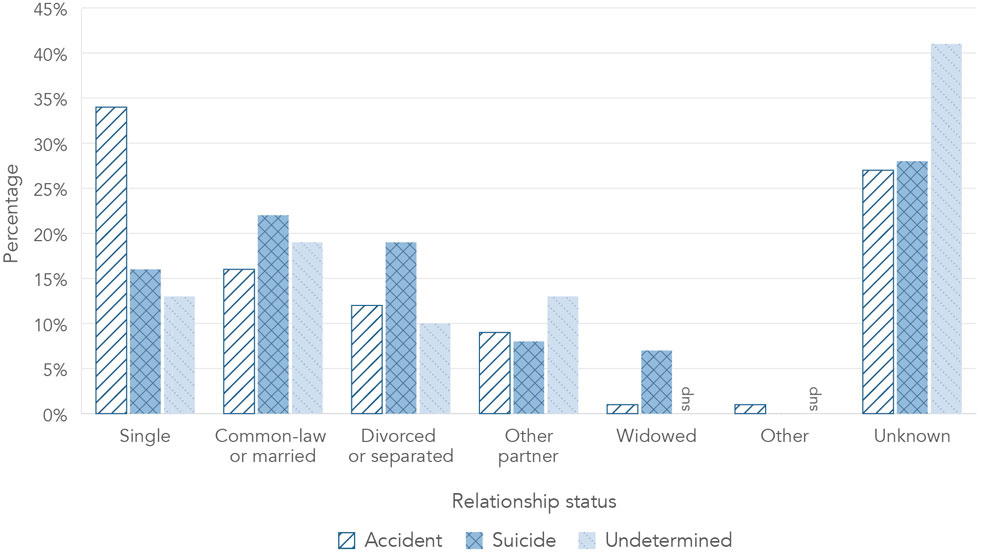
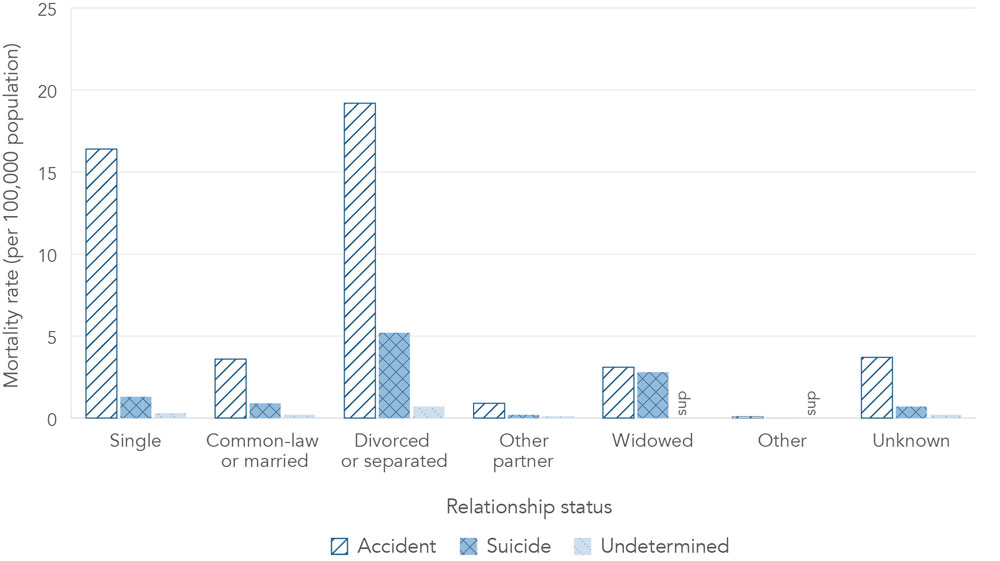
Note: Data from British Columbia were only available for people who experienced accidental or undetermined acute toxicity deaths involving "street drugs" or pharmaceutical substances not prescribed to them. As such, data for people who experienced acute toxicity deaths by suicide or due solely to prescribed substances or alcohol were not available. Accordingly, British Columbia was removed from the Canadian population when calculating mortality rates for people in Canada who died by suicide. Percentages and crude mortality rates are based on counts randomly rounded to base three, and those based on numbers less than 10 have been suppressed (sup).
Figure 10 - Text description
| Relationship status | All deaths | Sex | Manner of death | |||||||||
|---|---|---|---|---|---|---|---|---|---|---|---|---|
| Female | Male | Accident | Suicide | Undetermined | ||||||||
| % | Rate | % | Rate | % | Rate | % | Rate | % | Rate | % | Rate | |
| Single | 31% | 17.8 | 21% | 7.8 | 36% | 26.4 | 34% | 16.4 | 16% | 1.3 | 13% | 0.3 |
| Common-law or married | 16% | 4.6 | 22% | 3.6 | 14% | 5.5 | 16% | 3.6 | 22% | 0.9 | 19% | 0.2 |
| Divorced or separated | 13% | 24.3 | 14% | 12.6 | 13% | 41.3 | 12% | 19.2 | 19% | 5.2 | 10% | 0.7 |
| Other partner | 9% | 1.1 | 12% | 0.9 | 7% | 1.3 | 9% | 0.9 | 8% | 0.2 | 13% | ≤0.1 |
| Widowed | 2% | 5.8 | 3% | 3.7 | ≤1% | 14.1 | ≤1% | 3.1 | 7% | 2.8 | sup | sup |
| Other | ≤1% | ≤0.1 | sup | sup | ≤1% | ≤0.1 | ≤1% | ≤0.1 | 0% | 0.0 | sup | sup |
| Unknown | 28% | 4.5 | 27% | 2.6 | 28% | 6.6 | 27% | 3.7 | 28% | 0.7 | 41% | 0.2 |
| Note: Data from British Columbia were only available for people who experienced accidental or undetermined acute toxicity deaths involving "street drugs" or pharmaceutical substances not prescribed to them. As such, data for people who experienced acute toxicity deaths by suicide or due solely to prescribed substances or alcohol were not available. Accordingly, British Columbia was removed from the Canadian population when calculating mortality rates for people in Canada who died by suicide. Percentages and crude mortality rates are based on counts randomly rounded to base three, and those based on numbers less than 10 have been suppressed (sup). | ||||||||||||
| Children | All deaths | Sex | Manner of death | |||
|---|---|---|---|---|---|---|
| Female | Male | Accident | Suicide | Undetermined | ||
| Had children, including children under 18 years old | 11% | 13% | 9% | 11% | 9% | 11% |
| Only had children 18 years old or older | 9% | 15% | 5% | 6% | 17% | 14% |
| Had children, but unknown if any were less than 18 years old | 14% | 19% | 11% | 13% | 19% | 13% |
| Did not have children | 7% | 7% | 7% | 6% | 9% | 9% |
| Unknown | 60% | 45% | 68% | 64% | 46% | 54% |
Note: As data on whether or not people who died had children were systematically not available for British Columbia and 681 people from Ontario, these 2 groups were excluded from this analysis. Percentages are based on counts randomly rounded to base 3. |
||||||
Work life
Employment status or income source
Information on employment or income source was missing for 49% of people who died. At least 20% of people who died were employed and at least 18% were unemployed.
After employed and unemployed, the most common employment or income source categories were people participating in a social assistance program (at least 7%) or receiving disability support (at least 6%).
Across the sexes, significant differences were noted in the percent of people employed (at least 11% among females versus at least 24% in males, p < 0.05) and retired (at least 3% among females versus at least 2% among males, p < 0.05) (Table 11).
Comparing people who died accidentally with those who died by suicide, significant differences were noted in the percent of people employed (21% versus 15%, p < 0.05), unemployed (18% versus 14%, p < 0.05), people who were retired (≤1% versus 8%, p < 0.05), and who were participating in a social assistance program (7% versus 3%, p-value <0.05).
A note about data on employment and income source: Data on employment and income source are not routinely collected during death investigations and how they are collected may differ across investigations. The numbers published here are minimum proportions and are likely affected by various forms of collection bias. As such, findings should be interpreted with caution. With this caveat in mind, this report is one of a limited number of national resources containing information on the employment and income source of people who died due to acute toxicity in Canada.
| Employment status or income source | All deaths | Sex | Manner of death | |||
|---|---|---|---|---|---|---|
| Female | Male | Accident | Suicide | Undetermined | ||
| Employed | 20% | 11% | 24% | 21% | 15% | 11% |
| Unemployed | 18% | 16% | 18% | 18% | 14% | 15% |
| Retired | 2% | 3% | 2% | ≤1% | 8% | 4% |
| Student | 2% | 2% | 2% | 2% | 2% | sup |
| Social assistance program | 7% | 7% | 7% | 7% | 3% | 5% |
| Disability support | 6% | 7% | 6% | 6% | 6% | 5% |
| Illegal sources of income | 2% | ≤1% | 2% | 2% | sup | sup |
| Permanently unable to work due to physical or mental disability | ≤1% | ≤1% | ≤1% | ≤1% | 2% | sup |
| Other | 2% | 3% | 2% | 2% | 5% | 4% |
| Unknown | 49% | 56% | 46% | 48% | 51% | 58% |
Note: Categories are not mutually exclusive. Employed includes full-time, part-time, and seasonal workers. Student includes full-time or part-time students. Other includes personal or family responsibilities as well as other employment or income sources. Data from British Columbia were only available for people who experienced accidental or undetermined acute toxicity deaths involving "street drugs" or pharmaceutical substances not prescribed to them. As such, data for people who experienced acute toxicity deaths by suicide or due solely to prescribed substances or alcohol were not available. Percentages are based on counts randomly rounded to base 3, and percentages based on numbers less than 10 have been suppressed (sup). |
||||||
Occupation and industry
Based on available data, mortality rates were greatest among people 15 years and older working in an occupation categorized as "trades, transport, equipment operator, or related" (at least 21.4 deaths per 100,000 population), and in the construction industry (at least 19.6 deaths per 100,000 population), though differences exist across sexes and manners of death.
Information on occupation and work industry was not available in coroner and medical examiner files for 75% and 79% of people who died, respectively. As such, these findings should be interpreted with caution.
Mortality rates were highest among people working in trades, transport, equipment operator, or related occupations overall (at least 21.4 per 100,000 population), followed by people working in natural resources, agriculture, and related production (at least 14.1 per 100,000 population); art, culture, recreation, and sport (at least 7.5 per 100,000 population); and health (at least 5.8 per 100,000 population) (Figure 11 and Table 12). While mortality rates were highest among people working in trades, transport, equipment operator, or related occupations among females (at least 13.7 per 100,000 population), males (at least 21.9 per 100,000 population), and accidental deaths (at least 20.5 per 100,000 population), occupations in health had the highest mortality rates (at least 2.5 per 100,000 population) among people who died by suicide.
Industries with high mortality rates include construction (at least 19.6 per 100,000 population); mining, quarrying, and oil and gas extraction (at least 13.8 per 100,000 population); transportation and warehousing (at least 11.6 per 100,000 population); and arts, entertainment, and recreation (at least 10.3 per 100,000 population) (Figure 12 and Table 13). These were also the top 4 industries among males and accidental deaths. Among females, the top industries included construction (at least 5.3 per 100,000 population), other services (at least 4.4 per 100,000 population),, and accommodation and food services (at least 4.4 per 100,000 population). Among deaths by suicide, the industries with the highest rates included arts, entertainment, and recreation (at least 1.9 per 100,000 population) and health care and social assistance (at least 1.6 per 100,000 population).
A note about the data on occupation and work industry: Data on occupation and industry are not systematically collected during death investigations and how they are collected may differ across investigations. As such, findings should be interpreted with caution. The numbers published here are minimum proportions and rates and are likely affected by various forms of collection bias. With this caveat in mind, this report is one of a limited number of national resources containing information on the occupation and work industry of people who died due to acute toxicity in Canada.
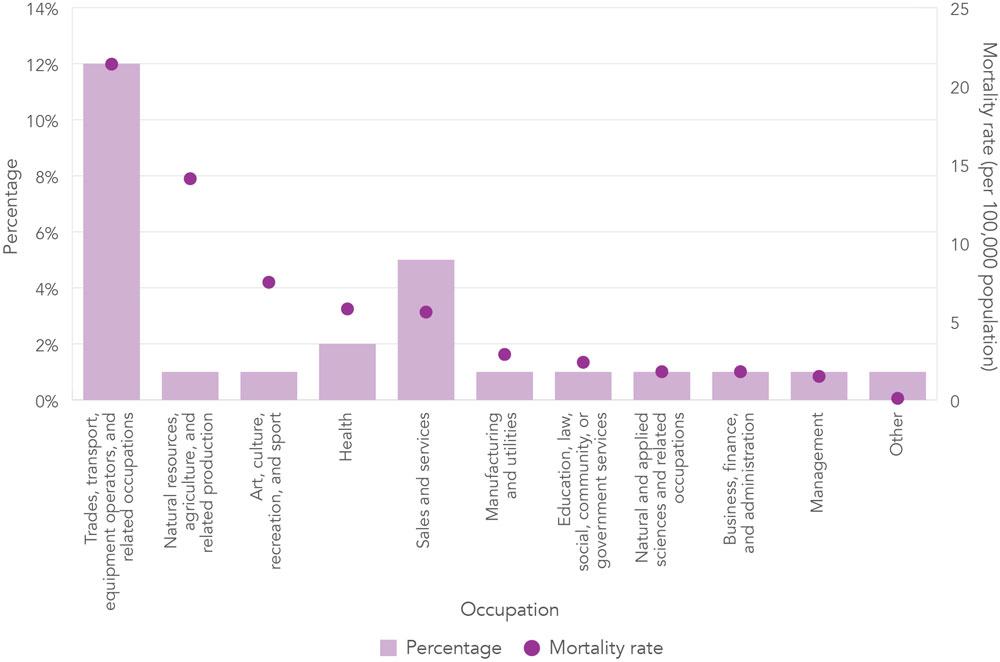
Note: Occupation was unknown for 75% of people 15 years and older who died due to a substance-related acute toxicity. Categories are not mutually exclusive. Data from British Columbia were only available for people who experienced accidental or undetermined acute toxicity deaths involving "street drugs" or pharmaceutical substances not prescribed to them. As such, data for people who experienced acute toxicity deaths by suicide or due solely to prescribed substances or alcohol were not available. Percentages and crude mortality rates are based on counts randomly rounded to base 3 and those based on numbers less than 10 have been suppressed (sup).
Figure 11 - Text description
| Occupation | Percentage | Mortality rate |
|---|---|---|
| Trades, transport, equipment operators, and related occupations | 12% | 21.4 |
| Natural resources, agriculture, and related production | ≤1% | 14.1 |
| Art, culture, recreation, and sport | ≤1% | 7.5 |
| Health | 2% | 5.8 |
| Sales and services | 5% | 5.6 |
| Manufacturing and utilities | ≤1% | 2.9 |
| Education, law, social, community, or government services | ≤1% | 2.4 |
| Natural and applied sciences and related occupations | ≤1% | 1.8 |
| Business, finance, and administration | ≤1% | 1.8 |
| Management | ≤1% | 1.5 |
| Other | ≤1% | 0.1 |
| Unknown | 75% | 18.9 |
| Note: Occupation was unknown for 75% of people 15 years and older who died due to a substance-related acute toxicity. Categories are not mutually exclusive. Data from British Columbia were only available for people who experienced accidental or undetermined acute toxicity deaths involving "street drugs" or pharmaceutical substances not prescribed to them. As such, data for people who experienced acute toxicity deaths by suicide or due solely to prescribed substances or alcohol were not available. Percentages and crude mortality rates are based on counts randomly rounded to base three and those based on numbers less than 10 have been suppressed. | ||
| Occupation | All deaths | Female | Male | Accident | Suicide | |||||
|---|---|---|---|---|---|---|---|---|---|---|
| % | Rate | % | Rate | % | Rate | % | Rate | % | Rate | |
| Trades, transport, equipment operators, and related occupations | 12% | 21.4 | 2% | 13.7 | 17% | 21.9 | 14% | 20.5 | 3% | 0.8 |
| Natural resources, agriculture, and related production | ≤1% | 14.1 | sup | sup | 2% | 16.3 | ≤1% | 13.3 | sup | sup |
| Art, culture, recreation, and sport | ≤1% | 7.5 | ≤1% | 2.0 | ≤1% | 14.1 | ≤1% | 6.2 | sup | sup |
| Health | 2% | 5.8 | 4% | 5.1 | ≤1% | 8.6 | ≤1% | 3.4 | 5% | 2.5 |
| Sales and services | 5% | 5.6 | 6% | 3.3 | 5% | 8.5 | 5% | 4.8 | 4% | 0.7 |
| Manufacturing and utilities | ≤1% | 2.9 | sup | sup | ≤1% | 3.9 | ≤1% | 2.4 | sup | sup |
| Education, law, social, community, or government services | ≤1% | 2.4 | ≤1% | 1.4 | ≤1% | 4.5 | ≤1% | 1.6 | 2% | 0.7 |
| Natural and applied sciences and related occupations | ≤1% | 1.8 | 0% | 0.0 | ≤1% | 2.3 | ≤1% | 1.8 | sup | sup |
| Business, finance, and administration | ≤1% | 1.8 | 2% | 1.1 | ≤1% | 3.5 | ≤1% | 1.5 | 2% | 0.4 |
| Management | ≤1% | 1.5 | ≤1% | 0.8 | ≤1% | 2.0 | ≤1% | 1.3 | sup | sup |
| Other | ≤1% | 0.1 | ≤1% | 0.1 | ≤1% | 0.2 | ≤1% | 0.1 | sup | sup |
| Unknown | 75% | 18.9 | 84% | 13.2 | 71% | 24.1 | 74% | 15.6 | 81% | 2.9 |
| Note: Occupation was unknown for 75% of people 15 years and older who died due to a substance-related acute toxicity. Categories are not mutually exclusive. Data from British Columbia were only available for people who experienced accidental or undetermined acute toxicity deaths involving "street drugs" or pharmaceutical substances not prescribed to them. As such, data for people who experienced acute toxicity deaths by suicide or due solely to prescribed substances or alcohol were not available. Accordingly, British Columbia was removed from the Canadian population when calculating mortality rates for people in Canada who died by suicide. Percentages and crude mortality rates are based on counts randomly rounded to base 3 and those based on numbers less than 10 have been suppressed (sup). As the majority of data was suppressed for those whose manner of death was undetermined, they were removed from this table. | ||||||||||
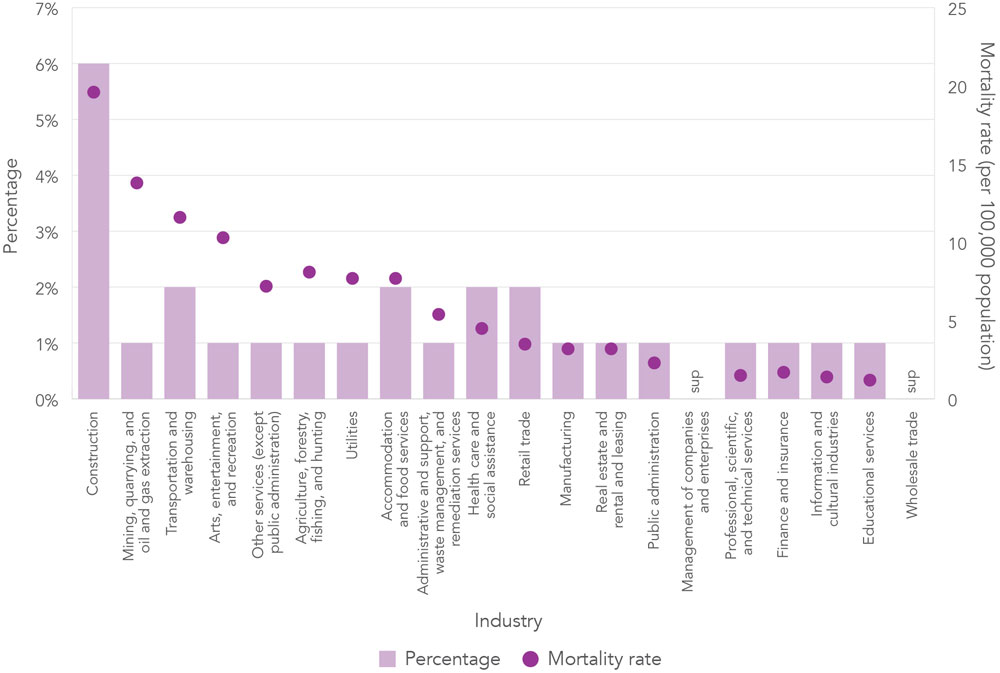
Note: Industry was unknown for 79% of people 15 years and older who died due to a substance-related acute toxicity. Categories are not mutually exclusive. Data from British Columbia were only available for people who experienced accidental or undetermined acute toxicity deaths involving "street drugs" or pharmaceutical substances not prescribed to them. As such, data for people who experienced acute toxicity deaths by suicide or due solely to prescribed substances or alcohol were not available. Percentages and crude mortality rates are based on counts randomly rounded to base 3 and those based on numbers less than 10 have been suppressed (sup).
Figure 12 - Text description
| Industry | Percentage | Mortality rate |
|---|---|---|
| Construction | 6% | 19.6 |
| Mining, quarrying, and oil and gas extraction | ≤1% | 13.8 |
| Transportation and warehousing | 2% | 11.6 |
| Arts, entertainment, and recreation | ≤1% | 10.3 |
| Other services (except public administration) | ≤1% | 7.2 |
| Agriculture, forestry, fishing, and hunting | ≤1% | 8.1 |
| Utilities | ≤1% | 7.7 |
| Accommodation and food services | 2% | 7.7 |
| Administrative and support, waste management, and remediation services | ≤1% | 5.4 |
| Health care and social assistance | 2% | 4.5 |
| Retail trade | 2% | 3.5 |
| Manufacturing | ≤1% | 3.2 |
| Real estate and rental and leasing | ≤1% | 3.2 |
| Public administration | ≤1% | 2.3 |
| Management of companies and enterprises | sup | sup |
| Professional, scientific, and technical services | ≤1% | 1.5 |
| Finance and insurance | ≤1% | 1.7 |
| Information and cultural industries | ≤1% | 1.4 |
| Educational services | ≤1% | 1.2 |
| Wholesale trade | sup | sup |
| Unknown | 79% | 19.9 |
| Note: Industry was unknown for 79% of people 15 years and older who died due to a substance-related acute toxicity. Categories are not mutually exclusive. Data from British Columbia were only available for people who experienced accidental or undetermined acute toxicity deaths involving "street drugs" or pharmaceutical substances not prescribed to them. As such, data for people who experienced acute toxicity deaths by suicide or due solely to prescribed substances or alcohol were not available. Percentages and crude mortality rates are based on counts randomly rounded to base 3 and those based on numbers less than 10 have been suppressed. | ||
| Industry | All deaths | Sex | Manner of death | |||||||
|---|---|---|---|---|---|---|---|---|---|---|
| Female | Male | Accident | Suicide | |||||||
| % | Rate | % | Rate | % | Rate | % | Rate | % | Rate | |
| Construction | 6% | 19.6 | ≤1% | 5.3 | 8% | 21.6 | 6% | 18.7 | 2% | 0.9 |
| Mining, quarrying, and oil and gas extraction | ≤1% | 13.8 | sup | sup | ≤1% | 15.7 | ≤1% | 12.7 | sup | sup |
| Transportation and warehousing | 2% | 11.6 | ≤1% | 2.7 | 3% | 14.6 | 2% | 10.6 | ≤1% | 0.8 |
| Arts, entertainment, and recreation | ≤1% | 10.3 | ≤1% | 3.2 | ≤1% | 17.1 | ≤1% | 8.3 | ≤1% | 1.9 |
| Other services (except public administration) | ≤1% | 7.2 | ≤1% | 4.4 | ≤1% | 10.5 | ≤1% | 6.4 | ≤1% | 0.9 |
| Agriculture, forestry, fishing, and hunting | ≤1% | 8.1 | sup | sup | ≤1% | 10.6 | ≤1% | 7.4 | sup | sup |
| Utilities | ≤1% | 7.7 | sup | sup | ≤1% | 9.0 | ≤1% | 7.7 | sup | sup |
| Accommodation and food services | 2% | 7.7 | 2% | 4.4 | 2% | 12.3 | 2% | 6.9 | 2% | 0.8 |
| Administrative and support, waste management, and remediation services | ≤1% | 5.4 | ≤1% | 3.5 | ≤1% | 7.1 | ≤1% | 4.9 | sup | sup |
| Health care and social assistance | 2% | 4.5 | 4% | 3.5 | ≤1% | 8.6 | ≤1% | 2.7 | 5% | 1.6 |
| Retail trade | 2% | 3.5 | 2% | 2.3 | ≤1% | 3.7 | 2% | 3.0 | 2% | 0.5 |
| Manufacturing | ≤1% | 3.2 | sup | sup | ≤1% | 4.3 | ≤1% | 2.7 | ≤1% | 0.5 |
| Real estate and rental and leasing | ≤1% | 3.2 | sup | sup | ≤1% | 4.9 | ≤1% | 2.7 | sup | sup |
| Public administration | ≤1% | 2.3 | ≤1% | 1.1 | ≤1% | 3.1 | ≤1% | 1.6 | ≤1% | 0.7 |
| Management of companies and enterprises | sup | sup | 0% | 0.0 | sup | sup | sup | sup | 0% | 0.0 |
| Professional, scientific, and technical services | ≤1% | 1.5 | sup | sup | ≤1% | 2.2 | ≤1% | 1.1 | sup | sup |
| Finance and insurance | ≤1% | 1.7 | sup | sup | ≤1% | 2.7 | ≤1% | 1.1 | sup | sup |
| Information and cultural industries | ≤1% | 1.4 | sup | sup | sup | sup | sup | sup | sup | sup |
| Educational services | ≤1% | 1.2 | ≤1% | 0.8 | ≤1% | 1.8 | ≤1% | 0.7 | sup | sup |
| Wholesale trade | sup | sup | sup | sup | sup | sup | sup | sup | sup | sup |
| Unknown | 79% | 19.9 | 85% | 13.4 | 76% | 25.8 | 78% | 16.6 | 80% | 2.9 |
| Note: Industry was unknown for 79% of people 15 years and older who died due to a substance-related acute toxicity. Categories are not mutually exclusive. Data from British Columbia were only available for people who experienced accidental or undetermined acute toxicity deaths involving "street drugs" or pharmaceutical substances not prescribed to them. As such, data for people who experienced acute toxicity deaths by suicide or due solely to prescribed substances or alcohol were not available. Accordingly, British Columbia was removed from the Canadian population when calculating mortality rates for people in Canada who died by suicide. Percentages and crude mortality rates are based on counts randomly rounded to base three and those based on numbers less than 10 have been suppressed (sup). As the majority of data was suppressed for those whose manner of death was undetermined, they were removed from this table. | ||||||||||
Substance use history
The majority of people who died of a substance-related acute toxicity had a history of drug or alcohol use (at least 81%) documented in their coroner or medical examiner file, and at least 14% had a history of a non-fatal acute toxicity event.
There was no known or documented history of substance use among at least 3% of people who died (Figure 13). A history of substance use was more common among males than females (78% versus 67%, p < 0.05) (Table 14). There were almost twice as many people with a history of substance use among people who died accidentally compared to people who died by suicide (80% versus 42%, p < 0.05). A history comprised only of alcohol use was more common among people who died by suicide than among people who died accidentally (13% versus 5%, p < 0.05).

Note: Documented history of substance use includes all previous substance use other than use related to the acute toxicity event leading to the death. Data from British Columbia were only available for people who experienced accidental or undetermined acute toxicity deaths involving "street drugs" or pharmaceutical substances not prescribed to them. As such, data for people who experienced acute toxicity deaths by suicide or due solely to prescribed substances or alcohol were not available. Percentages are based on counts randomly rounded to base 3.
Figure 13 - Text description
| History of substance use | All deaths |
|---|---|
| No | 3% |
| Yes | 75% |
| Yes, alcohol only | 6% |
| Unknown | 15% |
|
Note: History of substance use includes all previous substance use other than use related to the acute toxicity event leading to the death. Data from British Columbia were only available for people who experienced accidental or undetermined acute toxicity deaths involving "street drugs" or pharmaceutical substances not prescribed to them. As such, data for people who experienced acute toxicity deaths by suicide or due solely to prescribed substances or alcohol were not available. Percentages are based on counts randomly rounded to base 3. | |
| Documented history of substance use | All deaths | Sex | Manner of death | |||
|---|---|---|---|---|---|---|
| Female | Male | Accident | Suicide | Undetermined | ||
| Yes | 75% | 67% | 78% | 80% | 42% | 55% |
| Yes, alcohol only | 6% | 7% | 6% | 5% | 13% | 12% |
| No | 3% | 6% | 2% | 2% | 10% | 7% |
| Unknown | 15% | 20% | 13% | 12% | 35% | 25% |
Note: History of substance use includes any previous substance use other than use related to the acute toxicity event leading to the death. Data from British Columbia were only available for people who experienced accidental or undetermined acute toxicity deaths involving "street drugs" or pharmaceutical substances not prescribed to them. As such, data for people who experienced acute toxicity deaths by suicide or due solely to prescribed substances or alcohol were not available. Percentages are based on counts randomly rounded to base 3. |
||||||
Interaction with the health care system
At least 36% of all people who died from a substance-related acute toxicity had access to a family doctor from whom they could receive regular care and at least 73% had contact with health services in the year before their death. Almost half of all people who died had sought outpatient treatment (for any reason) in the year before their death.
Information on if the person who died had access to a family doctor from whom they could receive regular care was poorly available (58% unknown), but at least 36% of people who died did have evidence in their coroner or medical examiner file of having access (Figure 14).
More information was available on recent contact with health services (23% unknown), with at least 73% of people who died having contact with health services in the year before their death (Figure 15 and Table 15). Contact with health services in the year before death was more common among people who died by suicide than accidentally (87% versus 70%, p < 0.05) (Table 15). While contact with health services in the year before death was more common among females who died than males (82% versus 69%, p < 0.05). Among those who had contact with health services, a greater proportion of males with sought outpatient treatment than females (66% versus 59%, p < 0.05).

Note: As data on the availability of a family doctor were not available for British Columbia, they were excluded from this analysis. Percentages are based on counts randomly rounded to base 3.
Figure 14 - Text description
| Accessible family doctor | All deaths | Female | Male |
|---|---|---|---|
| Yes | 36% | 44% | 33% |
| No | 6% | 3% | 7% |
| Unknown | 58% | 53% | 61% |
| Note: As data on the availability of a family doctor were not available for British Columbia, they were excluded from this analysis. Percentages are based on counts randomly rounded to base 3. | |||
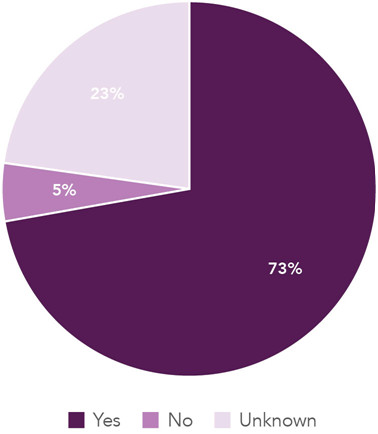
Note: Data from British Columbia were only available for people who experienced accidental or undetermined acute toxicity deaths involving "street drugs" or pharmaceutical substances not prescribed to them. As such, data for people who experienced acute toxicity deaths by suicide or due solely to prescribed substances or alcohol were not available. Percentages are based on counts randomly rounded to base 3.
Figure 15 - Text description
| Contact with health services | All deaths |
|---|---|
| Yes | 73% |
| No | 5% |
| Unknown | 23% |
| Note: Data from British Columbia were only available for people who experienced accidental or undetermined acute toxicity deaths involving "street drugs" or pharmaceutical substances not prescribed to them. As such, data for people who experienced acute toxicity deaths by suicide or due solely to prescribed substances or alcohol were not available. Percentages are based on counts randomly rounded to base 3. | |
| Contact with health services | All deaths | Sex | Manner of death | |||
|---|---|---|---|---|---|---|
| Female | Male | Accident | Suicide | Undetermined | ||
| Yes | 73% | 82% | 69% | 70% | 87% | 80% |
| Outpatient treatment | 64% | 59% | 66% | 67% | 49% | 48% |
| Inpatient treatment | 22% | 23% | 22% | 22% | 21% | 20% |
| Unknown treatment type | 28% | 32% | 26% | 25% | 41% | 41% |
| No | 5% | 2% | 6% | 6% | ≤1% | sup |
| Unknown | 23% | 16% | 25% | 24% | 12% | 18% |
| Note: As data on the type of health services contact were not available for 681 people from Ontario, they were excluded for this analysis. Types of health system contact are not mutually exclusive. Data from British Columbia were only available for people who experienced accidental or undetermined acute toxicity deaths involving "street drugs" or pharmaceutical substances not prescribed to them. As such, data for people who experienced acute toxicity deaths by suicide or due solely to prescribed substances or alcohol were not available. Percentages are based on counts randomly rounded to base 3 and those based on numbers less than 10 have been suppressed (sup). | ||||||
Acute toxicity event
Time and location
Acute toxicity events leading to death most often took place during the evening from 6:00 pm to 11:59 pm (at least 11%) and nighttime from 12:00 am to 5:59 am (at least 13%) and in a personal residence setting (at least 67%).
For some people who died, there was a clear distinction between when the acute toxicity occurred (the acute toxicity event) and when the person died as a result of it (the acute toxicity death). The time of the acute toxicity event was unknown or unobserved among at least 63% of people who died and was more likely to be unknown or unobserved among deaths by suicide (at least 76%) compared to accidental deaths (at least 61%, p <0.05). Though an increasing proportion of acute toxicity events took place from dawn onwards for people who died accidentally, acute toxicity events among people who died by suicide were more evenly distributed throughout the day (Figure 16).
While a personal residence setting was the most common place where the acute toxicity event took place for all sexes and manners of death, it was more common among females (at least 74%) compared to males (at least 64%, p < 0.05) (Table 16). A personal residence setting was also more common among people who died by suicide (at least 80%) compared to accidental deaths (at least 65%, p < 0.05). After a personal residence setting, the most common places for acute toxicity events included the home of another person (at least 9%), an outdoor public place (at least 5%), and a hotel or motel (at least 4%).
Overall, at least 6% of acute toxicity events took place outdoors and at least 3% in a vehicle (Table 17). At least 42% of people who died were found in or near a bed.
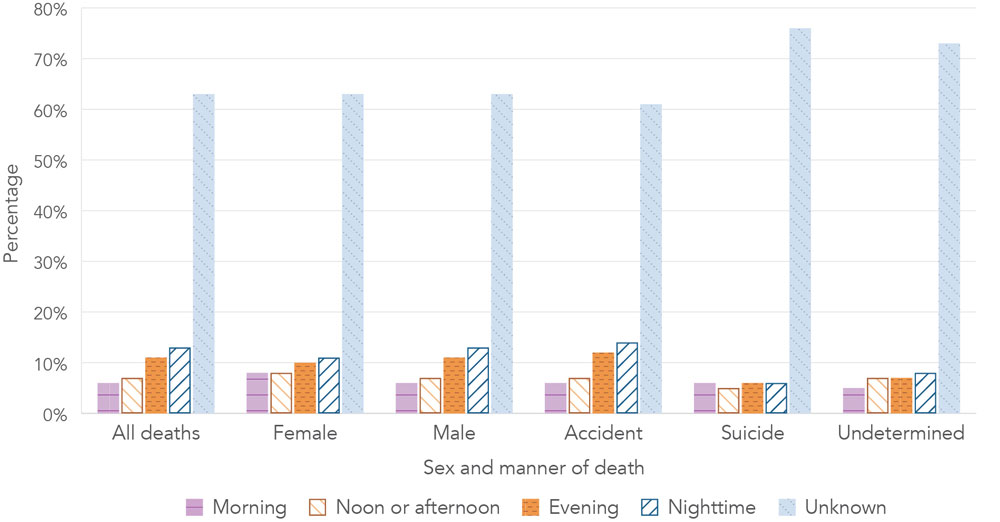
Note: As data on the time of the acute toxicity event were not available for 681 people from Ontario, they were excluded for this analysis. For this analysis, morning ranged from 6:00 am to 11:59 am, noon or afternoon ranged from 12:00 pm to 5:59 pm, evening ranged from 6:00 pm to 11:59 pm, and nighttime ranged from 12:00 am to 5:59 am. Data from British Columbia were only available for people who experienced accidental or undetermined acute toxicity deaths involving "street drugs" or pharmaceutical substances not prescribed to them. As such, data for people who experienced acute toxicity deaths by suicide or due solely to prescribed substances or alcohol were not available. Percentages are based on counts randomly rounded to base 3.
Figure 16 - Text description
| Time of the acute toxicity | All deaths | Sex | Manner of death | |||
|---|---|---|---|---|---|---|
| Female | Male | Accident | Suicide | Undetermined | ||
| Morning (6:00 to 11:59 am) | 6% | 8% | 6% | 6% | 6% | 5% |
| Noon or afternoon (12:00 to 5:59 pm) | 7% | 8% | 7% | 7% | 5% | 7% |
| Evening (6:00 to 11:59 pm) | 11% | 10% | 11% | 12% | 6% | 7% |
| Nighttime (12:00 to 5:59 am) | 13% | 11% | 13% | 14% | 6% | 8% |
| Unknown or unobserved | 63% | 63% | 63% | 61% | 76% | 73% |
| Note: As data on the time of the acute toxicity event were not available for 681 people from Ontario, they were excluded for this analysis. For this analysis, morning ranged from 6:00 am to 11:59 am, noon or afternoon ranged from 12:00 pm to 5:59 pm, evening ranged from 6:00 pm to 11:59 pm, and nighttime ranged from 12:00 am to 5:59 am. Data from British Columbia were only available for people who experienced accidental or undetermined acute toxicity deaths involving "street drugs" or pharmaceutical substances not prescribed to them. As such, data for people who experienced acute toxicity deaths by suicide or due solely to prescribed substances or alcohol were not available. Percentages are based on counts randomly rounded to base 3. | ||||||
| Place of the acute toxicity event | All deaths | Sex | Manner of death | |||||||||
|---|---|---|---|---|---|---|---|---|---|---|---|---|
| Female | Male | Accident | Suicide | Undetermined | ||||||||
| N | % | N | % | N | % | N | % | N | % | N | % | |
| Personal residence setting | 6,342 | 67% | 2,088 | 74% | 4,254 | 64% | 5,133 | 65% | 948 | 80% | 261 | 79% |
| Home of another person | 813 | 9% | 237 | 8% | 579 | 9% | 756 | 10% | 30 | 3% | 24 | 7% |
| Outdoor public place | 438 | 5% | 75 | 3% | 363 | 5% | 375 | 5% | 54 | 5% | sup | sup |
| Hotel or motel | 396 | 4% | 78 | 3% | 318 | 5% | 348 | 4% | 42 | 4% | sup | sup |
| Public building | 150 | 2% | 27 | ≤1% | 123 | 2% | 138 | 2% | sup | sup | sup | sup |
| Shelter | 75 | ≤1% | 18 | ≤1% | 57 | ≤1% | 72 | ≤1% | sup | sup | sup | sup |
| Supportive or transitional housing | 69 | ≤1% | 18 | ≤1% | 48 | ≤1% | 63 | ≤1% | sup | sup | sup | sup |
| Hospital | 57 | ≤1% | 12 | ≤1% | 45 | ≤1% | 45 | ≤1% | sup | sup | sup | sup |
| Substance use or addictions treatment facility | 48 | ≤1% | sup | sup | 39 | ≤1% | 48 | ≤1% | 0 | 0% | sup | sup |
| Correctional facility or police custody | 45 | ≤1% | sup | sup | 42 | ≤1% | 45 | ≤1% | sup | sup | sup | sup |
| Workplace of the person who died | 33 | ≤1% | sup | sup | 30 | ≤1% | 30 | <1% | sup | sup | sup | sup |
| Other health care facility | 27 | ≤1% | sup | sup | 24 | ≤1% | 21 | ≤1% | sup | sup | sup | sup |
| Public transportation | 12 | ≤1% | sup | sup | sup | sup | sup | sup | 0 | 0% | 0 | 0% |
| Other | 234 | 2% | 42 | ≤1% | 189 | 3% | 225 | 3% | sup | sup | 0 | 0% |
| Unknown | 678 | 7% | 189 | 7% | 486 | 8% | 597 | 8% | 66 | 6% | 15 | 5% |
Note: Data from British Columbia were only available for people who experienced accidental or undetermined acute toxicity deaths involving "street drugs" or pharmaceutical substances not prescribed to them. As such, data for people who experienced acute toxicity deaths by suicide or due solely to prescribed substances or alcohol were not available. Counts, which are used to calculate percentages, are randomly rounded to base 3. Numbers less than 10 and percentages based on these numbers have been suppressed (sup). |
||||||||||||
| Setting of the acute toxicity event | All deaths | Sex | Manner of death | |||
|---|---|---|---|---|---|---|
| Female | Male | Accident | Suicide | Undetermined | ||
| Took place outdoors | 6% | 4% | 7% | 6% | 6% | sup |
| Took place in a vehicle | 3% | ≤1% | 3% | 3% | 3% | sup |
| Found in or near bed | 42% | 47% | 39% | 40% | 49% | 43% |
Note: As data on if the person who died was found near the bed were not available for British Columbia, they were excluded for this analysis. Data from British Columbia were only available for people who experienced accidental or undetermined acute toxicity deaths involving "street drugs" or pharmaceutical substances not prescribed to them. As such, data for people who experienced acute toxicity deaths by suicide or due solely to prescribed substances or alcohol were not available. Percentages are based on counts randomly rounded to base 3, and those based on numbers less than 10 have been suppressed (sup). |
||||||
Apparent mode of consumption
The most commonly reported apparent mode of consumption was oral (at least 18%), followed by injection (at least 14%), smoking (at least 10%), and nasal insufflation or intranasal use (at least 8%).
Information on the apparent mode of consumption was missing for 54% of people who died. Differences were observed in the most common apparent mode of consumption across sexes and manners of death, with oral being much more common than other modes among females (at least 28%) and people who died by suicide (at least 47%) (Figure 17).
Prescription drugs were found at the scene at least 41% of the time; they were at the scene at least 34% of the time among people who died accidentally and at least 71% among people who died by suicide (Figure 18). Illegal (at least 24%) and alcohol (at least 20%) were also often present. For the purposes of this report, the scene refers to the place where the body was found or where the acute toxicity event took place and can include any area that contained evidence related to the acute toxicity event itself.
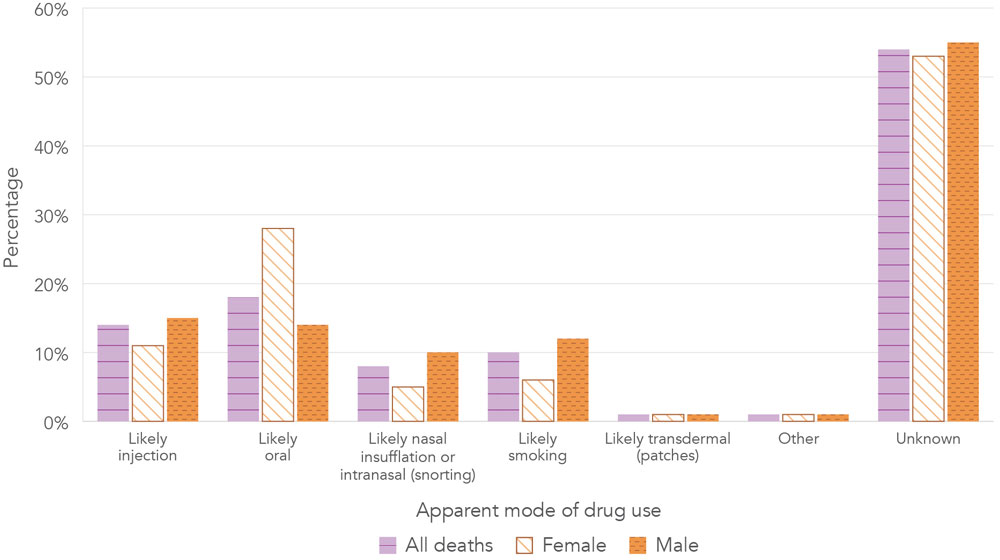
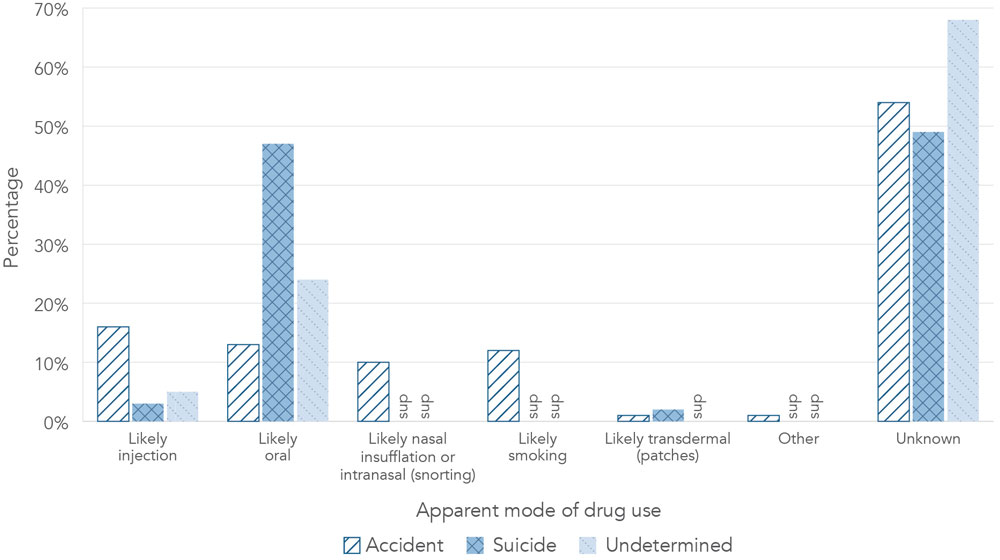
Note: Categories are not mutually exclusive. Data from British Columbia were only available for people who experienced accidental or undetermined acute toxicity deaths involving "street drugs" or pharmaceutical substances not prescribed to them. As such, data for people who experienced acute toxicity deaths by suicide or due solely to prescribed substances or alcohol were not available. Percentages are based on counts randomly rounded to base 3, and those based on numbers less than 10 have been suppressed (sup).
Figure 17 - Text description
| Apparent mode of drug use | All deaths | Sex | Manner of death | |||
|---|---|---|---|---|---|---|
| Female | Male | Accidental | Suicide | Undetermined | ||
| Likely injection | 14% | 11% | 15% | 16% | 3% | 5% |
| Likely oral | 18% | 28% | 14% | 13% | 47% | 24% |
| Likely nasal insufflation or intranasal (snorting) | 8% | 5% | 10% | 10% | sup | sup |
| Likely smoking | 10% | 6% | 12% | 12% | sup | sup |
| Likely transdermal (patches) | ≤1% | ≤1% | ≤1% | ≤1% | 2% | sup |
| Other | ≤1% | ≤1% | ≤1% | ≤1% | sup | sup |
| Unknown | 54% | 53% | 55% | 54% | 49% | 68% |
| Note: Categories are not mutually exclusive. Data from British Columbia were only available for people who experienced accidental or undetermined acute toxicity deaths involving "street drugs" or pharmaceutical substances not prescribed to them. As such, data for people who experienced acute toxicity deaths by suicide or due solely to prescribed substances or alcohol were not available. Percentages are based on counts randomly rounded to base 3 and those based on numbers less than 10 have been suppressed (sup). | ||||||
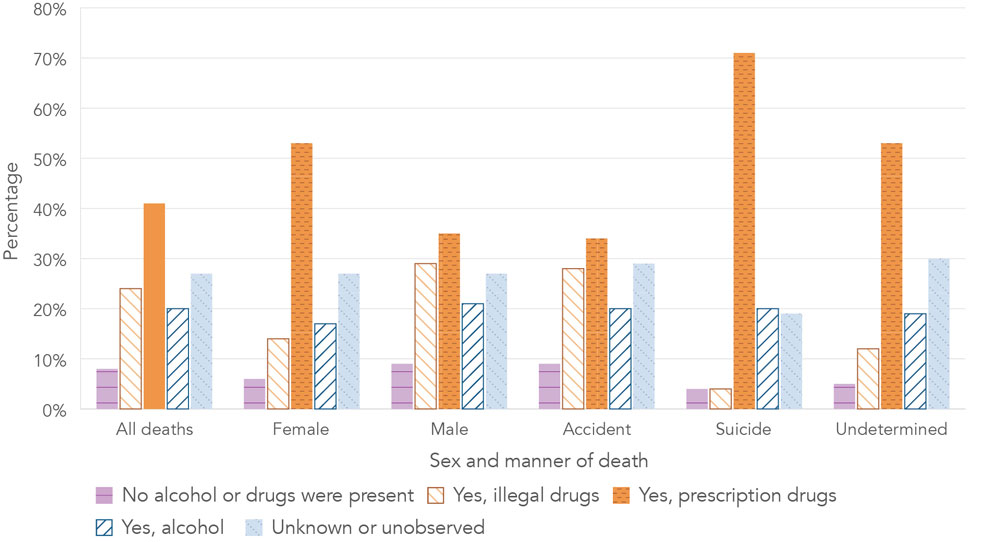
Note: Categories are not mutually exclusive. As data on the presence of drugs or alcohol at the scene of the acute toxicity event were not available British Columbia, they were excluded for this analysis. Percentages are based on counts randomly rounded to base three, and those based on numbers less than 10 have been suppressed (sup).
Figure 18 - Text description
| Presence of drugs or alcohol at the scene | All deaths | Sex | Manner of death | |||
|---|---|---|---|---|---|---|
| Female | Male | Accident | Suicide | Undetermined | ||
| No alcohol or drugs were present | 8% | 6% | 9% | 9% | 4% | 5% |
| Yes, illegal drugs | 24% | 14% | 29% | 28% | 4% | 12% |
| Yes, prescription drugs | 41% | 53% | 35% | 34% | 71% | 53% |
| Yes, alcohol | 20% | 17% | 21% | 20% | 20% | 19% |
| Unknown or unobserved | 27% | 27% | 27% | 29% | 19% | 30% |
| Note: Categories are not mutually exclusive. As data on the presence of drugs or alcohol at the scene of the acute toxicity event were not available for British Columbia, they were excluded for this analysis. Percentages are based on counts randomly rounded to base 3, and those based on numbers less than 10 have been suppressed (sup). | ||||||
Presence of other people
People who died due to a substance-related acute toxicity were most commonly found deceased with no evidence that the acute toxicity event was witnessed (at least 46%). This was especially common among people who died by suicide (at least 63%).
At least 17% of people who died were alive when found and showing symptoms of acute drug toxicity (Figure 19). For 29% of people who died it was unclear if the person was already dead when found as they were unconscious or unresponsive when found (23% of the time) or thought to be asleep (6% of the time).
Prior to the acute toxicity event, there was no evidence to suggest that drugs were taken in the presence of others at least 38% of the time (Table 18). This was especially common among people who died by suicide (at least 50%). Drugs were taken in the presence of others at least 15% of the time, while only alcohol was taken in the presence of others at least 4% of the time.
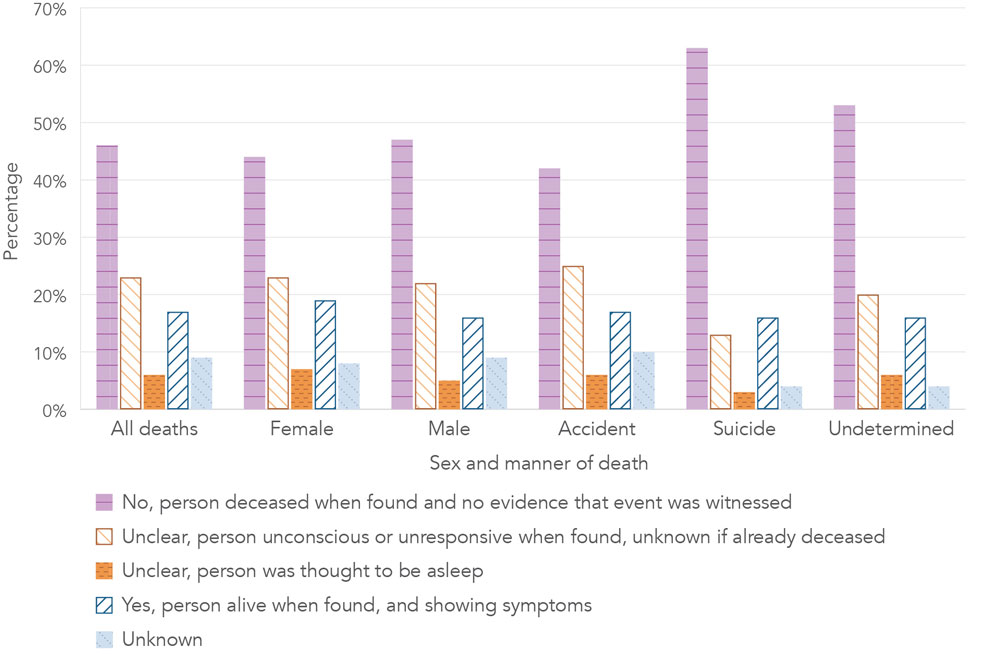
Note: As data on if the acute toxicity event was witnessed by others were not available for British Columbia deaths, they were excluded for this analysis. Percentages are based on counts randomly rounded to base 3, and those based on numbers less than 10 have been suppressed (sup).
Figure 19 - Text description
| If the acute toxicity event was witnessed by others | All deaths | Sex | Manner of death | |||
|---|---|---|---|---|---|---|
| Female | Male | Accident | Suicide | Undetermined | ||
| No, person deceased when found and no evidence that event was witnessed | 46% | 44% | 47% | 42% | 63% | 53% |
| Unclear, person unconscious or unresponsive when found, unknown if already deceased | 23% | 23% | 22% | 25% | 13% | 20% |
| Unclear, person was thought to be asleep | 6% | 7% | 5% | 6% | 3% | 6% |
| Yes, person alive when found, and showing symptoms | 17% | 19% | 16% | 17% | 16% | 16% |
| Unknown | 9% | 8% | 9% | 10% | 4% | 4% |
| Note: As data on if the acute toxicity event was witnessed by others were not available for British Columbia deaths, they were excluded for this analysis. Percentages are based on counts randomly rounded to base 3, and those based on numbers less than 10 have been suppressed (sup). | ||||||
| If drugs were taken in the presence of others prior to the acute toxicity event | All deaths | Sex | Manner of death | |||
|---|---|---|---|---|---|---|
| Female | Male | Accident | Suicide | Undetermined | ||
| No | 38% | 35% | 40% | 37% | 50% | 38% |
| Yes | 15% | 16% | 15% | 17% | 5% | 7% |
| Yes, alcohol only | 4% | 4% | 4% | 4% | 3% | sup |
| Unknown | 43% | 45% | 42% | 42% | 42% | 51% |
| Note: Data from British Columbia were only available for people who experienced accidental or undetermined acute toxicity deaths involving "street drugs" or pharmaceutical substances not prescribed to them. As such, data for people who experienced acute toxicity deaths by suicide or due solely to prescribed substances or alcohol were not available. Percentages are based on counts randomly rounded to base 3, and those based on numbers less than 10 have been suppressed (sup). | ||||||
Substances involved
Toxicology reports were available in the majority of coroner and medical examiner files (91%). While collecting toxicology data, abstractors indicated if substances and substance metabolites were detected in toxicology reports and/or listed as a cause of death. Substances that are metabolites were used as evidence of the parent substance when the metabolite was not known to originate from other substances (for example, the presence of norbuprenorphine was used as evidence for the presence of buprenorphine). Multiple substances and substance types could be both detected and identified as a cause of death for one person.
Substances can be present in toxicology reports as a result of a person's intentional use, unintentional use (due to, for example, contaminated drugs, medication errors, or the substance being mistaken for food), therapeutic use of a prescribed medication, or therapeutic use while receiving care from emergency medical services, in an emergency department, or at a hospital. The risk of acute toxicity depends not only on the substances involved, but also individual factors, circumstances, and surroundings.
Substances and metabolites were grouped into the 17 substance types described in Table 19.
| Substance type | Substances |
|---|---|
| Alcohol | Ethanol, isopropanol, methanol |
| Acetaminophen | Acetaminophen |
| Antipsychotics | Aripiprazole, asenapine, chlorpromazine, clozapine, flupenthixol, fluphenazine, haloperidol, levomepromazine, loxapine, lurasidone, olanzapine, paliperidone, pimozide, prochlorperazine, quetiapine, risperidone, ziprasidone, zuclopenthixol |
| Benzodiazepines | Alprazolam, bromazepam, chlordiazepoxide, clobazam, clonazepam, diazepam, etizolam, flubromazolam, flurazepam, lorazepam, midazolam, nitrazepam, oxazepam, temazepam, triazolam, unspecified benzodiazepines |
| Cannabinoids | Nabilone, tetrahydrocannabinol (THC) |
| Ethanolamine antihistamines | Diphenhydramine, doxylamine, orphenadrine |
| Fentanyl opioids | 3-methylfentanyl, 4-fluorobutyrfentanyl, 4-fluoroisobutyryl fentanyl, acetylfentanyl, acrylfentanyl, butyrylfentanyl, carfentanil, cyclopropyl/crotonyl fentanyl, despropionyl-fentanyl, fentanyl, furanylfentanyl, methoxyacetylfentanyl, remifentanil, sufentanil |
| Non-fentanyl opioids | Buprenorphine, codeine, dextrorphan, diacetylmorphine (heroin), dihydrocodeine, embutramide, hydrocodone, hydromorphone, meperidine, methadone, mitragynine, morphine, oxycodone, oxymorphone, pentazocine, propoxyphene, tapentadol, thebaine, tramadol, U-47700, U-49900, U-51754 |
| Unspecified opioids | People who died with opioids described as detected or a cause of death in the coroner or medical examiner file but no specific substances were listed. |
| Gabapentinoids | Gabapentin, pregabalin |
| Hallucinogens | 25I-NBOMe, 3-methoxyphencyclidine (3-Meo-PCP), ibogaine, lysergic acid diethylamide (LSD), mescaline, phencyclidine, psilocybin, unspecified hallucinogens |
| Stimulants | 1,3-trifluoromethylphenylpiperazine (TFMPP), 2,5-dimethoxy-4-bromo-amphetamine, 3-fluorophenmetrazine, 4-fluoroamphetamine, alpha-pyrrolidinovalerophenone, aminorex, amphetamine, beta-phenethylamine, butylone, caffeine, cocaine, dextroamphetamine, ethylone, ethylphenidate, lisdexamfetamine, methamphetamine, methylenedioxyamphetamine (MDA), methylenedioxymethamphetamine (MDMA), methylphenidate, N-benzylpiperazine (BZP), nicotine, paramethoxyamphetamine (PMA), paramethoxymethamphetamine (PMMA), phentermine, theobromine, unspecified stimulants |
| Insulin | Insulin |
| Tri-cyclic antidepressants | Amitriptyline, amoxapine, clomipramine, desipramine, doxepin, imipramine, nortriptyline, trimipramine, unspecified tricyclic antidepressants |
| Other antidepressants | Bupropion, citalopram, desvenlafaxine, duloxetine, fluoxetine, fluvoxamine, mirtazapine, moclobemide, paroxetine, sertraline, trazodone, venlafaxine, vortioxetine |
| Z-drugs | Zolpidem, zopiclone |
| Other substance types | 1,1-difluoroethane, 2,4-dinitrophenol, abacavir, acebutolol, acetone, acetylsalicylic acid, aconite, acyclovir, amantadine, amiodarone, amlodipine, amobarbital, anastrozole, apixaban, atenolol, atomoxetine, atorvastatin, atropine, baclofen, barbiturates, benzene, benzocaine, benztropine, benzydamine, bisoprolol, brompheniramine, bupivacaine, buspirone, butalbital, butane, capsaicin, carbamazepine, carbon monoxide, carvedilol, celecoxib, cetirizine, chloral hydrate, chloropheniramine, chloroquine, clonidine (p-hydroxyclonidine), colchicine, compressed air, creatinine, cyanide, cyclobenzaprine (N-desmethylcyclobenzaprine), cyproheptadine, dextromethorphan, diclofenac, dicyclomine, diethylene glycol, digoxin, diltiazem, dobutamine, domperidone, donepezil, efavirenz, enalapril, ether, ethylbenzene, ethylene glycol, etomidate, fenofibrate, flecainide, fluconazole, formic acid, furosemide, gammahydroxybutyrate (GHB), gliclazide, glyburide, dimenhydrinate, guaifenesin, heparin, hydrochlorothiazide, hydroxychloroquine, hydroxyzine, ibuprofen, indomethacin, irbesartan, iron, isobutane, ketamine, ketorolac, labetalol, lacosamide, lamotrigine, lansoprazole, laudanosine, levamisole, levetiracetam, levothyroxine, lidocaine, lisinopril, lithium, loperamide, losartan, meloxicam, memantine, mepivicaine, metformin, methocarbamol, methotrexate, metoclopramide, metoprolol, metronidazole, nadolol, naloxone, naltrexone, naproxen, nifedipine, nonsteroidal anti-inflammatory drugs (NSAIDs), noscapine, omeprazole, ondansetron, oxomemazine, oxybutynin, pantoprazole, pentobarbital, perindopril, phenacetin, pheniramine, phenobarbital, phenylephrine, phenytoin, piperazine, primidone, procyclidine, promethazine, propafenone, propofol, propranolol, propylene glycol, pseudoephedrine/ephedrine, quinapril, quinidine, quinine, rabeprazole, ramipril, ranitidine, rivaroxaban, rocuronium, ropinirole, rosuvastatin, salbutamol, scopolamine, secobarbital, selegiline (desmethylselegiline), sildenafil, sitagliptin, solifenacin, sulfonamides, sumatriptan, tadalafil, tamoxifen, telmisartan, terazosin, terbinafine, testosterone, theophylline, timolol, toluene, topiramate, trihexyphenidyl, trimethoprim, triprolidine, valproic acid, valsartan, varenicline, verapamil, W-18, warfarin, xylazine, xylene |
| Unknown substance type | People who died with no substances listed as either causing death or detected in their coroner or medical examiner files. |
Note: As alcohol may be detected due to either consumption or post-mortem endogenous ethanol production, findings should be interpreted with caution. |
|
Substance types
Stimulants (44%), fentanyl opioids (44%), and non-fentanyl opioids (37%) were the most common substance types identified as causing death. Alcohol was detected in 34% of people who died and benzodiazepines in 28%.
Among males, the substance types most often identified as causing death were fentanyl opioids (51%) and stimulants (49%) (Table 20). By contrast, non-fentanyl opioids (39%) and stimulants (32%) were the substance types identified most often as causing death among females. Similar patterns were observed among the substance types most commonly detected among males and females (Table 21).
Among people who died accidentally, the substance types most often identified as causing death were fentanyl opioids (51%) and stimulants (51%), followed by non-fentanyl opioids (38%) (Table 22). By contrast, non-fentanyl opioids (31%) and other antidepressants (17%) were the substance types identified most often as causing death among people who died by suicide. Similar patterns were observed among the substance types most commonly detected in people who died accidentally (Table 23). The most common substance types detected among people who died by suicide were non-fentanyl opioids (46%) and benzodiazepines (44%).
Of note, alcohol was detected in 34% of people who died and identified as causing death in 21% (Table 20 to 23). Similarly, benzodiazepines were detected in 28% of people who died and identified as causing death in 9%.
| Substance types | All deaths | Female | Male | |||
|---|---|---|---|---|---|---|
| N | % | N | % | N | % | |
| Alcohol | 1,950 | 21% | 492 | 18% | 1,458 | 22% |
| Acetaminophen | 156 | 2% | 93 | 3% | 63 | ≤1% |
| Antipsychotics | 315 | 3% | 132 | 5% | 180 | 3% |
| Benzodiazepines | 840 | 9% | 327 | 12% | 513 | 8% |
| Cannabinoids | 42 | ≤1% | 12 | ≤1% | 30 | ≤1% |
| Ethanolamine antihistamines | 288 | 3% | 165 | 6% | 123 | 2% |
| Fentanyl opioids | 4,164 | 44% | 810 | 29% | 3,354 | 51% |
| Non-fentanyl opioids | 3,480 | 37% | 1,098 | 39% | 2,382 | 36% |
| Opioids, unspecified | 75 | ≤1% | 27 | ≤1% | 48 | ≤1% |
| Gabapentinoids | 156 | 2% | 69 | 2% | 84 | ≤1% |
| Hallucinogens | 57 | ≤1% | 21 | ≤1% | 36 | ≤1% |
| Stimulants | 4,125 | 44% | 903 | 32% | 3,225 | 49% |
| Insulin | 15 | ≤1% | sup | sup | 12 | ≤1% |
| Tri-cyclic antidepressants | 231 | 2% | 123 | 4% | 108 | 2% |
| Other antidepressants | 573 | 6% | 321 | 11% | 252 | 4% |
| Z-drugs | 279 | 3% | 135 | 5% | 144 | 2% |
| Other substance types | 447 | 5% | 189 | 7% | 261 | 4% |
| Unknown substance type | 822 | 9% | 375 | 13% | 447 | 7% |
| Note: As only cause of death information was available from British Columbia, substances identified as causing death were also counted as detected. Data from British Columbia were only available for people who experienced accidental or undetermined acute toxicity deaths involving "street drugs" or pharmaceutical substances not prescribed to them. As such, data for people who experienced acute toxicity deaths by suicide or due solely to prescribed substances or alcohol were not available. Counts, which are used to calculate percentages, are randomly rounded to base 3. Numbers less than 10 and percentages based on these numbers have been suppressed (sup). | ||||||
| Substance types | All deaths | Female | Male | |||
|---|---|---|---|---|---|---|
| N | % | N | % | N | % | |
| Alcohol | 3,210 | 34% | 873 | 31% | 2,337 | 35% |
| Acetaminophen | 960 | 10% | 462 | 16% | 501 | 8% |
| Antipsychotics | 1,140 | 12% | 531 | 19% | 609 | 9% |
| Benzodiazepines | 2,655 | 28% | 1,119 | 40% | 1,539 | 23% |
| Cannabinoids | 543 | 6% | 141 | 5% | 402 | 6% |
| Ethanolamine antihistamines | 867 | 9% | 483 | 17% | 384 | 6% |
| Fentanyl opioids | 4,281 | 45% | 858 | 31% | 3,426 | 52% |
| Non-fentanyl opioids | 4,491 | 48% | 1,503 | 54% | 2,988 | 45% |
| Opioids, unspecified | sup | sup | sup | sup | sup | sup |
| Gabapentinoids | 675 | 7% | 324 | 12% | 351 | 5% |
| Hallucinogens | 15 | ≤1% | sup | sup | 12 | ≤1% |
| Stimulants | 5,103 | 54% | 1,182 | 42% | 3,915 | 59% |
| Insulin | sup | sup | sup | sup | sup | sup |
| Tri-cyclic antidepressants | 576 | 6% | 309 | 11% | 270 | 4% |
| Other antidepressants | 2,238 | 24% | 1,074 | 38% | 1,161 | 18% |
| Z-drugs | 609 | 6% | 294 | 10% | 315 | 5% |
| Other substance types | 2,496 | 27% | 921 | 33% | 1578 | 24% |
| Unknown substance type | 282 | 3% | 96 | 3% | 189 | 3% |
| Note: As only cause of death information was available from British Columbia, substances identified as causing death were also counted as detected. Data from British Columbia were only available for people who experienced accidental or undetermined acute toxicity deaths involving "street drugs" or pharmaceutical substances not prescribed to them. As such, data for people who experienced acute toxicity deaths by suicide or due solely to prescribed substances or alcohol were not available. Counts, which are used to calculate percentages, are randomly rounded to base 3. Numbers less than 10 and percentages based on these numbers have been suppressed (sup). As alcohol may be detected due to either consumption or post-mortem endogenous ethanol production, findings should be interpreted with caution. | ||||||
| Substance types | All deaths | Accident | Suicide | Undetermined | ||||
|---|---|---|---|---|---|---|---|---|
| N | % | N | % | N | % | N | % | |
| Alcohol | 1,950 | 21% | 1,728 | 22% | 168 | 14% | 54 | 16% |
| Acetaminophen | 156 | 2% | 84 | ≤1% | 60 | 5% | sup | sup |
| Antipsychotics | 315 | 3% | 171 | 2% | 123 | 10% | 18 | 5% |
| Benzodiazepines | 840 | 9% | 666 | 8% | 144 | 12% | 30 | 9% |
| Cannabinoids | 42 | ≤1% | 39 | ≤1% | 0 | 0% | 0 | 0% |
| Ethanolamine antihistamines | 288 | 3% | 195 | 2% | 75 | 6% | 15 | 5% |
| Fentanyl opioids | 4,164 | 44% | 4,065 | 51% | 45 | 4% | 54 | 16% |
| Non-fentanyl opioids | 3,480 | 37% | 2,982 | 38% | 363 | 31% | 135 | 41% |
| Opioids, unspecified | 75 | ≤1% | 54 | ≤1% | 15 | ≤1% | sup | sup |
| Gabapentinoids | 156 | 2% | 132 | 2% | 15 | ≤1% | sup | sup |
| Hallucinogens | 57 | ≤1% | 39 | ≤1% | 15 | ≤1% | sup | sup |
| Insulin | 15 | ≤1% | sup | sup | 12 | ≤1% | sup | sup |
| Stimulants | 4,125 | 44% | 4,008 | 51% | 57 | 5% | 60 | 18% |
| Tri-cyclic antidepressants | 231 | 2% | 120 | 2% | 87 | 7% | 24 | 7% |
| Other antidepressants | 573 | 6% | 327 | 4% | 201 | 17% | 45 | 14% |
| Z-drugs | 279 | 3% | 138 | 2% | 132 | 11% | sup | sup |
| Other substance types | 447 | 5% | 279 | 4% | 144 | 12% | 24 | 7% |
| Unknown substance type | 822 | 9% | 504 | 6% | 267 | 23% | 51 | 15% |
| Note: Data from British Columbia were only available for people who experienced accidental or undetermined acute toxicity deaths involving "street drugs" or pharmaceutical substances not prescribed to them. As such, data for people who experienced acute toxicity deaths by suicide or due solely to prescribed substances or alcohol were not available. As only cause of death information was available for cases from British Columbia, substances identified as causing death were also counted as detected. Counts, which are used to calculate percentages, are randomly rounded to base 3. Numbers less than 10 and percentages based on these numbers have been suppressed (sup). | ||||||||
| Substance types | All deaths | Accident | Suicide | Undetermined | ||||
|---|---|---|---|---|---|---|---|---|
| N | % | N | % | N | % | N | % | |
| Alcohol | 3,210 | 34% | 2,670 | 34% | 420 | 36% | 117 | 35% |
| Acetaminophen | 960 | 10% | 678 | 9% | 225 | 19% | 57 | 17% |
| Antipsychotics | 1,140 | 12% | 759 | 10% | 297 | 25% | 81 | 25% |
| Benzodiazepines | 2,658 | 28% | 1,992 | 25% | 522 | 44% | 144 | 44% |
| Cannabinoids | 543 | 6% | 465 | 6% | 54 | 5% | 21 | 6% |
| Ethanolamine antihistamines | 867 | 9% | 609 | 8% | 204 | 17% | 57 | 17% |
| Fentanyl opioids | 4,281 | 45% | 4,155 | 53% | 69 | 6% | 60 | 18% |
| Non-fentanyl opioids | 4,491 | 48% | 3,765 | 48% | 549 | 46% | 177 | 54% |
| Opioids, unspecified | sup | sup | sup | sup | sup | sup | 0 | 0% |
| Gabapentinoids | 678 | 7% | 543 | 7% | 93 | 8% | 42 | 13% |
| Hallucinogens | 18 | ≤1% | 18 | ≤1% | 0 | 0% | 0 | 0% |
| Insulin | sup | sup | 0 | 0% | sup | sup | 0 | 0% |
| Stimulants | 5,100 | 54% | 4,794 | 61% | 198 | 17% | 114 | 35% |
| Tri-cyclic antidepressants | 576 | 6% | 375 | 5% | 159 | 13% | 42 | 13% |
| Other antidepressants | 2,496 | 27% | 1,923 | 24% | 447 | 38% | 126 | 38% |
| Z-drugs | 609 | 6% | 348 | 4% | 231 | 20% | 33 | 10% |
| Other substance types | 2,529 | 27% | 1,944 | 25% | 459 | 39% | 129 | 39% |
| Unknown substance type | 282 | 3% | 189 | 2% | 81 | 7% | 12 | 4% |
| Note: Data from British Columbia were only available for people who experienced accidental or undetermined acute toxicity deaths involving "street drugs" or pharmaceutical substances not prescribed to them. As such, data for people who experienced acute toxicity deaths by suicide or due solely to prescribed substances or alcohol were not available. As only cause of death information was available for cases from British Columbia, substances identified as causing death were also counted as detected. Counts, which are used to calculate percentages, are randomly rounded to base three. Numbers less than 10 and percentages based on these numbers have been suppressed (sup). As alcohol may be detected due to either consumption or post-mortem endogenous ethanol production, findings should be interpreted with caution. | ||||||||
Number of substances
While the majority of coroner and medical examiner files identified 1 (30%) or 2 (24%) substances as causing death, 3 (18%) and 4 (17%) substances were most often detected. Only 8% of people who died had only 1 substance detected.
Deaths where 2 to 3 substances caused death or were detected were more common among males (causing death = 45%, detected = 37%) than females (causing death = 37%, detected = 25%) (Figure 20 and Figure 21). However, deaths involving 4 or more substances were more common among females (causing death = 19%, detected = 64%) than males (causing death = 18%, detected = 51%).
Up to 11 substances caused death among people who died accidentally, compared to up to 7 substances among people who died by suicide (Figure 22 and Figure 23).
A single substance was most commonly noted as the cause of death across all manners of death, including 29% of people who died accidentally, 34% of people who died by suicide, and 38% of people with an undetermined manner of death (Figure 22). Conversely, 2 to 4 substances were most often detected among people who died accidentally (52%), and 3 to 5 substances were most often detected among people who died by suicide (44%), and people with an undetermined manner of death (46%) (Figure 23).
A note about the unknown category: The unknown category indicates that information on detected substances or those causing death was missing. This could be because toxicology information was not available or no specific substances were listed as a cause of death (for example, the cause of death was described as an acute toxicity due to multiple substances). Information on toxicology could also be unavailable due to other circumstances such as a prolonged hospital stay where the substances involved in the acute toxicity could not be conclusively determined.
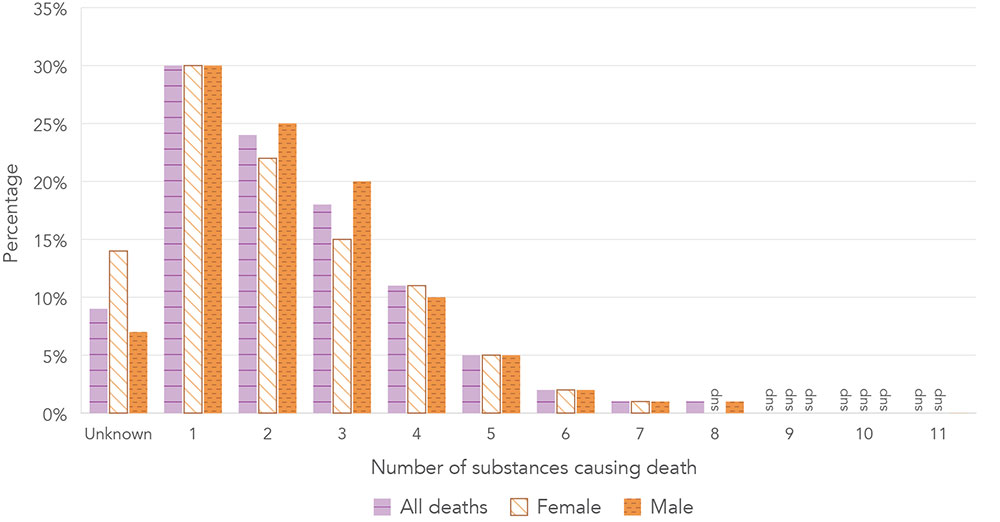
Note: Cases with an unknown number of substances had no substances identified as causing death in their coroner or medical examiner files. Data from British Columbia were only available for people who experienced accidental or undetermined acute toxicity deaths involving "street drugs" or pharmaceutical substances not prescribed to them. As such, data for people who experienced acute toxicity deaths by suicide or due solely to prescribed substances or alcohol were not available. Percentages are based on counts randomly rounded to base three. Numbers less than 10 have been suppressed (sup), including data on all people who died with 9 or more substances causing death, data on males with 9 or more substances causing death, and data on females with 8 or more substances causing death.
Figure 20 - Text description
| Number of substances causing death | Female | Male | All deaths |
|---|---|---|---|
| Unknown | 14% | 7% | 9% |
| 1 | 30% | 30% | 30% |
| 2 | 22% | 25% | 24% |
| 3 | 15% | 20% | 18% |
| 4 | 11% | 10% | 11% |
| 5 | 5% | 5% | 5% |
| 6 | 2% | 2% | 2% |
| 7 | ≤1% | ≤1% | ≤1% |
| 8 | sup | ≤1% | ≤1% |
| 9 | sup | sup | sup |
| 10 | sup | sup | sup |
| 11 | sup | 0% | sup |
| Note: Cases with an unknown number of substances had no substances identified as causing death in their coroner or medical examiner files. Data from British Columbia were only available for people who experienced accidental or undetermined acute toxicity deaths involving "street drugs" or pharmaceutical substances not prescribed to them. As such, data for people who experienced acute toxicity deaths by suicide or due solely to prescribed substances or alcohol were not available. Percentages are based on counts randomly rounded to base 3. Numbers less than 10 have been suppressed (sup), including data on all people who died with 9 or more substances causing death, data on males with 9 or more substances causing death, and data on females with 8 or more substances causing death. | |||
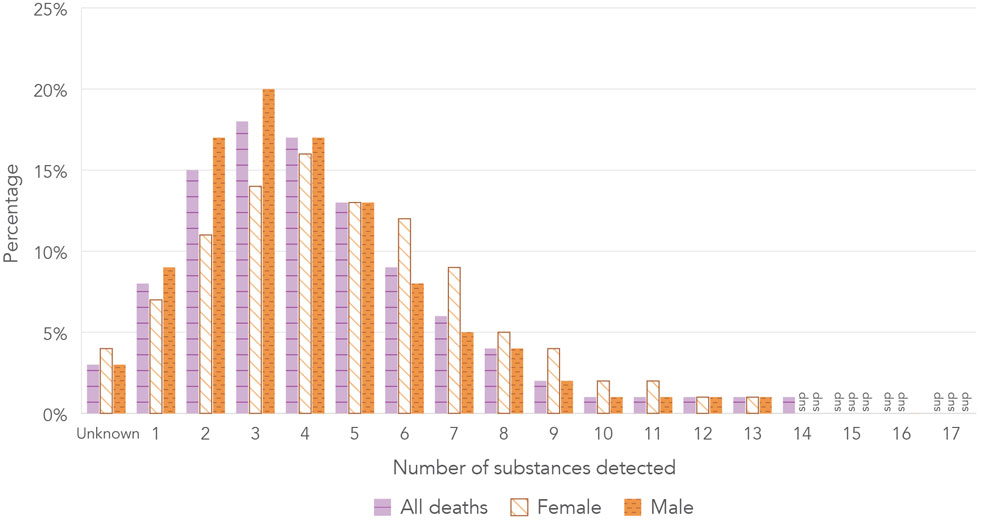
Note: Cases with an unknown number of substances had no substances listed as detected in their coroner or medical examiner files. As only cause of death information was available from British Columbia, substances identified as causing death were also counted as detected. Data from British Columbia were only available for people who experienced accidental or undetermined acute toxicity deaths involving "street drugs" or pharmaceutical substances not prescribed to them. As such, data for people who experienced acute toxicity deaths by suicide or due solely to prescribed substances or alcohol were not available. Percentages are based on counts randomly rounded to base 3. Numbers less than 10 have been suppressed (sup), including data on all people who died with 15 or more substances detected, data on males with 13, 14, 15, and 17 substances detected, and data on females with 14 or more substances detected.
Figure 21 - Text description
| Number of substances detected | Female | Male | All deaths |
|---|---|---|---|
| Unknown | 4% | 3% | 3% |
| 1 | 7% | 9% | 8% |
| 2 | 11% | 17% | 15% |
| 3 | 14% | 20% | 18% |
| 4 | 16% | 17% | 17% |
| 5 | 13% | 13% | 13% |
| 6 | 12% | 8% | 9% |
| 7 | 9% | 5% | 6% |
| 8 | 5% | 4% | 4% |
| 9 | 4% | 2% | 2% |
| 10 | 2% | ≤1% | ≤1% |
| 11 | 2% | ≤1% | ≤1% |
| 12 | ≤1% | ≤1% | ≤1% |
| 13 | ≤1% | ≤1% | ≤1% |
| 14 | sup | sup | ≤1% |
| 15 | sup | sup | sup |
| 16 | sup | 0% | sup |
| 17 | sup | sup | sup |
| Note: Cases with an unknown number of substances had no substances listed as detected in their coroner or medical examiner files. As only cause of death information was available from British Columbia, substances identified as causing death were also counted as detected. Data from British Columbia were only available for people who experienced accidental or undetermined acute toxicity deaths involving "street drugs" or pharmaceutical substances not prescribed to them. As such, data for people who experienced acute toxicity deaths by suicide or due solely to prescribed substances or alcohol were not available. Percentages are based on counts randomly rounded to base 3. Numbers less than 10 have been suppressed (sup), including data on all people who died with 15 or more substances detected, data on males with 13, 14, 15, and 17 substances detected, and data on females with 14 or more substances detected. | |||
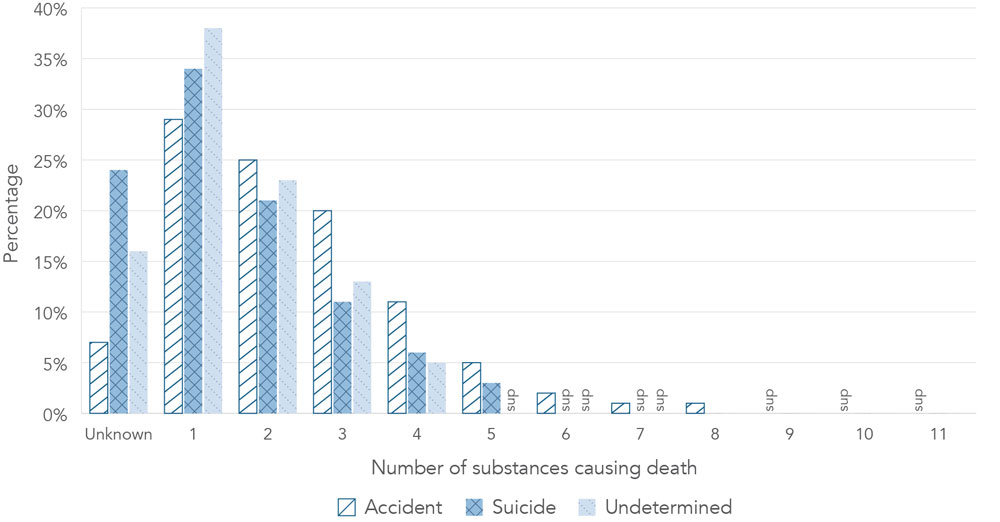
Note: Cases with an unknown number of substances had no substances identified as causing death in their coroner or medical examiner files. Data from British Columbia were only available for people who experienced accidental or undetermined acute toxicity deaths involving "street drugs" or pharmaceutical substances not prescribed to them. As such, data for people who experienced acute toxicity deaths by suicide or due solely to prescribed substances or alcohol were not available. Percentages are based on counts randomly rounded to base 3. Numbers less than 10 have been suppressed (sup), including data on people who experienced an accidental death with 9 or more substances causing death, data on people who experienced death by suicide with 6 or 7 substances causing death, and data on people whose manner of death was undetermined with 5 to 7 substances causing death.
Figure 22 - Text description
| Number of substance types causing death | Accident | Suicide | Undetermined |
|---|---|---|---|
| Unknown | 7% | 24% | 16% |
| 1 | 29% | 34% | 38% |
| 2 | 25% | 21% | 23% |
| 3 | 20% | 11% | 13% |
| 4 | 11% | 6% | 5% |
| 5 | 5% | 3% | sup |
| 6 | 2% | sup | sup |
| 7 | ≤1% | sup | sup |
| 8 | ≤1% | 0% | 0% |
| 9 | sup | 0% | 0% |
| 10 | sup | 0% | 0% |
| 11 | sup | 0% | 0% |
| Note: Cases with an unknown number of substances had no substances identified as causing death in their coroner or medical examiner files. Data from British Columbia were only available for people who experienced accidental or undetermined acute toxicity deaths involving "street drugs" or pharmaceutical substances not prescribed to them. As such, data for people who experienced acute toxicity deaths by suicide or due solely to prescribed substances or alcohol were not available. Percentages are based on counts randomly rounded to base 3. Numbers less than 10 have been suppressed (sup), including data on people who experienced an accidental death with 9 or more substances causing death, data on people who experienced death by suicide with 6 or 7 substances causing death, and data on people whose manner of death was undetermined with 5 to 7 substances causing death. | |||
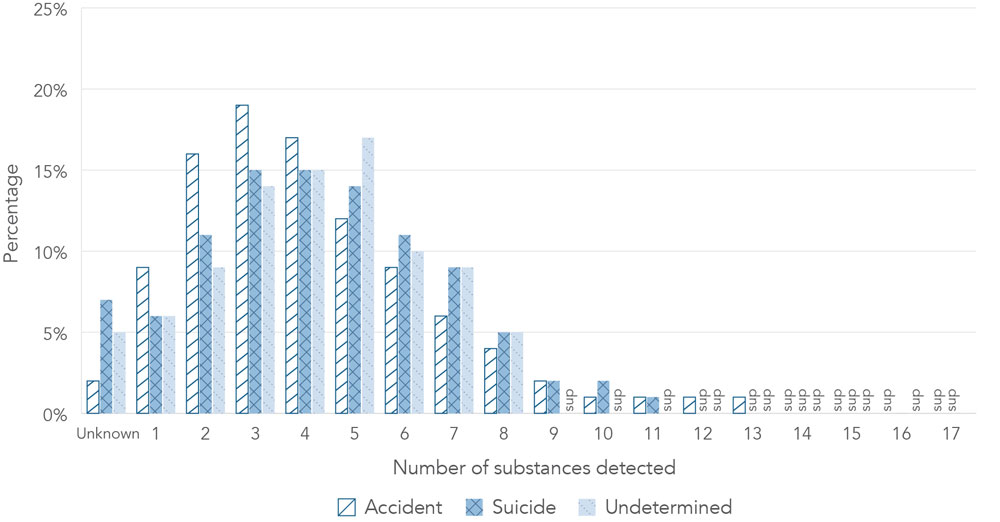
Note: Cases with an unknown number of substances had no substances listed as detected in their coroner or medical examiner files. As only cause of death information was available for cases from British Columbia, substances identified as causing death were also counted as detected. Data from British Columbia were only available for people who experienced accidental or undetermined acute toxicity deaths involving "street drugs" or pharmaceutical substances not prescribed to them. As such, data for people who experienced acute toxicity deaths by suicide or due solely to prescribed substances or alcohol were not available. Percentages are based on counts randomly rounded to base 3. Numbers less than 10 have been suppressed (sup), including data on people who experienced an accidental death with 14 or more substances detected, data on people who died by suicide with 12 to 15 and 17 substances detected, and data on people whose manner of death was undetermined with 10 to 16 substances detected were suppressed.
Figure 23 - Text description
| Number of substance types detected | Accident | Suicide | Undetermined |
|---|---|---|---|
| Unknown | 2% | 7% | 5% |
| 1 | 9% | 6% | 6% |
| 2 | 16% | 11% | 9% |
| 3 | 19% | 15% | 14% |
| 4 | 17% | 15% | 15% |
| 5 | 12% | 14% | 17% |
| 6 | 9% | 11% | 10% |
| 7 | 6% | 9% | 9% |
| 8 | 4% | 5% | 5% |
| 9 | 2% | 2% | sup |
| 10 | ≤1% | 2% | sup |
| 11 | ≤1% | ≤1% | sup |
| 12 | ≤1% | sup | sup |
| 13 | ≤1% | sup | sup |
| 14 | sup | sup | sup |
| 15 | sup | sup | sup |
| 16 | sup | 0% | sup |
| 17 | sup | sup | 0% |
| Note: Cases with an unknown number of substances had no substances listed as detected in their coroner or medical examiner files. As only cause of death information was available for cases from British Columbia, substances identified as causing death were also counted as detected. Data from British Columbia were only available for people who experienced accidental or undetermined acute toxicity deaths involving "street drugs" or pharmaceutical substances not prescribed to them. As such, data for people who experienced acute toxicity deaths by suicide or due solely to prescribed substances or alcohol were not available. Percentages are based on counts randomly rounded to base 3. Numbers less than 10 have been suppressed (sup), including data on people who experienced an accidental death with 14 or more substances detected, data on people who died by suicide with 12 to 15 and 17 substances detected, and data on people whose manner of death was undetermined with 10 to 16 substances detected were suppressed. | |||
Provinces and territories
While the substances identified as causing death varied by province and territory, ethanol and cocaine were usually among the top 3 substances, and fentanyl among the top 10.
Ethanol (alcohol) was among the top 3 substances identified as causing death among all provinces and territories except for British Columbia and Alberta (Figure 24). Similarly, cocaine was commonly noted among the top 3 substances identified as causing death across all provinces and territories except for Nova Scotia, Nunavut, and Prince Edward Island. Fentanyl or a fentanyl-related analogue was among the top 10 substances across all provinces and territories except for Prince Edward Island and Nunavut.
Ethanol was among the top 10 substances detected across all provinces and territories, and among the top 3 among all except for British Columbia, New Brunswick, and Nova Scotia (Figure 25). Cocaine was among the top 10 detected substances across all provinces and territories except for Prince Edward Island and Nunavut. Clonazepam and THC were consistently included in the top 10 substances detected across New Brunswick, Nova Scotia, Newfoundland and Labrador, and Prince Edward Island.
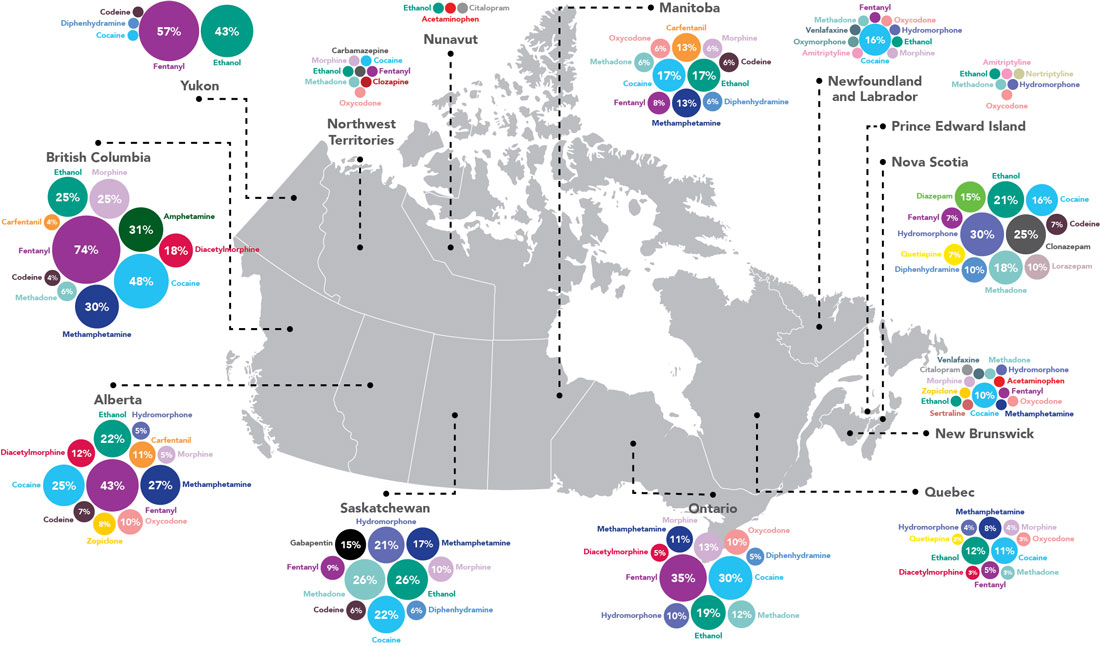
Note: The top 10 substances were presented for each province and the top five substances were presented for each territory and Prince Edward Island, where applicable. When substances were identified as causing death at the same frequency, an exception to the number of substances presented was made to allow those substances to be presented as well. Data from British Columbia were only available for people who experienced accidental or undetermined acute toxicity deaths involving "street drugs" or pharmaceutical substances not prescribed to them. As such, data for people who experienced acute toxicity deaths by suicide or due solely to prescribed substances or alcohol were not available. Note that some substances (like amphetamine or morphine) are active metabolites and their presence could mean that they were consumed or that their parent substance (methamphetamine for amphetamine, and heroin for morphine) had been consumed. As alcohol may be detected due to either consumption or post-mortem endogenous ethanol production, findings should be interpreted with caution. Percentages are based on counts randomly rounded to base 3. Percentages based on numbers less than 10 have been suppressed (sup).
Figure 24 - Text description
| Province or territory | Substance | % |
|---|---|---|
British Columbia |
Fentanyl | 74% |
| Cocaine | 48% | |
| Amphetamine | 31% | |
| Methamphetamine | 30% | |
| Morphine | 25% | |
| Ethanol | 25% | |
| Diacetylmorphine | 18% | |
| Methadone | 6% | |
| Carfentanil | 4% | |
| Codeine | 4% | |
Alberta |
Fentanyl | 43% |
| Methamphetamine | 27% | |
| Cocaine | 25% | |
| Ethanol | 22% | |
| Diacetylmorphine | 12% | |
| Carfentanil | 11% | |
| Oxycodone | 10% | |
| Zopiclone | 8% | |
| Codeine | 7% | |
| Hydromorphone | 5% | |
| Morphine | 5% | |
Saskatchewan |
Methadone | 26% |
| Ethanol | 26% | |
| Cocaine | 22% | |
| Hydromorphone | 21% | |
| Methamphetamine | 17% | |
| Gabapentin | 15% | |
| Morphine | 10% | |
| Fentanyl | 9% | |
| Codeine | 6% | |
| Diphenhydramine | 6% | |
Manitoba |
Cocaine | 17% |
| Ethanol | 17% | |
| Methamphetamine | 13% | |
| Carfentanil | 13% | |
| Fentanyl | 8% | |
| Codeine | 6% | |
| Diphenhydramine | 6% | |
| Morphine | 6% | |
| Oxycodone | 6% | |
| Methadone | 6% | |
Ontario |
Fentanyl | 35% |
| Cocaine | 30% | |
| Ethanol | 19% | |
| Morphine | 13% | |
| Methadone | 12% | |
| Methamphetamine | 11% | |
| Hydromorphone | 10% | |
| Oxycodone | 10% | |
| Diacetylmorphine | 5% | |
| Diphenhydramine | 5% | |
Quebec |
Ethanol | 12% |
| Cocaine | 11% | |
| Methamphetamine | 8% | |
| Fentanyl | 5% | |
| Hydromorphone | 4% | |
| Morphine | 4% | |
| Methadone | 3% | |
| Oxycodone | 3% | |
| Diacetylmorphine | 3% | |
| Quetiapine | 2% | |
New Brunswick |
Cocaine | 10% |
| Ethanol | sup | |
| Hydromorphone | sup | |
| Fentanyl | sup | |
| Oxycodone | sup | |
| Sertraline | sup | |
| Zopiclone | sup | |
| Methamphetamine | sup | |
| Methadone | sup | |
| Morphine | sup | |
| Venlafaxine | sup | |
| Citalopram | sup | |
| Acetaminophen | sup | |
Nova Scotia |
Hydromorphone | 30% |
| Clonazepam | 25% | |
| Ethanol | 21% | |
| Methadone | 18% | |
| Cocaine | 16% | |
| Diazepam | 15% | |
| Lorazepam | 10% | |
| Diphenhydramine | 10% | |
| Fentanyl | 7% | |
| Codeine | 7% | |
| Quetiapine | 7% | |
Prince Edward Island |
Ethanol | sup |
| Methadone | sup | |
| Nortriptyline | sup | |
| Hydromorphone | sup | |
| Oxycodone | sup | |
| Amitriptyline | sup | |
Newfoundland and Labrador |
Cocaine | 16% |
| Morphine | sup | |
| Ethanol | sup | |
| Hydromorphone | sup | |
| Oxycodone | sup | |
| Fentanyl | sup | |
| Methadone | sup | |
| Venlafaxine | sup | |
| Oxymorphone | sup | |
| Amitriptyline | sup | |
Yukon |
Fentanyl | 57% |
| Ethanol | 43% | |
| Cocaine | sup | |
| Codeine | sup | |
| Diphenhydramine | sup | |
Northwest Territories |
Ethanol | sup |
| Morphine | sup | |
| Cocaine | sup | |
| Oxycodone | sup | |
| Fentanyl | sup | |
| Methadone | sup | |
| Clozapine | sup | |
| Carbamazepine | sup | |
Nunavut |
Ethanol | sup |
| Citalopram | sup | |
| Acetaminophen | sup | |
| Note: The top 10 substances were presented for each province and the top five substances were presented for each territory and Prince Edward Island, where applicable. When substances were identified as causing death at the same frequency, an exception to the number of substances presented was made to allow those substances to be presented as well. Data from British Columbia were only available for people who experienced accidental or undetermined acute toxicity deaths involving "street drugs" or pharmaceutical substances not prescribed to them. As such, data for people who experienced acute toxicity deaths by suicide or due solely to prescribed substances or alcohol were not available. Note that some substances (like amphetamine or morphine) are active metabolites and their presence could mean that they were consumed or that their parent substance (methamphetamine for amphetamine, and heroin for morphine) had been consumed. As alcohol may be detected due to either consumption or post-mortem endogenous ethanol production, findings should be interpreted with caution. Percentages are based on counts randomly rounded to base three. Percentages based on numbers less than 10 have been suppressed (sup). | ||
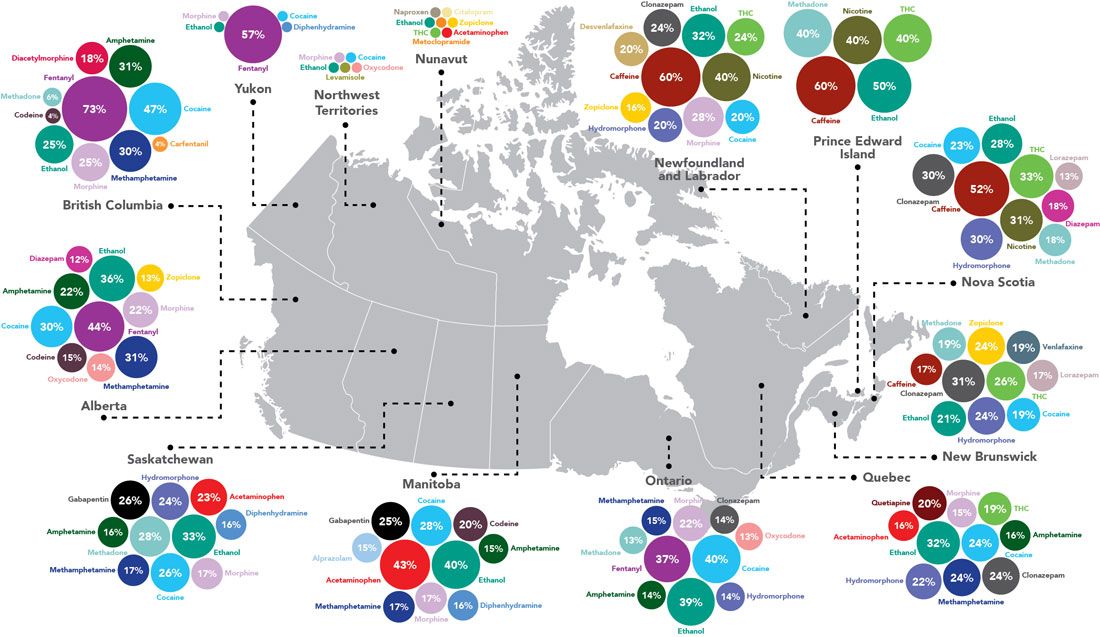
Note: The top 10 substances were presented for each province and the top five substances were presented for each territory and Prince Edward Island, where applicable. When substances were detected at the same frequency, an exception to the number of substances presented was made to allow those substances to be presented as well. Data from British Columbia were only available for people who experienced accidental or undetermined acute toxicity deaths involving "street drugs" or pharmaceutical substances not prescribed to them. As such, data for people who experienced acute toxicity deaths by suicide or due solely to prescribed substances or alcohol were not available. As only cause of death information was available for cases from British Columbia, substances identified as causing death were also counted as detected. Note that some substances (like amphetamine or morphine) are active metabolites and their presence could mean that they were consumed or that their parent substance (methamphetamine for amphetamine, and heroin for morphine) had been consumed. As alcohol may be detected due to either consumption or post-mortem endogenous ethanol production, findings should be interpreted with caution. Percentages are based on counts randomly rounded to base 3. Percentages based on numbers less than 10 have been suppressed (sup).
Figure 25 - Text description
| Province or territory | Substance | % |
|---|---|---|
British Columbia |
Fentanyl | 73% |
| Cocaine | 47% | |
| Amphetamine | 31% | |
| Methamphetamine | 30% | |
| Morphine | 25% | |
| Ethanol | 25% | |
| Diacetylmorphine | 18% | |
| Methadone | 6% | |
| Carfentanil | 4% | |
| Codeine | 4% | |
Alberta |
Fentanyl | 44% |
| Ethanol | 36% | |
| Methamphetamine | 31% | |
| Cocaine | 30% | |
| Amphetamine | 22% | |
| Morphine | 22% | |
| Codeine | 15% | |
| Oxycodone | 14% | |
| Zopiclone | 13% | |
| Diazepam | 12% | |
Saskatchewan |
Ethanol | 33% |
| Methadone | 28% | |
| Cocaine | 26% | |
| Gabapentin | 26% | |
| Hydromorphone | 24% | |
| Acetaminophen | 23% | |
| Morphine | 17% | |
| Methamphetamine | 17% | |
| Diphenhydramine | 16% | |
| Amphetamine | 16% | |
Manitoba |
Acetaminophen | 43% |
| Ethanol | 40% | |
| Cocaine | 28% | |
| Gabapentin | 25% | |
| Codeine | 20% | |
| Methamphetamine | 17% | |
| Morphine | 17% | |
| Diphenhydramine | 16% | |
| Amphetamine | 15% | |
| Alprazolam | 15% | |
Ontario |
Cocaine | 40% |
| Ethanol | 39% | |
| Fentanyl | 37% | |
| Morphine | 22% | |
| Methamphetamine | 15% | |
| Clonazepam | 14% | |
| Hydromorphone | 14% | |
| Amphetamine | 14% | |
| Methadone | 13% | |
| Oxycodone | 13% | |
Quebec |
Ethanol | 32% |
| Cocaine | 24% | |
| Methamphetamine | 24% | |
| Clonazepam | 24% | |
| Hydromorphone | 22% | |
| Quetiapine | 20% | |
| THC | 19% | |
| Acetaminophen | 16% | |
| Amphetamine | 16% | |
| Morphine | 15% | |
New Brunswick |
Clonazepam | 31% |
| THC | 26% | |
| Hydromorphone | 24% | |
| Zopiclone | 24% | |
| Ethanol | 21% | |
| Cocaine | 19% | |
| Methadone | 19% | |
| Venlafaxine | 19% | |
| Caffeine | 17% | |
| Lorazepam | 17% | |
Nova Scotia |
Caffeine | 52% |
| THC | 33% | |
| Nicotine | 31% | |
| Clonazepam | 30% | |
| Hydromorphone | 30% | |
| Ethanol | 28% | |
| Cocaine | 23% | |
| Methadone | 18% | |
| Diazepam | 18% | |
| Lorazepam | 13% | |
Prince Edward Island |
Caffeine | 60% |
| Ethanol | 50% | |
| Nicotine | 40% | |
| Methadone | 40% | |
| THC | 40% | |
Newfoundland and Labrador |
Caffeine | 60% |
| Nicotine | 40% | |
| Ethanol | 32% | |
| Morphine | 28% | |
| THC | 24% | |
| Clonazepam | 24% | |
| Cocaine | 20% | |
| Hydromorphone | 20% | |
| Desvenlafaxine | 20% | |
| Zopiclone | 16% | |
Yukon |
Fentanyl | 57% |
| Cocaine | sup | |
| Ethanol | sup | |
| Morphine | sup | |
| Diphenhydramine | sup | |
Northwest Territories |
Ethanol | sup |
| Cocaine | sup | |
| Morphine | sup | |
| Oxycodone | sup | |
| Levamisole | sup | |
Nunavut |
Ethanol | sup |
| THC | sup | |
| Citalopram | sup | |
| Acetaminophen | sup | |
| Zopiclone | sup | |
| Metoclopramide | sup | |
| Naproxen | sup | |
| Note: The top 10 substances were presented for each province and the top five substances were presented for each territory and Prince Edward Island, where applicable. When substances were identified as causing death at the same frequency, an exception to the number of substances presented was made to allow those substances to be presented as well. Data from British Columbia were only available for people who experienced accidental or undetermined acute toxicity deaths involving "street drugs" or pharmaceutical substances not prescribed to them. As such, data for people who experienced acute toxicity deaths by suicide or due solely to prescribed substances or alcohol were not available. Note that some substances (like amphetamine or morphine) are active metabolites and their presence could mean that they were consumed or that their parent substance (methamphetamine for amphetamine, and heroin for morphine) had been consumed. As alcohol may be detected due to either consumption or post-mortem endogenous ethanol production, findings should be interpreted with caution. Percentages are based on counts randomly rounded to base three. Percentages based on numbers less than 10 have been suppressed (sup). | ||
Limitations
Data for this study were abstracted from all coroner and medical examiner files that met the study case definition from all Canadian provinces and territories. It is possible that some people who died of an acute toxicity were not included in this study if the death was not reported to the coroner or medical examiner office for investigation or if they were not identified as a potential case.
Coroner and medical examiner files document investigations into the cause, manner, and circumstances of death. The information available differed across individual files and coroner and medical examiner offices due to differences in the death investigation processes, death classification methods, toxicology testing, and the manners of death reported. In addition, data collection limitations identified in Table 1 may have resulted in an underestimation of burden as well as introduced potential bias in findings due to systematic differences in available data. As such, it is important to remember that this study only reports minimum counts, proportions, and mortality rate estimates, and that these likely underestimate the true population prevalence of reported characteristics. While several variables included in this report had a high proportion of missing values and should be interpreted with caution, they provide national-level information and a level of detail not previously available.
While all toxicology data available in coroner and medical examiner files were collected, differences in substances tested, testing practices, and laboratory equipment across and within provinces and territories - and changes in these over time - could result in different estimates in the prevalence of substances during this period. Metabolism and decomposition can also affect the detection of substances. When interpreting findings where multiple drugs were present, it is not possible to know if they were consumed concurrently, or if their joint consumption was intentional or unintentional.
Due to the large number of files that were reviewed onsite at coroner and medical examiner offices, it was necessary to have numerous data collectors working across the country. This presents an opportunity for bias due to differences in how data were collected. To minimize abstractor error and bias, extensive standardized training and documentation were provided, and all abstractors underwent inter- and intra-rater reliability assessments prior to and during data collection.
Conclusions
This report provides an overview of people who died due to substance-related acute toxicity from January 1, 2016 to December 31, 2017. It is the first study of its kind to include coroner and medical examiner file data from all Canadian provinces and territories. According to the findings, 9,414 people (an average of 12 per day) died from acute toxicity during this two-year period. The analysis of these deaths by a multitude of personal and contextual factors provides a unique opportunity to broaden our understanding of people dying from acute toxicity and demonstrate that the circumstances leading up to death are complex and multi-faceted.
The results in this report are from an important time period. The years studied, 2016 and 2017, occurred prior to the implementation of many policies, programs, and interventions aimed at decreasing harms related to substance useFootnote 28 Footnote 29 Footnote 30 Footnote 31. In addition, changes in substance availability and supply as well as the COVID-19 pandemic have changed the landscape of this crisis in Canada over time. As such, the estimates in this report provide a baseline, measuring the impacts of these events and future interventions. In addition, our findings may help support and evaluate new policies, inform and prioritize substance use and addiction programming and prevention, and drive further research. Future products from this study will further detail the study methodology, examine specific subpopulations, and provide in-depth analysis of additional factors.
Definitions included in this report
- Accessible family doctor
- Indicates whether the person who died had an accessible family doctor or primary care physician from which they could receive regular care, if needed. Data abstractors were instructed to assume that the physician was accessible so long as there was no evidence that the person who died had difficulty accessing them for health care services.
- Acute toxicity death (sometimes described as an "overdose" or a "poisoning" death)
- A person who, according to the death certificate, autopsy report, or coroner or medical examiner report, died after an acute intoxication resulting from substance use where 1 or more of the substances was a drug or alcohol. This includes deaths with an accidental (unintentional), suicide (intentional), or undetermined manner of death.
- Age
- The age in years of the person who died at the time of death.
- Boxplot
- A boxplot displays a summary of the minimum, first quartile, median, third quartile, and maximum daily number of people who died across sexes and manners of death. If you were to order the daily number of people who died in increasing order, one quarter of all values would fall below the first quartile, indicated by the line marking the bottom of each box. Half of all ordered values would fall below the median, or second quartile, indicated by the line in the middle of the box. Three quarters of all ordered values would fall below the third quartile, indicated by the line marking the top of the box. The inter-quartile range contains the middle 50% of values and equals the distance from the top to the bottom of the box range. The lines coming out of the boxes indicate the inter-quartile range multiplied by 1.5. The circles represent outliers, extreme values outside of the inter-quartile range multiplied by 1.5. Finally, the average daily number of deaths is represented by the X mark on the box.
- Case
- A person who died in Canada between January 1, 2016 and December 31, 2017 after an acute toxicity resulting from the direct effects of the administration of exogenous substances, where 1 or more of the substances was a drug or alcohol. People who died due to chronic substance use, medical assistance in dying, palliative or comfort care, homicide, occupational exposure, trauma where an intoxicant contributed to the circumstances of the injury (like a car accident), adverse drug effects (such as anaphylactic shock), or acute toxicity due to products of combustion (like carbon monoxide) were excluded from the study.
- Cause of death
- The disease or injury that set into motion a chain of events that ended in death.
- Common-lawFootnote 32
- Two people who are not legally married but have either i) cohabitated for at least 1 year, ii) cohabitated and are together the parents of a child, or iii) entered into a cohabitation agreement
- Confidence intervalFootnote 33
- A statistical measurement of the reliability of an estimate. The size of the confidence interval relates to the precision of the estimate with narrow confidence intervals indicating greater precision than those that are wide. The 95% confidence interval shows an estimated range of values that is likely to include the true value 19 times out of 20.
- Coroner or medical examiner file
- A record of all the documents related to a death investigation. This may include, but is not limited to, a medical examiner or coroner report, an external examination report, a summary autopsy report, a detailed scientific autopsy report, a toxicology report, a death certificate, medical records, communications with next of kin, friends or witnesses, and police reports.
- Date of death
- The date of death reflects when the person died, was pronounced dead, or was found dead.
- Detected
- A substance was tested for and identified in the blood, urine, or any related specimen from the person who died. This may be a quantitative or qualitative value (for example, 'detected' or 'traces').
- Divorced
- A person who had obtained a legal divorce and who had not remarried. Persons living in a common-law relationship or described as having an "other partner" are not included in this category.
- Evening
- 6:00 pm to 11:59 pm
- Homelessness
- Homelessness describes the situation of a person without stable, safe, or appropriate housing, or the immediate means or ability to acquire it. This includes people living unsheltered on the street, staying in emergency shelters, or temporarily accommodated by couch surfing or staying with friends or family. It also includes people at immediate risk of homelessness because of job loss or eviction by a property owner, for example. See the Canadian definition of homelessness for a detailed typologyFootnote 34
- Recent release from an institution
- Indicates if the person was recently released (within the year before death) from the following institutions:
- Correctional facility, remand centre, or young offender centre
- Hospital
- Mental health facility
- Long-term residential health facility (for example, a nursing home)
- Other health facility
- Supervised residential facility related to alcohol or substance use treatment
- Supervised residential facilities not related to alcohol or substance use treatment
- Manner of death
- The manner of death reflects the circumstances surrounding the deathFootnote 35. In most jurisdictions, there are only five such categories: natural, accident, suicide, homicide, and undetermined. In this study, manners of death were determined by medical examiners or coroners who collected and examined information on how and why the death occurred. This study only included cases with the following manners of death:
- Accidental
- A death that is caused by an injury and there is no obvious intent to cause deathFootnote 36. In this study, an accidental manner of death indicates an unintentional acute toxicity.
- Suicide
- When someone dies and the evidence indicates that the person intended to cause their own deathFootnote 36. In this study, suicide as the manner of death indicates an intentional acute toxicity.
- Undetermined
- When a complete death investigation does not provide enough evidence to determine the manner of deathFootnote 36. In this study, an undetermined manner indicates the manner of death could not be assigned based on the available evidence.
- Married
- A person who was married and had not separated or obtained a divorce, and whose spouse was living.
- Minimum proportion
- The minimum number of people in a group that fit in a given category, usually described as a percentage (for example, the minimum percentage of people experiencing homelessness among all people who died of acute toxicity). This means that at least this many people have a characteristic, and there may be more we do not know about, given the nature of the data of interest and the way in which data are collected.
- Morning
- 6:00 am to 11:59 am
- Mortality rate
- The number of deaths in a specific population during a specified time, expressed as the number of deaths that occurred per a given population size. It is calculated by dividing the number of deaths during a given period of time by the population size and then multiplying by 100,000. For example, the crude mortality rate of people who have died of an acute toxicity event in 2016 and 2017 in Canada was 13.0 deaths per 100,000 residents. Comparing rates allows us to see whether some populations are more affected than others. Crude rates have no adjustments for other factors, like age, which might affect the death rate. Age-adjusted rates account for differences in death rates that are due to different age distributions in populations by using the 2016 Canadian population as a reference to compare against.
- Nighttime
- 12:00 am to 5:59 am
- Noon or afternoon
- 12:00 pm to 5:59 pm
- Other partner
- Describes relationship scenarios that do not meet the definition for common-law or married.
- Outpatient treatment
- Contact with health services that did not require inpatient admission.
- Percentage of deaths
- The number of deaths in a specific category divided by the total number of deaths in that population. For example, the percentage of the deaths that occurred in males among all people who died of an acute toxicity event was 70%.
- P-value
- A number, generated through statistical testing, that helps researchers determine if the differences they are seeing between groups are likely real or due to chance. In other words, p-values measure how confident we are that the results of data analyses are a true representation of the situation being examined. A p-value's relation to a predetermined threshold, commonly p < 0.05, determines whether to reject or accept the hypothesis that there is no difference between groups. This concept is known as hypothesis testing.
- Rate ratio
- Rate ratios divide one rate by another to create a ratio or measurement of the relative difference between rates. For example, mortality rates were significantly lower among males in rural communities (13.2 deaths per 100,000 population) compared to urban communities (19.1 deaths per 100,000 population). The rate ratio is 0.7 (or "0.6 to 0.8 ") which is interpreted as, for every 0.7 males that die in a rural community, 1 male dies in an urban community. These numbers can be scaled up to make more sense (you cannot have 0.7 of a person!). For example, multiplying both values by 100 results in a ratio of 70 males dying in rural communities for every 100 males who die in urban communities.
- Rural municipalitiesFootnote 37
- All areas within Canada outside of i) census metropolitan areas with populations of at least 100,000 residents and ii) census agglomerations with populations of at least 10,000 residents according to the 2016 Census.
- Scene
- The place where the person was discovered dead or the acute toxicity event took place. This can include any area that contains evidence related to the acute toxicity event itself.
- Separated
- A person who was married but who was no longer living with their spouse (for any reason other than illness, work, or school) and who had not obtained a divorce (that is, they were still legally married). Persons living in a common-law relationship are not included in this category.
- Sex
- The biological sex of the person who died according to the coroner or medical examiner file.
- Shelters
- Short-term (30 days or less) facilities that provide sleeping arrangements and varying supports to people seeking emergency or urgent accommodation.
- Single
- A person who had never married or whose marriage had been annulled, and who had not remarried. Persons living in a common-law relationship are not included in this category.
- Standard deviation
- A measure of how scattered observed values are around the mean (average). In statistical terms, it is the square root of the variance. Smaller standard deviations indicate a narrower spread of measurements around the mean and vice versa. Standard deviation is sensitive to extreme valuesFootnote 38.
- Substance types
-
- Alcohol
- Alcohol is an intoxicating substance that depresses central nervous system activity when consumed. This means bodily functions such as breathing, heart rate, brain functions, and thought processes can be affected. Alcohol can also cause intense feelings and suppress a person's inhibitions. For more information, please see the Government of Canada webpage on alcoholFootnote 39. In this report, substances in this group include ethanol, isopropanol, and methanol. Alcohol may be detected due to either consumption or post-mortem endogenous ethanol production.
- Acetaminophen
- Acetaminophen is a drug ingredient that reduces fever and provides temporary relief of pain. Over 600 over-the-counter and prescription medicines contain acetaminophen. It is available in single or multiple ingredient products under many different brand names and in various strengths and forms. When used as directed, acetaminophen is safe and effective. However, taking too much acetaminophen, either by accident or on purpose, may result in an overdose. Acetaminophen overdose is the leading cause of acute liver failure in Canada. For more information, please see the Government of Canada webpage on acetaminophenFootnote 40.
- Antipsychotics
- Antipsychotics are a class of prescription drugs that treat a variety of psychiatric disorders such as schizophrenia, severe depression, some forms of bipolar disorder, and other mental health disorders. In this report, substances in this group include aripiprazole, asenapine, chlorpromazine, clozapine, flupenthixol, fluphenazine, haloperidol, levomepromazine, loxapine, lurasidone, olanzapine, paliperidone, pimozide, prochlorperazine, quetiapine, risperidone, ziprasidone, and zuclopenthixol.
- Benzodiazepines
- Benzodiazepines are drugs that produce a drowsy or calming effect by slowing brain activity. In medical situations, they can be prescribed to treat conditions such as sleep disorders, seizure disorders, and anxiety disorders. They can come in liquid, tablet, or capsule form. In addition to their calming effect, benzodiazepines can create a feeling of well-being (euphoria, or feeling high). For this reason, benzodiazepines are also used in non-medical situations and sold on the illegal drug market. Benzodiazepines are controlled under Schedule IV of the Controlled Drugs and Substances ActFootnote 41. For more information, please see the Government of Canada webpage on benzodiazepinesFootnote 42. In this report, substances in this group include alprazolam, bromazepam, chlordiazepoxide, clobazam, clonazepam, diazepam, etizolam, flubromazolam, flurazepam, lorazepam, midazolam, nitrazepam, oxazepam, temazepam, triazolam, and unspecified benzodiazepines.
- Cannabinoids
- Cannabinoids are chemical substances present in cannabis that effect cell receptors in the brain and body. Some cannabinoids, like THC, create a high or intoxication. Other cannabinoids, like CBD, are being studied for potential therapeutic uses. As of October 17, 2018, cannabis is legal in Canada. However, it was not legal during the years studied in this report (2016 and 2017) except where indicated by a medical prescription. For more information, please see the Government of Canada webpage on cannabisFootnote 43. In this report, substances in this group include nabilone and tetrahydrocannabinol (THC).
- Ethanolamine antihistamines
- A class of antihistamines containing ethanolamine derivatives and belonging to the first generation category of antihistamines. They are known to be sedating and cause drowsiness and impaired cognition (thinking and judgement). In this report, substances in this group include diphenhydramine, doxylamine, and orphenadrine.
- Fentanyl opioids
- Fentanyl is a highly potent opioid pain reliever that can be lethal in small doses. It is prescribed for medical purposes to control severe pain in the form of tablets, injections, and skin patches. In addition to pain relief, fentanyl can cause the consumer to experience a quick rush of well-being (euphoria, feeling high). For this reason, fentanyl is also used in non-medical situations and sold on the illegal drug market where it is injected, smoked, snorted, or ingested. Fentanyl and its analogues (drugs with a similar chemical structure) are controlled under Schedule I of the Controlled Drugs and Substances ActFootnote 41. For more information, please see the Government of Canada webpage on fentanylFootnote 44. In this report, substances in this group include 3-methylfentanyl, 4-fluorobutyrfentanyl, 4-fluoroisobutyryl fentanyl, acetylfentanyl, acrylfentanyl, butyrylfentanyl, carfentanil, cyclopropyl/crotonyl fentanyl, despropionyl-fentanyl, fentanyl, furanylfentanyl, methoxyacetylfentanyl, fentanyl, remifentanil, and sufentanil.
- Non-fentanyl opioids
- Opioids are drugs with pain relieving properties. In medical situations, they are primarily prescribed to treat pain in the form of syrups, tablets, capsules, nasal sprays, skin patches, suppositories, and injections. In addition to pain relief, opioids can cause the consumer to experience a quick rush of euphoria followed by a long-lasting sense of wellbeing, drowsiness, and invulnerability. For this reason, opioids are also used in non-medical situations and sold on the illegal drug market. For more information, please see the Government of Canada webpage on opioids Footnote 45. In this report, opioids were grouped as fentanyl and non-fentanyl opioids. Non-fentanyl opioids include buprenorphine, codeine, dextrorphan, diacetylmorphine (heroin), dihydrocodeine, embutramide, hydrocodone, hydromorphone, meperidine, methadone, mitragynine, morphine, oxycodone, oxymorphone, pentazocine, propoxyphene, tapentadol, thebaine, tramadol, U-47700, U-49900, and U-51754.
- Unspecified opioids
- Opioids are drugs with pain relieving properties. In medical situations, they are primarily prescribed to treat pain in the form of syrups, tablets, capsules, nasal sprays, skin patches, suppositories, and injections. In addition to pain relief, opioids can cause the consumer to experience a quick rush of euphoria followed by a long-lasting sense of wellbeing, drowsiness, and invulnerability. For this reason, opioids are also used in non-medical situations and sold on the illegal drug market. For more information, please see the Government of Canada webpage on opioidsFootnote 45. In this report, people who died were included in this category if opioids were detected or described as a cause of death in the coroner or medical examiner file, but no specific substances were listed.
- Gabapentinoids
- Gabapentinoids are a class of prescription drugs used to treat medical conditions such as epilepsy and neuropathic pain. These drugs are sometimes taken in larger than prescribed quantities or combined with alcohol or other central nervous system depressants to create a euphoric, disinhibited effect, or to increase the euphoric effect of other substances. In this report, substances in this group include gabapentin and pregabalin.
- Hallucinogens
- Hallucinogens, sometimes called "psychedelic" or "psychoactive" drugs, refer to a wide variety of drugs that can change, alter, or mix up the way people feel, smell, taste, see, and hear. They are also known to distort perceptions and cause hallucinations. In this report, substances in this group include 25I-NBOMe, 3-methoxyphencyclidine (3-Meo-PCP), ibogaine, lysergic acid diethylamide (LSD), mescaline, phencyclidine, psilocybin, and unspecified hallucinogens.
- Stimulants
- Stimulants are drugs that can increase alertness, energy, and focus by speeding up or exciting the brain and other parts of the body. Prescribed stimulants are used in medical situations to treat conditions such as attention-deficit hyperactivity disorder and sleeping disorders like narcolepsy (an uncontrollable need to sleep). Pharmaceutical stimulants are also used in non-medical situations and sold on the illegal drug market. They can cause increased body temperature, heart rate, respiration, sweating, paranoia, aggression, and sometimes hallucinations or delusions, particularly when used in large doses or for an extended period. For information please see the Government of Canada webpage on prescription stimulantsFootnote 46. Non-pharmaceutical stimulants are also sold on the illegal drug market and have similar mental effects of increasing energy, alertness, and wakefulness. In this report, substances in this group include 1,3-trifluoromethylphenylpiperazine (TFMPP), 2,5-dimethoxy-4-bromo-amphetamine, 3-fluorophenmetrazine, 4-fluoroamphetamine, alpha-pyrrolidinovalerophenone, aminorex, amphetamine, beta-phenethylamine, butylone, caffeine, cocaine, dextroamphetamine, ethylone, ethylphenidate, lisdexamfetamine, methamphetamine, methylenedioxyamphetamine (MDA), methylenedioxymethamphetamine (MDMA), methylphenidate, N-benzylpiperazine (BZP), nicotine, paramethoxyamphetamine (PMA), paramethoxymethamphetamine (PMMA), phentermine, and theobromine.
- Insulin
- Insulin products are used to manage diabetes. They can be animal-sourced or biosynthetic (man-made). Adverse reactions, such as hypoglycemia (low blood glucose), can occur when more insulin is taken than the amount of insulin needed by the body. In extreme circumstances, hypoglycemia can lead to loss of consciousness and death. For more information please see the Government of Canada webpage on insulin productsFootnote 47.
- Tricyclic antidepressants (TCA)
- Antidepressants are drugs that are believed to restore normal brain function in people with mental health disorders, such as major depressive disorder and anxiety disorders, by working to bring neurotransmitters (brain chemicals like serotonin, norepinephrine, and dopamine) back into balance. Tricyclic antidepressants are a specific class of antidepressant. These can cause drowsiness and confusion if used in high doses, which may lead some people to consume them in combination with alcohol or other drugs. For more information, please see the Government of Canada webpage on antidepressantsFootnote 48. In this report, substances in this group include amitriptyline, amoxapine, clomipramine, desipramine, doxepin, imipramine, nortriptyline, trimipramine, and unspecified tricyclic antidepressants.
- Other antidepressants
- Antidepressants are drugs that are believed to restore normal brain function in people with mental health disorders, such as major depressive disorder and anxiety disorders, by working to bring neurotransmitters (brain chemicals like serotonin, norepinephrine, and dopamine) back into balance. For more information, please see the Government of Canada webpage on antidepressantsFootnote 48. In this report, substances in this group include bupropion, citalopram, desvenlafaxine, duloxetine, fluoxetine, fluvoxamine, mirtazapine, moclobemide, paroxetine, sertraline, trazodone, venlafaxine, and vortioxetine.
- Z drugs
- A colloquial term for a class of drugs that have a sedative effect and begin with the letter "Z" (zolpidem, zopiclone, and zaleplon). Belonging to a larger category known as "nonbenzodiazepines, they have a similar effect to benzodiazepines and are often used to treat insomnia. In this report, substances in this group include zolpidem and zopiclone.
- Other substance types
- Substances in this group include all detected substances not included in the categories above and do not necessarily have any common properties. In this report, substances in this group include 1,1-difluoroethane, 2,4-dinitrophenol, abacavir, acebutolol, acetone, acetylsalicylic acid, aconite, acyclovir, amantadine, amiodarone, amlodipine, amobarbital, anastrozole, apixaban, atenolol, atomoxetine, atorvastatin, atropine, baclofen, barbiturates, benzene, benzocaine, benztropine, benzydamine, bisoprolol, brompheniramine, bupivacaine, buspirone, butalbital, butane, capsaicin, carbamazepine, carbon monoxide, carvedilol, celecoxib, cetirizine, chloral hydrate, chloropheniramine, chloroquine, clonidine (p-hydroxyclonidine), colchicine, compressed air, creatinine, cyanide, cyclobenzaprine (N-desmethylcyclobenzaprine), cyproheptadine, dextromethorphan, diclofenac, dicyclomine, diethylene glycol, digoxin, diltiazem, dobutamine, domperidone, donepezil, efavirenz, enalapril, ether, ethylbenzene, ethylene glycol, etomidate, fenofibrate, flecainide, fluconazole, formic acid, furosemide, gammahydroxybutyrate (GHB), gliclazide, glyburide, dimenhydrinate, guaifenesin, heparin, hydrochlorothiazide, hydroxychloroquine, hydroxyzine, ibuprofen, indomethacin, irbesartan, iron, isobutane, ketamine, ketorolac, labetalol, lacosamide, lamotrigine, lansoprazole, laudanosine, levamisole, levetiracetam, levothyroxine, lidocaine, lisinopril, lithium, loperamide, losartan, meloxicam, memantine, mepivicaine, metformin, methocarbamol, methotrexate, metoclopramide, metoprolol, metronidazole, nadolol, naloxone, naltrexone, naproxen, nifedipine, nonsteroidal anti-inflammatory drugs (NSAIDs), noscapine, omeprazole, ondansetron, oxomemazine, oxybutynin, pantoprazole, pentobarbital, perindopril, phenacetin, pheniramine, phenobarbital, phenylephrine, phenytoin, piperazine, primidone, procyclidine, promethazine, propafenone, propofol, propranolol, propylene glycol, pseudoephedrine/ephedrine, quinapril, quinidine, quinine, rabeprazole, ramipril, ranitidine, rivaroxaban, rocuronium, ropinirole, rosuvastatin, salbutamol, scopolamine, secobarbital, selegiline (desmethylselegiline), sildenafil, sitagliptin, solifenacin, sulfonamides, sumatriptan, tadalafil, tamoxifen, telmisartan, terazosin, terbinafine, testosterone, theophylline, timolol, toluene, topiramate, trihexyphenidyl, trimethoprim, triprolidine, valproic acid, valsartan, varenicline, verapamil, W-18, warfarin, xylazine, xylene.
- Unknown substance type
- In this report, people who died were included in this category if no substances were listed as either causing death or detected in their coroner or medical examiner files.
- Substance use
- In this study, substance use is defined as use of the following:
- Non-pharmaceutical substances (including those described as "illegal" or "illicit" in coroner and medical examiner files)
- Pharmaceuticals (only those that are diverted or used not as prescribed)
- Note: Use not as prescribed does not include the concurrent use of alcohol with benzodiazepines and/or opioids (or other medications where alcohol use is not recommended).
- Over-the-counter medications
- Inhalants (including solvents, aerosols, gases, and nitrites)
- Alcohol
- Supportive housing
- Supportive housing is generally long-term accommodation that provides a varying range of supportive services depending on the needs of residents. It includes accommodation for people facing barriers to housing or living independently (for example, people with a mental illness, who use substances, or who have lost autonomy in older age).
- Transitional housing
- Transitional housing is intended to maximize independence and support the development of social, vocational, recreational, and life skills. These homes can be used to house children and youth, adults or seniors with chronic disabilities, persons seeking recovery from substance use, or persons re-integrating with the community following incarceration. It is considered an intermediate step between emergency shelter and supportive housing and has its limits on how long a person or family can stay.
- Urban municipalities
- Census metropolitan areas with populations of at least 100,000 residents and census agglomerations with populations of at least 10,000 residents according to the 2016 CensusFootnote 37.
- Widowed
- A person who had lost their spouse through death and who had not remarried. Persons living in a common-law relationship are not included in this category.
List of abbreviations used in this report
- sd
- Standard deviation
- n/a
- Not applicable
- sup
- Suppressed
References
- Footnote 1
-
Statistics Canada. Table 17-10-0005-01 Population estimates on July 1st, by age and sex [Internet]. Available from: https://doi.org/10.25318/1710000501-eng
- Footnote 2
-
Cornell University. Environment, health and safety: 7.7 Toxicity [Internet]. Available from: https://ehs.cornell.edu/book/export/html/1388#
- Footnote 3
-
Belzak L, Halverson J. The opioid crisis in Canada: A national perspective. Health Promot Chronic Dis Prev Can [Internet]. 2018; 38(6): 224-233. Available from: https://www.scopus.com/inward/record.uri?eid=2-s2.0-85049092195&doi=10.24095%2fhpcdp.38.6.02&partnerID=40&md5=530ffc043c0ca9c48bc40ea5b9084538
- Footnote 4
-
Orpana HM, Lang JJ, Baxi M, Halverson J, Kozloff N, Cahill L, et al. Canadian trends in opioid-related mortality and disability from opioid use disorder from 1990 to 2014 through the lens of the global burden of disease study. Health Promot Chronic Dis Prev Can [Internet]. 2018; 38(6): 234-243. Available from: https://www.scopus.com/inward/record.uri?eid=2-s2.0-85049092867&doi=10.24095%2fhpcdp.38.6.03&partnerID=40&md5=be7fa03ee3036de27e06d4188e9b139f
- Footnote 5
-
Alsabbagh MW, Chang F, Cooke M, Elliott SJ, Chen M. National trends in population rates of opioid-related mortality, hospitalization and emergency department visits in Canada between 2000 and 2017. A population-based study. Addiction [Internet]. 2021; 116(12): 3482-3493. Available from: https://www.scopus.com/inward/record.uri?eid=2-s2.0-85108790269&doi=10.1111%2fadd.15571&partnerID=40&md5=599b0cdf568b01e78758cf9072c1af02
- Footnote 6
-
Manitoba. Problematic substance use and related harms in Manitoba: July 1 – September 30, 2019 [Internet]. Available from: https://www.manitoba.ca/health/publichealth/surveillance/docs/2019q3report.pdf
- Footnote 7
-
Ontario Agency for Health Protection and Promotion (Public Health Ontario); Office of the Chief Coroner; Ontario Forensic Pathology Service; Ontario Drug Policy Research Network. Opioid mortality surveillance report: analysis of opioid-related deaths in Ontario July 2017-June 2018 [Internet]. Toronto, ON. 2019. Available from: https://www.publichealthontario.ca/-/media/Documents/O/2019/opioid-mortality-surveillance-summary.pdf?rev=4402fd22b37a467a90593b5962ef3dcb&sc_lang=en
- Footnote 8
-
British Columbia Coroners Service. Illicit drug toxicity deaths in BC January 1, 2012 – August 31, 2022 [Internet]. 2022. Available from: https://www2.gov.bc.ca/assets/gov/birth-adoption-death-marriage-and-divorce/deaths/coroners-service/statistical/illicit-drug.pdf
- Footnote 9
-
Government of Alberta. Alberta COVID-19 opioid response surveillance report Q2 2020 [Internet]. 2020. Available from: https://open.alberta.ca/dataset/f4b74c38-88cb-41ed-aa6f-32db93c7c391/resource/e8c44bab-900a-4af4-905a-8b3ef84ebe5f/download/health-alberta-covid-19-opioid-response-surveillance-report-2020-q2.pdf
- Footnote 10
-
Canadian Community Epidemiology Network on Drug Use (CCENDU). CCENDU Bulletin: Deaths involving fentanyl in Canada, 2009-2014 [Internet]. 2015. Available from: https://www.ccsa.ca/sites/default/files/2019-05/CCSA-CCENDU-Fentanyl-Deaths-Canada-Bulletin-2015-en.pdf
- Footnote 11
-
Fischer B, Goldman B, Rehm J, Popova S. Non-medical use of prescription opioids and public health in Canada. Can J Public Health [Internet]. 2008; 99(3): 182-184. Available from: https://www.ncbi.nlm.nih.gov/pmc/articles/PMC6976140/
- Footnote 12
-
Special Advisory Committee on the Epidemic of Opioid Overdoses. Highlights from phase one of the national study on opioid- and other drug-related overdose deaths: insights from coroners and medical examiners [Internet]. Public Health Agency of Canada; 2018. Available from: https://www.canada.ca/en/public-health/services/publications/healthy-living/highlights-phase-one-national-study-opioid-illegal-substance-related-overdose-deaths.html
- Footnote 13
-
Statistics Canada. COVID-19 in Canada: Year-end update on social and economic impacts [Internet]. 2021. Available from: https://www150.statcan.gc.ca/n1/pub/11-631-x/11-631-x2021003-eng.htm
- Footnote 14
-
Public Health Agency of Canada. Modelling opioid-related deaths during the COVID-19 outbreak [Internet]. 2022. Available from: https://www.canada.ca/en/health-canada/services/opioids/data-surveillance-research/modelling-opioid-overdose-deaths-covid-19.html
- Footnote 15
-
Special Advisory Committee on the Epidemic of Opioid Overdoses. Opioid- and stimulant-related harms in Canada (September 2022) [Internet]. Ottawa: Public Health Agency of Canada; 2022. Available from: https://health-infobase.canada.ca/substance-related-harms/opioids-stimulants
- Footnote 16
-
Health Canada. Federal actions on opioids to date [Internet]. 2022. Available from: https://www.canada.ca/en/health-canada/services/opioids/federal-actions/overview.html
- Footnote 17
-
Jones W, Kaoser R, Fischer B. Patterns, trends and determinants of medical opioid utilization in Canada 2005–2020: characterizing an era of intensive rise and fall. Subst Abuse Treat Prev Policy [Internet]. 2021; 16(1): 1-11. Available from: https://substanceabusepolicy.biomedcentral.com/articles/10.1186/s13011-021-00396-5
- Footnote 18
-
Government of Canada. Stigma around drug use [Internet]. 2022. [Available from: https://www.canada.ca/en/health-canada/services/opioids/stigma.html
- Footnote 19
-
Statistics Canada. Canadian coroner and medical examiner database: Annual report [Internet]. 2015. Available from: https://www150.statcan.gc.ca/n1/pub/82-214-x/2012001/int-eng.htm
- Footnote 20
-
Special Advisory Committee on the Epidemic of Opioid Overdoses (SAC). Area-level characteristics of substance-related acute toxicity deaths: a descriptive analysis of a national chart review study of coroner and medical examiner data [Internet]. Ottawa: Public Health Agency of Canada; 2022. Available from: https://www.canada.ca/en/health-canada/services/opioids/data-surveillance-research/area-level-characteristics-substance-related-acute-toxicity-deaths-analysis-coroner-medical-examiner-data.html
- Footnote 21
-
Statistics Canada. Census profile. 2016 Census. Statistics Canada catalogue no. 98-316-X2016001. Ottawa. Released November 29, 2017 [Internet]. 2017. Available from: https://www12.statcan.gc.ca/census-recensement/2016/dp-pd/prof/index.cfm
- Footnote 22
-
Statistics Canada. Annual demographic estimates: Canada, provinces and territories [Internet]. 2022. Available from: https://www150.statcan.gc.ca/n1/en/catalogue/91-215-X.
- Footnote 23
-
SAS Institute Inc 2013. SAS/ACCESS®9.4 Interface to ADABAS: Reference. Cary, NC: SAS Institute Inc.
- Footnote 24
-
R Core Team (2021). R: A language and environment for statistical computing. R Foundation for Statistical Computing, Vienna, Austria. Available from: https://www.R-project.org/
- Footnote 25
-
RStudio: Integrated development environment for R. RStudio, PBC, Boston, MA URL. Available from: http://www.rstudio.com/
- Footnote 26
-
British Columbia Coroners Service. Suicide deaths in BC: 2008-2018 [Internet]. 2020. Available from: https://www2.gov.bc.ca/assets/gov/birth-adoption-death-marriage-and-divorce/deaths/coroners-service/statistical/suicide.pdf.
- Footnote 27
-
Special Advisory Committee on the Epidemic of Opioid Overdoses (SAC). Homelessness and substance-related acute toxicity deaths: a descriptive analysis of a national chart review study of coroner and medical examiner data [Internet]. Ottawa: Public Health Agency of Canada; 2022. Available from: https://www.canada.ca/en/health-canada/services/opioids/data-surveillance-research/homelessness-substance-related-acute-toxicity-deaths.html
- Footnote 28
-
Government of Canada. About the Good Samaritan Drug Overdose Act [Internet]. 2021. Available from: https://www.canada.ca/en/health-canada/services/opioids/about-good-samaritan-drug-overdose-act.html
- Footnote 29
-
Government of Ontario. Data standards for the identification and monitoring of systemic racism [Internet]. 2022. Available from: https://www.ontario.ca/document/data-standards-identification-and-monitoring-systemic-racism
- Footnote 30
-
Government of Canada. Exemption from Controlled Drugs and Substances Act: Personal possession of small amounts of certain illegal drugs in British Columbia (January 31, 2023 to January 31, 2026) [Internet]. 2022. Available from: https://www.canada.ca/en/health-canada/services/health-concerns/controlled-substances-precursor-chemicals/policy-regulations/policy-documents/exemption-personal-possession-small-amounts-certain-illegal-drugs-british-columbia.html
- Footnote 31
-
Government of Canada. Coronavirus disease (COVID-19) [Internet]. 2022. Available from: https://www.canada.ca/en/public-health/services/diseases/coronavirus-disease-covid-19.html
- Footnote 32
-
Statistics Canada. Common-law status of person [Internet]. 2021. Available from: https://www23.statcan.gc.ca/imdb/p3Var.pl?Function=DEC&Id=206980
- Footnote 33
-
Public Health Agency of Canada. Autism spectrum disorder: Highlights from the 2019 Canadian Health Survey on Children and Youth [Internet]. 2022. Available from: https://www.canada.ca/content/dam/phac-aspc/documents/services/publications/diseases-conditions/autism-spectrum-disorder-canadian-health-survey-children-youth-2019/autism-spectrum-disorder-canadian-health-survey-children-youth-2019.pdf
- Footnote 34
-
Gaetz S BC, Friesen A, Harris B, Hill C, Kovacs-Burns K, Pauly B, Pearce B, Turner A, Marsolais A. Canadian definition of homelessness [Internet]. Toronto: Canadian Observatory on Homelessness Press; 2017. Available from: https://www.homelesshub.ca/sites/default/files/COHhomelessdefinition.pdf
- Footnote 35
-
Government of Nova Scotia. Nova Scotia Medical Examiner Service [Internet]. 2021. Available from: https://novascotia.ca/just/cme/
- Footnote 36
-
Government of Alberta. Death investigation process [Internet]. 2022. Available from: https://www.alberta.ca/death-investigation-process.aspx
- Footnote 37
-
Statistics Canada. Population centre and rural area classification 2016 [Internet]. 2017. Available from: https://www23.statcan.gc.ca/imdb/p3VD.pl?Function=getVD&TVD=339235
- Footnote 38
-
Statistics Canada. 4.5.3 Calculating the variance and standard deviation [Internet]. 2021. Available from: https://www150.statcan.gc.ca/n1/edu/power-pouvoir/ch12/5214891-eng.htm
- Footnote 39
-
Government of Canada. About alcohol [Internet]. 2021. Available from: https://www.canada.ca/en/health-canada/services/substance-use/alcohol/about.html
- Footnote 40
-
Government of Canada. Acetaminophen [Internet]. 2016. Available from: https://www.canada.ca/en/health-canada/services/drugs-medical-devices/acetaminophen.html
- Footnote 41
-
Government of Canada. Controlled Drugs and Substances Act (S.C. 1996, c. 19) [Internet]. 2022. Available from: https://laws-lois.justice.gc.ca/eng/acts/c-38.8/
- Footnote 42
-
Government of Canada. Benzodiazepines [Internet]. 2021. Available from: https://www.canada.ca/en/health-canada/services/substance-use/controlled-illegal-drugs/benzodiazepines.html
- Footnote 43
-
Government of Canada. About cannabis [Internet]. 2022. Available from: https://www.canada.ca/en/health-canada/services/drugs-medication/cannabis/about.html
- Footnote 44
-
Government of Canada. Fentanyl [Internet]. 2021. Available from: https://www.canada.ca/en/health-canada/services/substance-use/controlled-illegal-drugs/fentanyl.html#a1
- Footnote 45
-
Government of Canada. Opioids [Internet]. 2022. Available from: https://www.canada.ca/en/health-canada/services/opioids.html
- Footnote 46
-
Government of Canada. Prescription stimulants [Internet]. 2022. Available from: https://www.canada.ca/en/health-canada/services/drugs-medication/prescription-stimulants.html
- Footnote 47
-
Government of Canada. Insulin products [Internet]. 2010. Available from: https://www.canada.ca/en/health-canada/services/healthy-living/your-health/medical-information/insulin-products.html
- Footnote 48
-
Government of Canada. Antidepressants [Internet]. 2012. Available from: https://www.canada.ca/en/health-canada/services/drugs-medical-devices/antidepressant-drugs.html