
PacifiCan's 2024 to 2025 Departmental Results Report
On this page
- At a glance
- From the Minister
- Results - what we achieved
- Spending and human resources
- Supplementary information tables
- Federal tax expenditures
- Corporate information
- Definitions
Copyright information
© His Majesty the King in Right of Canada, as represented by the Minister of Housing and Infrastructure and Minister responsible for Pacific Economic Development Canada, 2025, ISSN: 2817-7223
At a glance
This departmental results report details PacifiCan’s actual accomplishments against the plans, priorities and expected results outlined in its 2024–25 Departmental Plan.
Key priorities
PacifiCan identified the following key priorities for 2024-25:
- Quality jobs
Well-paying and reliable jobs are a critical part of addressing affordability challenges. PacifiCan helps businesses and communities create the quality jobs that British Columbians need. - Competitive industry clusters
In British Columbia’s small and medium-sized enterprise (SME)-driven economy, industry clusters help reduce costs, inspire innovation, and improve productivity. Clusters are local groups of companies and other organizations who cooperate and compete to create products and services at an advantage. - Globally successful businesses
PacifiCan supports businesses to accelerate their growth and expand to new markets, which increases wealth in our communities and improves our standard of living in the long-term. - Inclusive growth
Economic participation of British Columbia’s diverse people and regions improves outcomes for all. Leveraging the Agency’s on-the-ground presence across British Columbia, PacifiCan works to unlock economic opportunities in communities and for under-represented people across the province.
Highlights for PacifiCan in 2024-25
- Total actual spending (including internal services): $136,548,632
- Total full-time equivalent staff (including internal services): 187 FTE
For complete information on PacifiCan’s total spending and human resources, read the Spending and human resources section of its full departmental results report.
Summary of results
The following provides a summary of the results the department achieved in 2024-25 under its main areas of activity, called “core responsibilities.”
Core responsibility 1: Economic Development in British Columbia
Actual spending: $125,990,809
Actual full-time equivalent staff: 30 FTE
PacifiCan promotes growth and diversification in British Columbia’s economy by enhancing innovation, improving business competitiveness and promoting the adoption of new technologies and inclusive growth. With staff located across the province, the Agency supports regionally tailored economic development through strategic investments in projects and initiatives that advance economic development in British Columbia.
To support this work, PacifiCan continued to deliver its core programs: Regional Economic Growth through Innovation (REGI), Community Economic Development and Diversification (CEDD), Economic Development Initiative (EDI), and the Pacific Business Service Network (PBSN). In addition, PacifiCan delivered a number of temporary programs, including the Lytton Homeowner Resilient Rebuild and the Lytton Business Restart Programs, the Regional Quantum Initiative (RQI), and the Tourism Growth Program (TGP). In 2024-25, PacifiCan also launched the new Regional Artificial Intelligence Initiative (RAII) and Regional Homebuilding Innovation Initiative (RHII) in British Columbia.
In 2024-25, PacifiCan investments supported over 3,400 SMEs, helped create over 10,200 jobs and helped businesses grow their revenue by $492.6 million across British Columbia.
Businesses are growing in British Columbia
PacifiCan’s investments under this departmental result help businesses in British Columbia drive innovation and grow, positioning the province as a leader in key sectors such as clean technology, quantum computing, and life sciences. In 2024-25, the Agency's investments under this departmental result led to over 7,300 jobs created and $386.5 million in export sales growth. Under this departmental result, the Agency exceeded its targets for four out of five departmental result indicators. It nearly met its target for revenue growth rate of firms supported by PacifiCan, reporting 15% against a target of 16% for 2024-25.
Communities are growing in British Columbia
Under this departmental result, PacifiCan supports job creation and economic development in communities across the province. In 2024-25, PacifiCan’s investments in this area created over 2,300 jobs, driving inclusive economic growth and enhancing community resilience across British Columbia. Under this departmental result, the Agency exceeded its targets for four of five departmental result indicators. It did not meet its target for number of contributing partners engaged in advancing community-based projects (e.g., providing financial or in-kind support) because new projects implemented in 2024-25 were more closely aligned with Business-related indicators.
Businesses are commercializing technology and adopting technology in British Columbia
PacifiCan investments in this area help businesses commercialize and adopt new technologies to increase domestic and international sales and create jobs. In 2024-25, PacifiCan’s investments in this area saw over 500 jobs created, $148 million in export sales growth, 155 technologies to market, and $27.2 million in business sales growth. PacifiCan exceeded its targets for all indicators under this departmental result.
For more information on PacifiCan’s Economic Development in British Columbia read the ‘Results – what we achieved” section of its departmental results report.
From the Minister

The Honourable Gregor Robertson
Minister of Housing and Infrastructure and Minister responsible for Pacific Economic Development Canada
As Minister responsible for PacifiCan, I am pleased to present PacifiCan’s Departmental Results Report for 2024–25.
Whether it’s working in partnership with innovators in the Lower Mainland, participants in the circular economy on the Island and Sunshine Coast, or women entrepreneurs across British Columbia PacifiCan is having an incredible impact across our province. In 2024-25, PacifiCan’s investments supported over 10,200 British Columbian jobs, helped bring 155 technologies to market, and contributed to approximately $548 million in export sales growth by PacifiCan funding recipients. These transformative results are helping to make Canada the strongest and most resilient economy in the G7.
In addition to its ongoing partnerships, investment programs and other services, PacifiCan also launched two temporary investment programs in 2024-25 tailored to British Columbians’ opportunities. The Regional Artificial Intelligence Initiative is advancing AI innovation and adoption, and the Regional Homebuilding Innovation Initiative is accelerating local solutions to homebuilding challenges. These efforts boost productivity and resilience, strengthening our companies and communities for today’s challenges and tomorrow’s opportunities.
I am inspired by the spirit of collaboration and ambition that defines our province. Please read on to see how PacifiCan and its partners are realizing that ambition for British Columbians and Canadians.
Results – what we achieved
Core responsibilities and internal services
Core responsibility 1: Economic Development in British Columbia
Description
Pacific Economic Development Canada (PacifiCan) promotes growth and diversification in the British Columbian economy by enhancing innovation, improving business competitiveness, promoting the adoption of clean technologies and inclusive growth.
Quality of life impacts
PacifiCan is the federal agency in British Columbia focused on the economy. The Agency works with partners, such as small businesses, communities, and other organizations, to help build a path to prosperity for all British Columbians. PacifiCan’s core responsibility, ‘Economic Development in British Columbia’, aligns with two Prosperity Domain indicators within Canada’s Quality of Life Framework:
Domain: Prosperity
Subdomain: Income and growth
Indicator: Productivity
Measure: Real gross domestic product (GDP) per hour worked
Domain: Prosperity
Subdomain: Employment and job quality
Indicator: Employment
Measure: Percentage of the population that are employed, unemployed and/or participating in the workforce
Progress on results
This section details the department’s performance against its targets for each departmental result under Core responsibility 1: Economic Development in British Columbia.
PacifiCan’s previous departmental results reports were built on a departmental results framework (DRF) inherited from the former Western Economic Diversification Canada. The Agency’s 2024-25 Departmental Plan was built on a new DRF, and this Departmental Results Report is the first to report on the new DRF. This new framework includes performance indicators that are more directly attributable to PacifiCan’s activities. As this is the Agency’s first Departmental Results Report using the revised DRF, past results are not available (N/A) for new indicators in the tables below.
Please refer to the “summary of changes to the reporting framework since last year” section of PacifiCan’s 2024-25 Departmental Plan for additional information on the changes to the DRF.
Table 1: Businesses are growing in British Columbia
Table 1 shows the target, the date to achieve the target and the actual result for each indicator under Businesses are growing in British Columbia in the last three fiscal years.
| Departmental result indicator | Target | Date to achieve target | Actual results |
|---|---|---|---|
| Number of jobs created (Businesses-related projects) | 751 | March 2025 | 2022-23: N/A 2023-24: N/A 2024-25: 2,634 |
| Number of highly qualified personnel (HQP) jobs created (Businesses-related projects) | 509 | March 2025 | 2022-23: N/A 2023-24: N/A 2024-25: 1,074 |
| Value of exports (Businesses-related projects) | $184.8M | March 2025 | 2022-23: N/A 2023-24: N/A 2024-25: $386.5M |
| Number of directly assisted PacifiCan recipients that are majority-led by under-represented groups | 27 | March 2025 | 2022-23: N/A 2023-24: N/A 2024-25: 34 |
| Revenue growth rate of firms supported by PacifiCan programs | 16% | March 2025 | 2022-23: 24.5% 2023-24: 15.7% 2024-25: 15% |
Table 2: Communities are growing in British Columbia
Table 2 shows the target, the date to achieve the target and actual result for each indicator under Communities are growing in British Columbia in the last three fiscal years.
| Departmental result indicator | Target | Date to achieve target | Actual results |
|---|---|---|---|
| Number of jobs created (Community-based projects) | 15 | March 2025 | 2022-23: N/A 2023-24: N/A 2024-25: 2,362 |
| Number of highly-qualified personnel (HQP) jobs created (Community-based projects) | 13 | March 2025 | 2022-23: N/A 2023-24: N/A 2024-25: 551 |
| Number of contributing partners engaged in advancing community-based projects (e.g., providing financial or in-kind support) | 109 | March 2025 | 2022-23: N/A 2023-24: N/A 2024-25: 70 |
| Value of PacifiCan community economic development investments | $7.5M | March 2025 | 2022-23: N/A 2023-24: N/A 2024-25: $11.3M |
| Amount leveraged per dollar invested by PacifiCan in community projects | 1.0 | March 2025 | 2022-23: 0.95 2023-24: 0.89 2024-25: 1.5 |
Table 3: Businesses are commercializing technology and adopting technology in British Columbia
Table 3 shows the target, the date to achieve the target and actual result for each indicator under Businesses are commercializing technology and adopting technology in British Columbia in the last three fiscal years.
| Departmental result indicator | Target | Date to achieve target | Actual results |
|---|---|---|---|
| Number of jobs created (Technology-related projects) | 306 | March 2025 | 2022-23: N/A 2023-24: N/A 2024-25: 504 |
| Number of highly qualified personnel (HQP) jobs created (Technology-related projects) | 182 | March 2025 | 2022-23: N/A 2023-24: N/A 2024-25: 310 |
| Value of exports (Technology-related projects) | $147.5M | March 2025 | 2022-23: N/A 2023-24: N/A 2024-25: $148.5M |
| Number of technologies to market | 32 | March 2025 | 2022-23: N/A 2023-24: N/A 2024-25: 155 |
| Value of business sales growth resulting from technology commercialization or adoption | $26.3M | March 2025 | 2022-23: N/A 2023-24: N/A 2024-25: $27.2M |
The Results section of the Infographic for PacifiCan on GC Infobase page provides additional information on results and performance related to its program inventory.
Details on results
As a convenor, pathfinder, advisor and investor, PacifiCan worked in communities and with businesses and organizations to invest in projects and initiatives that advance economic development in British Columbia. In 2024–25, PacifiCan investments supported over 3,400 SMEs, helped create more than 10,200 jobs, and contributed to a total revenue increase of $492.6 million for businesses across British Columbia.
In the same period, PacifiCan approved $74.98 million in new investment across 111 new projects to help communities and businesses innovate, grow and export.
PacifiCan’s core responsibility was advanced through its key economic development programming:
- Regional Economic Growth through Innovation (REGI)
- Community Economic Development and Diversification (CEDD)
- Economic Development Initiative (EDI)
- Pacific Business Service Network (PBSN)
PacifiCan’s Business Acceleration Pilot (BizAP) supports high-growth-potential firms with activities such as capital attraction, market development, customer retention, coaching, networking, and strategy development. Launched in October 2023, with the first investments in 2024, BizAP is a three-year pilot initiative under REGI. PacifiCan is tracking results such as number of SMEs assisted, number of jobs created, value of incremental private sector investment attracted, and revenue and export sales growth of supported companies. It is the first PacifiCan initiative under a core program designed and implemented in direct response to British Columbians’ needs.
In addition to its core programs, PacifiCan delivered temporary programs: the Lytton Homeowner Resilient Rebuild and the Lytton Business Restart Programs, the Regional Quantum Initiative (RQI), and the Tourism Growth Program (TGP). In 2024-25, PacifiCan also launched the new Regional Artificial Intelligence Initiative (RAII) and Regional Homebuilding Innovation Initiative (RHII) in British Columbia. As part of the Government of Canada’s strategic investments to secure Canada’s AI advantage, RAII helps British Columbian businesses commercialize and adopt AI technology and support the growth of British Columbia’s AI ecosystem. RHII is part of Canada’s Housing Plan and aims to advance innovation in the residential construction sector. Through the delivery of RHII, PacifiCan will support local innovative housing solutions and boost manufacturing efficiency in the homebuilding sector in British Columbia.
In 2024-25, PacifiCan provided regional insights to federal partners informing policy, program, and project decisions that advanced economic development across British Columbia. For example, PacifiCan participated in committees that provide information, oversight and recommendations under Natural Resources Canada’s Critical Minerals Infrastructure Fund. This program invests in clean energy and transportation infrastructure projects necessary to enable the sustainable development and expansion of critical minerals in Canada, including in British Columbia.
The Agency also strengthened its pathfinding relationships with federal, provincial, and external partners with the development of new procedures, such as guidance to help PacifiCan officers in make referrals to other available services and supports. These new procedures have helped to connect British Columbia businesses, non-profits, and communities with external programs for funding and other services beyond those available through PacifiCan.
The following section describes the results for Economic Development in British Columbia in 2024–25 compared with the planned results set out in PacifiCan’s departmental plan for the year.
Businesses are growing in British Columbia
Results achieved
PacifiCan supports British Columbian businesses to innovate, scale up and pursue long-term competitiveness and growth. PacifiCan programming is delivered in three ways: directly to businesses, through ecosystem organizations, and through community support.
- In 2024-25, the 138 projects under this departmental result contributed to 2,634 jobs created and $386.5 million in export sales growth.Footnote 1 These include results from core programs such as BSP, RIE and CEDD, as well as programs that have ended, such as the Jobs and Growth Fund and the Aerospace Regional Recovery Initiative.
- Through the BSP program, PacifiCan helped businesses scale-up, reach new markets, and increase sales. In 2024-25, the 47 BSP projects under this departmental result reported over 480 jobs created, including 345 highly qualified personnel jobs, as well as more than $270 million in export sales growth.Footnote 2
- The RIE program supported organizations that foster business innovation and growth, leading to $44.6 million in export sales growth in 2024-25.
- Under this departmental result, the Agency exceeded its targets for four out of five departmental result indicators. Results were higher than expected because certain projects had stronger performance than expected and/or new projects were funded in in 2024-25. PacifiCan nearly met its target for revenue growth rate of firms it supported, reporting 15% against a target of 16% for 2024-25. The indicator was slightly lower than expected.
Project spotlight: Business Scale-up and Productivity (BSP)
Kardium Inc.
Kardium is a Burnaby-based medical device company developing the Globe system, a medical device for treating atrial fibrillation, a common heart rhythm disorder.
With a $5 million PacifiCan investment, Kardium has increased manufacturing capacity to support anticipated sales following regulatory approvals. Through this investment, Kardium has expanded its manufacturing facilities, created 180 highly qualified personnel jobs, and attracted US$104 million in foreign investment.
Building on this momentum, Kardium raised an additional US$250 million in the summer of 2025 to support the commercial launch of the Globe system. This significant investment reflects growing confidence in the company’s innovative product and the success of its PacifiCan-supported scale-up efforts.
Communities are growing in British Columbia
Results achieved
PacifiCan helps communities in British Columbia realize economic development opportunities and build resilience. The Agency strives to increase the participation of underrepresented groups across the economy to ensure inclusive economic growth.
- In 2024-25, the 138 projects under this departmental result reported 2,362 jobs created through PacifiCan investments in programs such CEDD and TGP, as well as programs that have ended such as the Canada Community Revitalization Fund (CCRF) and the Tourism Relief Fund (TRF).Footnote 3
- The PBSN is a network of organizations funded by PacifiCan to support SMEs and entrepreneurs in British Columbia. PBSN organizations are Community Futures, WeBC, and the Société de développement économique de la Colombie-Britannique (SDECB). Collectively, in 2024-25, they provided 495 loans valued at $36 million to SMEs, creating or maintaining 1,746 jobs across the province.
- The CEDD program helped create enduring economic benefits for British Columbians, reporting over 960 jobs created.
- Under this departmental result, PacifiCan exceeded its targets for four of five departmental result indicators. Results were higher than expected because certain projects had stronger performance than expected and/or new projects were funded in in 2024-25. The Agency did not achieve its target for number of contributing partners engaged in advancing community-based projects. Results were lower than expected because new projects implemented in 2024-25 were more closely aligned with Business-related indicators.
Project spotlight: Women’s Enterprise Initiative (WEI)
WeBC
Since 1995, WeBC has helped thousands of women to grow their businesses through business loans, mentorship, training, and resources. In 2024-25, WeBC celebrated 30 years of operation. It recognized this milestone at events in Kelowna, Prince George, and Vancouver in February 2025, honouring its accomplishments and impact, made in collaboration with its community of partners, volunteers and clients. WeBC’s operations and investment fund have been funded by PacifiCan (and its predecessor, Western Economic Diversification) over the organization’s full 30 year history.
WeBC’s most recent five-year impact report highlighted that it provided $8.5 million in loans between 2019 and 2024, generating about $223 million in incremental revenue and 3,700 person-years of employment. It concludes that every dollar lent by WeBC created more than $15 in economic impact.

Figure 1: WeBC celebrated its 30th anniversary in operation in February 2025
Businesses are commercializing technology and adopting technology in British Columbia
Results achieved
PacifiCan supports firms to commercialize new technologies, scale up operations, and improve productivity. Most of the Agency’s funding in this area directly supports businesses as they accelerate their growth by improving productivity, scaling their business and commercializing technology.
- In 2024-25, the 47 projects under this departmental result reported 504 jobs created, $148 million in export sales growth, 155 technologies to market, and $27.2 million in business sales growth resulting from technology commercialization or adoption.Footnote 4
- Under this departmental result, the 14 BSP projects reported more than $25 million in business sales growth, over 70 jobs created, and over $149 million in export sales growth.Footnote 5 This scaling up allowed businesses to reach new markets and increase sales, helping to create lasting economic benefits for British Columbians.
- The 23 RIE projects under this departmental result reported over 400 jobs created and more than $1.5 million in business sales growth, as well as 104 new technologies to market.Footnote 6
- The Agency exceeded all five of its targets for this departmental result because certain projects had stronger performance than expected in 2024-25.
Project spotlight: Regional Innovation Ecosystems (RIE)
Synergy Foundation
With a PacifiCan investment of $474,218 over three years, Synergy Foundation is supporting businesses on Vancouver Island and the Sunshine Coast to thrive in a circular economy, where waste and materials are repurposed as much as possible, maximizing economic value.
Synergy is delivering training for established businesses, supporting the launch of new ventures, and promoting innovation and collaboration through regional hub development as part of its Vancouver Island-Coast Circular Economy (VICE) Project.
This locally driven project has created jobs in coastal areas, fostered new business partnerships, and will develop strategies for co-locating businesses operating in the growing regional circular economy. The project has generated increased entrepreneurship, attracted investment, and identified new revenue streams and cost efficiencies for approximately 135 SMEs. It is expected to generate a total of $10 million in revenue growth across the island and coast.

Figure 2: Synergy Foundation is helping businesses on Vancouver Island and the Sunshine Coast transition to a circular economy
Key risks
In 2024-2025, several economic risks emerged that affected business growth, community economic development, and technology adoption in British Columbia. Tariffs and duties imposed by the U.S. and China at the end of the fiscal year threatened investment, growth and jobs in the province, particularly in sectors such as forestry, energy, machinery and equipment, food and beverage, and metal products. Fifty-three percent of British Columbia goods exports were sold to the U.S. in 2024, a decline of 5% compared to 2023.Footnote 7 While the province relied less on the U.S. as an export market than other provinces, the U.S. remained British Columbia’s top export market.
Affordability remained a key challenge for British Columbia communities, partly driven by high interest ratesFootnote 8 and the highest average housing costsFootnote 9 in the country. Rising unemploymentFootnote 10, slowing population growthFootnote 11 and an aging populationFootnote 12 contributed to persistent labour shortages. In addition, the province’s labour productivity growth in business sectors declined 1.4% in 2024 compared to 2023. In comparison, Canada’s labour productivity in business sectors rose 0.2% in 2024.Footnote 13
Major project expenditures that drive regional economies in British Columbia slowed in 2024, creating further economic challenges, particularly in rural and remote communities. In 2024, approximately $5 billion worth of major projects in British Columbia were completed, a decrease of 37% in major project completion from 2023.Footnote 14 Borrowing costs declined but remained high, making it difficult for businesses to invest and expand, particularly with the uncertainty caused by threat of trade disruptions, which were ultimately realized later in the year. Lower business investment in the latter half of the fiscal year further contributed to a decline in productivity.Footnote 15 In the first quarter of 2025, venture capital investment was 54%Footnote 16 lower than the same period in 2024. This drop in investment limits the ability of businesses to raise their productivity and to innovate, making it difficult to scale-up and grow.
To help mitigate these risks, PacifiCan:
- Continued to leverage its regional presence to nurture relationships with local businesses, innovators, and communities to strengthen partnerships;
- Used these deeper relationships and better understanding of local economies to tailor program design and delivery to address specific economic development needs;
- Worked with applicants and recipients early to identify solutions and structure projects in ways that respond to challenges and mitigate associated risks;
- Leveraged its local presence and knowledge to ensure British Columbians’ economic development needs were better reflected in national policy and program decision-making; and,
- Invested in innovation through BSP, RAII and BizAP, to improve productivity and business growth.
Resources required to achieve results
Table 4: Snapshot of resources required for Economic Development in British Columbia
Table 4 provides a summary of the planned and actual spending and full-time equivalents required to achieve results.
| Resources | Planned | Actual |
|---|---|---|
| Spending | $111,806,519 | $125,990,809 |
| Full-time equivalents | 122 FTE | 130 FTE |
The Finances section of the Infographic for PacifiCan on GC Infobase page and the People section of the Infographic for PacifiCan on GC Infobase page provide complete financial and human resources information related to its program inventory.
Related government priorities
This section highlights government priorities that are being addressed through this core responsibility.
Gender-based analysis plus
PacifiCan is committed to delivering programs and services that support all British Columbians. The Agency applies gender-based analysis plus (GBA plus) to the design of its policies, programs and initiatives, shedding light on barriers that some people face. This helps PacifiCan meet the diverse needs of British Columbians. In doing so, PacifiCan fosters inclusive growth by supporting underrepresented entrepreneurs, including women, Indigenous peoples, youth, persons with disabilities, Francophones, and Black British Columbians, to fully participate in the economy.
In 2024-25, PacifiCan approved funding for 85 SMEs that were majority or fully owned or led by members of underrepresented groups. The total value of these projects was $51.2 million, representing approximately 67.6% of all funding approved during the year.
In 2024, PacifiCan began implementing an Indigenous Economic Inclusion Framework, which outlines the Agency’s commitment and approach to advancing Indigenous inclusion in its workplace, culture, and programs. Between fall 2024 and spring 2025, the Agency engaged with over 30 Indigenous organizations across British Columbia. Through this engagement, PacifiCan built relationships with Indigenous peoples across the province and gained insight on their priorities, perspectives, and experiences related to economic development - including those of Indigenous women and youth. This input will directly inform the Agency’s efforts to increase access to its programs and services.
Program inventory
Economic development in British Columbia is supported by the following programs:
- Business Growth
- Business Services
- Community Initiatives
- Innovation
Additional information related to the program inventory for Economic Development in British Columbia is available on the Results page on GC InfoBase.
Internal services
Description
Internal services refer to the activities and resources that support a department in its work to meet its corporate obligations and deliver its programs. The 10 categories of internal services are:
- Management and Oversight Services
- Communications Services
- Legal Services
- Human Resources Management
- Financial Management
- Information Management
- Information Technology
- Real Property
- Materiel
- Acquisitions
Progress on results
This section presents details on how the department performed to achieve results and meet targets for internal services.
In 2024–25, PacifiCan made significant progress in strengthening its internal services, highlighted by the opening of the Agency’s headquarters at Gateway Station Tower in Surrey, British Columbia. This was a key milestone in PacifiCan’s establishment and positioned the Agency at the centre of a dynamic and expanding regional economic hub. The opening of the new headquarters also deepened PacifiCan’s relationships with Indigenous peoples through engagement with local First Nations and Métis organizations in the Agency’s new community.
To support operations at the new location, the Agency restructured its Corporate Services team to continue providing high-quality service to staff across both Lower Mainland offices, making effective use of existing resources. By improving collaboration and distributing workloads more efficiently across teams, PacifiCan increased its responsiveness and ability to deliver timely, consistent support to employees.
PacifiCan also completed its first Accessibility Plan in 2024-25, outlining a strategic approach to identify, remove, and prevent barriers to employment in the federal public service. Throughout 2024-25, the Agency promoted the Values and Ethics Code for the Public Sector, including through departmental-wide training and leadership engagement. More generally, PacifiCan also continued to foster a positive workplace culture.
In 2024–25, PacifiCan adopted a Minimum Standard of Training (the Standard), a cornerstone of its new Learning Initiative. This Standard was created through extensive consultation with employees, employee resource groups, bargaining agents, other federal government departments, and subject-matter experts. It consolidates required learning into a single, accessible framework that meets Treasury Board and Canada Labour Code requirements while also advancing equity, diversity, inclusion, and reconciliation commitments. The approach prioritizes relevance, clarity, ease of access, cost efficiency, and workload sensitivity. Priority projects for 2025 and beyond include business officer development and Indigenous-focused training.
PacifiCan is committed to employment equity and the application of GBA Plus in both policy and internal human resource practices. The Agency meets or surpasses workforce availability in three of the four employment equity groups. Representation of women across classifications and salary levels is strong. While representation of persons with disabilities has increased, PacifiCan remains underrepresented in comparison with workforce availability.
The Agency advanced its internal Indigenous procurement strategy and made progress toward developing a broader social procurement strategy. A key objective of this work is to increase internal awareness of Indigenous businesses from which PacifiCan can procure goods or services. To build that awareness, Agency procurement staff attended Indigenous business trade shows and networking events to, increase potential suppliers’ awareness of PacifiCan and strengthen relationships with local Indigenous business communities. Additionally, PacifiCan identified and engaged with British Columbia-based businesses owned by underrepresented groups. Through these efforts, the Agency is laying a strong foundation for more inclusive and socially responsible procurement practices across PacifiCan.
In 2024-25, PacifiCan continued to amplify its investments in British Columbia through in-person events and announcements, digital content, and targeted media relations. This maximized awareness of the Agency and helped connect British Columbian communities, entrepreneurs, and innovators to economic opportunities. PacifiCan expanded its social media and web content with a focus on impactful storytelling and championing the successes of British Columbian businesses, key sectors, and communities. One example is the digital storytelling strategy in preparation for Web Summit Vancouver, which drove exposure for innovative businesses in British Columbia’s tech ecosystem by telling their engaging origin stories and explaining how PacifiCan has supported their success.
PacifiCan’s thoughtful storytelling approach has resulted in an increase in stakeholder engagement (i.e. more comments, shares, likes, etc.) on the Agency’s social media platforms, demonstrating that content is resonating with audiences. To enhance accessibility, PacifiCan conducted ongoing reviews of its content and implemented improvements across its digital platforms, such as developing effective ALT text on images, reducing the use of emojis, and delivering content in plain language to remove barriers and effectively engage with all audiences. Through this work, PacifiCan continued its efforts to facilitate a two-way dialogue to better understand and respond to the needs of businesses, innovators, and communities across the province.
PacifiCan also supported employees through strong internal communications by launching a newsletter to keep staff informed, connected and engaged and completed the rollout of its internal website for staff.
Resources required to achieve results
Table 5: Resources required to achieve results for internal services this year
Table 5 provides a summary of the planned and actual spending and full-time equivalents required to achieve results.
| Resource | Planned | Actual |
|---|---|---|
| Spending | $8,964,534 | $10,557,823 |
| Full-time equivalents | 48 FTE | 57 FTE |
The Finances section of the Infographic for PacifiCan on GC Infobase and the People section of the Infographic for PacifiCan on GC Infobase provide complete financial and human resources information related to its program inventory.
Contracts awarded to Indigenous businesses
Government of Canada departments are required to award at least 5% of the total value of contracts to Indigenous businesses every year.
PacifiCan’s result for 2024-25:
Table 6: Total value of contracts awarded to Indigenous businessesFootnote 17
As shown in Table 6, PacifiCan awarded 18.7 % of the total value of all contracts to Indigenous businesses for the fiscal year.
| Contracting performance indicators | 2024-25 Results |
|---|---|
| Total value of contracts awarded to Indigenous businessesFootnote 18 (A) | $300,077.33 |
| Total value of contracts awarded to Indigenous and non‑Indigenous businesses (B) | $1,604,480.26 |
| Value of exceptions approved by deputy head (C) | $0 |
| Proportion of contracts awarded to Indigenous businesses [A / (B−C) × 100] | 18.7% |
In its 2025–26 Departmental Plan, PacifiCan estimated that it would award 5 % of the total value of its contracts to Indigenous businesses by the end of 2024–25.
In its 2024–25 Departmental Plan, PacifiCan projected that 5% of its total contract value, excluding IT equipment, would be awarded to Indigenous businesses. This target was exceeded, with 18.7% of total contracts awarded to Indigenous suppliers. A significant portion of this value, approximately 95%, was tied to furniture and equipment purchases for PacifiCan’s new headquarters. Now that the office is fully operational, similarly high level of furniture procurement are not expected in future years, necessitating efforts to diversify and strengthen the Agency’s Indigenous procurement.
Spending and human resources
In this section
Spending
This section presents an overview of the department's actual and planned expenditures from 2022–23 to 2027–28.
Refocusing Government Spending
In Budget 2023, the government committed to reducing spending by $14.1 billion over five years, starting in 2023–24, and by $4.1 billion annually after that.
While not officially part of this spending reduction exercise, to respect the spirit of this exercise, PacifiCan undertook the following measures in 2024-25.
- Enhanced scrutiny was applied to international travel expenditures to ensure that decisions were cost-effective and represented the optimal use of public funds.
- Additional oversight was applied to staffing and salary-related expenditures to enhance sustainable staffing resources.
Budgetary performance summary
Table 7: Actual three-year spending on core responsibilities and internal services (dollars)
Table 7 shows the money that PacifiCan spent in each of the past three years on its core responsibilities and on internal services.
| Core responsibilities and internal services | 2024–25 main estimates | 2024–25 total authorities available for use | Actual spending over three years (authorities used) |
|---|---|---|---|
| Economic Development in British Columbia | $111,806,519 | $131,802,059 |
|
| Internal services | $8,964,534 | $10,621,042 |
|
| Total | $120,771,053 | $142,423,101 |
|
Analysis of the past three years of spending
The overall decrease in PacifiCan’s spending from 2023-24 to 2024-25 is attributed to the sunsetting of time-limited programs, including the programs announced in Budget 2021. The time-limited programs announced in Budget 2021 provided targeted funding to support pandemic relief and recovery, and included the Aerospace Regional Recovery Initiative (ARRI), the Canada Community Revitalization Fund (CCRF), the Jobs and Growth Fund (JGF), and the Tourism Relief Fund (TRF).
The Finances section of the Infographic for PacifiCan on GC Infobase offers more financial information from previous years.
Table 8: Planned three-year spending on core responsibilities and internal services (dollars)
Table 8 shows PacifiCan’s planned spending for each of the next three years on its core responsibilities and on internal services.
| Core responsibilities and internal services | 2025–26 planned spending | 2026–27 planned spending | 2027–28 planned spending |
|---|---|---|---|
| Economic Development in British Columbia | $130,927,630 | $116,011,959 | $111,256,633 |
| Internal services | $9,363,663 | $8,637,511 | $8,627,297 |
| Total | $140,291,293 | $124,649,470 | $119,883,930 |
Analysis of the next three years of spending
The decrease in the next three years planned spending is mostly due to the conclusion of time-limited programs including RHII and TGP.
The Finances section of the Infographic for PacifiCan on GC Infobase offers more detailed financial information related to future years.
Funding
This section provides an overview of the department's voted and statutory funding for its core responsibilities and for internal services. Consult the Government of Canada budgets and expenditures for further information on funding authorities.
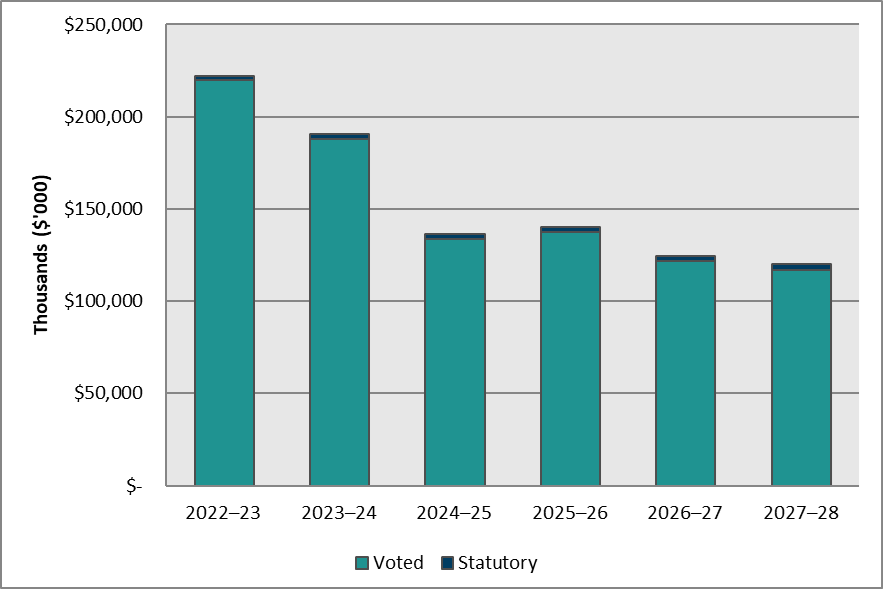
Graph 1: Approved funding (statutory and voted) over a six-year period
Graph 1 summarizes the department's approved voted and statutory funding from 2022-23 to 2027-28.
Text version of graph 1
Graph 1: Approved funding (statutory and voted) over a six-year period
| Fiscal year | Statutory Thousands ($’000) |
Voted Thousands ($’000) |
Total Thousands ($’000) |
|---|---|---|---|
| 2022-23 | 2,206 | 219,877 | 222,083 |
| 2023-24 | 2,904 | 187,806 | 190,710 |
| 2024-25 | 2,981 | 133,568 | 136,549 |
| 2025-26 | 3,082 | 137,209 | 140,291 |
| 2026-27 | 2,810 | 121,840 | 124,650 |
| 2027-28 | 2,813 | 117,071 | 119,884 |
Analysis of statutory and voted funding over a six-year period
The overall decrease in PacifiCan’s voted funding from 2023-24 to 2024-25 is attributed to the conclusion of the time-limited programs announced in Budget 2021, which included ARRI, CCRF, JGF, and TRF. The downward trend from 2025-26 to 2027-28 continues, primarily due to a decrease in REGI funding and the sun-setting of the time-limited initiatives of RHII and TGP.
Consult the Public Accounts of Canada for further information on PacifiCan’s departmental voted and statutory expenditures.
Financial statement highlights
PacifiCan’s Financial Statements (Unaudited) for the Year Ended March 31, 2025.
Table 9: Condensed Statement of Operations (unaudited) for the year ended March 31, 2025 (dollars)
Table 9 summarizes the expenses and revenues for 2024–25 which net to the cost of operations before government funding and transfers.
| Financial information | 2024–25 actual results | 2024–25 planned results | Difference (actual results minus planned) |
|---|---|---|---|
| Total expenses | $90,754,116 | $86,172,832 | $4,581,284 |
| Total revenues | $0 | $65 | $(65) |
| Net cost of operations before government funding and transfers | $90,754,116 | $86,172,767 | $4,581,349 |
Analysis of expenses and revenues for 2024-25
The $4.6 million increase between the 2024-25 planned results and the 2024-25 actuals is primarily attributable to time-limited initiatives announced in 2024-25, such as Regional Artificial Intelligence Initiative (RAI) and RHII, as well as salary expenses incurred as part of PacifiCan’s transition to a fully operating Regional Development Agency.
The 2024–25 planned results information is provided in PacifiCan’s Future-Oriented Statement of Operations and Notes 2024–25.
Table 10: Condensed Statement of Operations (unaudited) for 2023-24 and 2024-25 (dollars)
Table 10 summarizes actual expenses and revenues and shows the net cost of operations before government funding and transfers.
| Financial information | 2024–25 actual results | 2023–24 actual results | Difference (2024-25 minus 2023-24) |
|---|---|---|---|
| Total expenses | $90,754,116 | $124,251,022 | ($33,496,906) |
| Total revenues | $0 | $0 | $0 |
| Net cost of operations before government funding and transfers | $90,754,116 | $124,251,022 | ($33,496,906) |
Analysis of differences in expenses and revenues between 2023-24 and 2024-25
Total expenses were $90.8 million in 2024-25, a net decrease of $33.5 million over 2023-24. This year-over-year net decrease is attributed primarily to the conclusion of Budget 2021 programs, such as the CCRF, the TRF, the ARRI, and ongoing fund for the Regional Economic Growth through Innovation; offset by increased in operating expenses, transfer payment expenses under the Western Diversification Program, and economic recovery programming for the Village of Lytton.
Table 11: Condensed Statement of Financial Position (unaudited) as at March 31, 2025 (dollars)
Table 11 provides a brief snapshot of the amounts the department owes or must spend (liabilities) and its available resources (assets), which helps to indicate its ability to carry out programs and services.
| Financial information | Actual fiscal year (2024–25) | Previous fiscal year (2023–24) | Difference (2024–25 minus 2023–24) |
|---|---|---|---|
| Total net liabilities | $54,909,764 | $79,191,483 | ($24,281,719) |
| Total net financial assets | $53,217,347 | $77,765,471 | ($24,548,124) |
| Departmental net debt | $1,692,417 | $1,426,012 | $266,405 |
| Total non-financial assets | $24,536 | $77,499 | ($52,963) |
| Departmental net financial position | ($1,667,881) | ($1,348,513) | ($319,368) |
Analysis of department’s liabilities and assets since last fiscal year
Total net liabilities were $54.9 million in 2024–25, a net decrease of $24.3 million over 2023-24. This year-over-year net decrease is attributed to: (i) reduction in accounts payable associated with the Business Scale-up and Productivity and time-limited programs announced in Budget 2021, such as the ARRI, the CCRF, the Jobs and Growth Fund (JGI), and the TRF; and (ii) the establishment of accounts payable balances for the RAI, the Regional Innovation Ecosystem (RIE) program, and the TGP.
Total net financial assets were $53.2 million in 2024-25, a decrease of $24.5 million year over year. The decrease in the net financial assets is primarily due to lower amounts due from the consolidated revenue fund. This asset account represents the agency’s access to the consolidated revenue fund for discharging its liabilities, and this amount has decreased proportionately with the decrease in accounts payable.
Human resources
This section presents an overview of the department’s actual and planned human resources from 2022–23 to 2027–28.
Table 12: Actual human resources for core responsibilities and internal services
Table 12 shows a summary in full-time equivalents of human resources for PacifiCan’s core responsibilities and for its internal services for the previous three fiscal years.
| Core responsibilities and internal services | 2022–23 actual FTEs | 2023–24 actual FTEs | 2024–25 actual FTEs |
|---|---|---|---|
| Economic Development in British Columbia | 123 | 140 | 130 |
| Internal services | 41 | 51 | 57 |
| Total | 164 | 191 | 187 |
Analysis of human resources over the last three years
The decrease in FTEs from 2023-24 to 2024-25 is attributed to the conclusion of the time-limited programs announced in Budget 2021, which included ARRI, CCRF, JGF, and TRF.
Table 13: Human resources planning summary for core responsibilities and internal services
Table 13 shows the planned full-time equivalents for each of PacifiCan’s core responsibilities and for its internal services for the next three years. Human resources for the current fiscal year are forecast based on year to date.
| Core responsibilities and internal services | 2025–26 planned FTEs | 2026–27 planned FTEs | 2027–28 planned FTEs |
|---|---|---|---|
| Economic Development in British Columbia | 132 | 123 | 123 |
| Internal services | 58 | 55 | 55 |
| Total | 190 | 178 | 178 |
Analysis of human resources for the next three years
The overall decrease in FTEs from 2025-26 to 2027-28 is due to the conclusion of time-limited programs, including RHII and TGP.
Supplementary information tables
The following supplementary information tables are available on PacifiCan’s website:
- Details on transfer payment programs
- Gender‑based analysis plus
- Response to Parliamentary committees and external audits
Federal tax expenditures
The tax system can be used to achieve public policy objectives through the application of special measures such as low tax rates, exemptions, deductions, deferrals and credits. The Department of Finance Canada publishes cost estimates and projections for these measures each year in the Report on Federal Tax Expenditures. This report also provides detailed background information on tax expenditures, including descriptions, objectives, historical information and references to related federal spending programs as well as evaluations and GBA Plus of tax expenditures.
Corporate information
Departmental profile
Appropriate minister(s): The Honourable Gregor Robertson
Institutional head: Naina Sloan
Ministerial portfolio: Housing and Infrastructure and Pacific Economic Development Canada
Enabling instrument(s): Western Economic Diversification Act, R.S.C. 1985, C. 11, (4th Supplement), Order in Council P.C. 2021-0828
Year of incorporation / commencement: 2021
Other:
Offices – Surrey, Vancouver, Victoria, Kelowna, Prince George, Cranbrook, Fort St. John, Prince Rupert and Campbell River, British Columbia. Ottawa, Ontario.
Headquarters – Surrey, British Columbia
Departmental contact information
Mailing address:
Pacific Economic Development Canada
13401 108 Ave, 5th Floor
Surrey, British Columbia, V3T 5T3
Telephone: 604-666-6256
TTY: 1-877-303-3388
Fax: 604-666-2353
Email: info@pacifican.gc.ca
Website(s): https://www.canada.ca/en/pacific-economic-development.html
Definitions
List of terms
- appropriation
- Any authority of Parliament to pay money out of the Consolidated Revenue Fund.
- budgetary expenditures
- Operating and capital expenditures; transfer payments to other levels of government, departments or individuals; and payments to Crown corporations.
- core responsibility
- An enduring function or role of a department. The departmental results listed for a core responsibility reflect the outcomes that the department seeks to influence or achieve.
- Departmental Plan
- A report that outlines the anticipated activities and expected performance of an appropriated department over a 3-year period. Departmental Plans are usually tabled in Parliament in spring.
- departmental priority
- A plan, project or activity that a department focuses and reports on during a specific planning period. Priorities represent the most important things to be done or those to be addressed first to help achieve the desired departmental results.
- departmental result
- A high-level outcome related to the core responsibilities of a department.
- departmental result indicator
- A quantitative or qualitative measure that assesses progress toward a departmental result.
- departmental results framework
- A framework that connects the department’s core responsibilities to its departmental results and departmental result indicators.
- Departmental Results Report
- A report outlining a department’s accomplishments against the plans, priorities and expected results set out in the corresponding Departmental Plan.
- fulltime equivalent
- Measures the person years in a departmental budget. An employee's scheduled hours per week divided by the employer's hours for a full-time workweek calculates a full-time equivalent. For example, an employee who works 20 hours in a 40-hour standard workweek represents a 0.5 full-time equivalent.
- gender-based analysis plus (GBA plus)
- An analytical tool that helps to understand the ways diverse individuals experience policies, programs and other initiatives. Applying GBA Plus to policies, programs and other initiatives helps to identify the different needs of the people affected, the ways to be more responsive and inclusive, and the methods to anticipate and mitigate potential barriers to accessing or benefitting from the initiative. GBA Plus goes beyond biological (sex) and socio-cultural (gender) differences to consider other factors, such as age, disability, education, ethnicity, economic status, geography (including rurality), language, race, religion, and sexual orientation.
- government-wide priorities
- For the purpose of the 2024–25 Departmental Results Report, government priorities are the high-level themes outlining the government’s agenda as announced in the 2021 Speech from the Throne.
- horizontal initiative
- A program, project or other initiative where two or more federal departments receive funding to work collaboratively on a shared outcome usually linked to a government priority, and where the ministers involved agree to designate it as horizontal. Specific reporting requirements apply, including that the lead department must report on combined expenditures and results.
- Indigenous business
- For the purposes of a Departmental Result Report, this includes any entity that meets the Indigenous Services Canada’s criteria of being owned and operated by Elders, band and tribal councils, registered in the Indigenous Business Directory or registered on a modern treaty beneficiary business list.
- non‑budgetary expenditures
- Net outlays and receipts related to loans, investments and advances, which change the composition of the financial assets of the Government of Canada.
- performance
- What a department did with its resources to achieve its results, how well those results compare to what the department intended to achieve, and how well lessons learned have been identified.
- performance indicator
- A qualitative or quantitative measure that assesses progress toward a departmental-level or program-level result, or the expected outputs or outcomes of a program, policy or initiative.
- plan
- The articulation of strategic choices, which provides information on how a department intends to achieve its priorities and associated results. Generally, a plan will explain the logic behind the strategies chosen and tend to focus on actions that lead to the expected result.
- planned spending
For Departmental Plans and Departmental Results Reports, planned spending refers to the amounts presented in Main Estimates. Departments must determine their planned spending and be able to defend the financial numbers presented in their Departmental Plans and Departmental Results Reports.
- program
- An Individual, group, or combination of services and activities managed together within a department and focused on a specific set of outputs, outcomes or service levels.
- program inventory
- A listing that identifies all the department’s programs and the resources that contribute to delivering on the department’s core responsibilities and achieving its results.
- result
- An outcome or output related to the activities of a department, policy, program or initiative.
- statutory expenditures
- Spending approved through legislation passed in Parliament, other than appropriation acts. The legislation sets out the purpose and the terms and conditions of the expenditures.
- target
- A quantitative or qualitative, measurable goal that a department, program or initiative plans to achieve within a specified time period.
- voted expenditures
- Spending approved annually through an appropriation act passed in Parliament. The vote also outlines the conditions that govern the spending.