
Meds Entry Watch, 6th Edition
ISSN 2560-6204
Cat. No.: H79-12E-PDF
April 2022
PDF - 592 KB
Previous edition
Full list of analytical studies
New Medicines Approved in 2020
New Medicines Approved in 2019
New Medicines Approved in 2018
New Medicines Approved in 2017
New Medicines Approved in 2016
Table of Contents
Acknowledgements
This report was prepared by the Patented Medicine Prices Review Board (PMPRB) as part of the National Prescription Drug Utilization Information System (NPDUIS) initiative.
The PMPRB wishes to acknowledge and thank the members of the NPDUIS Advisory Committee for their expert oversight and guidance in the preparation of this report. Please note that the statements, findings, and conclusions do not necessarily reflect those of the members or their organizations.
Appreciation goes to Blake Wladyka for leading this analytical project, as well as to Tanya Potashnik, Brian O’Shea, and Jeffrey Menzies for their oversight in the development of the report. The PMPRB also wishes to acknowledge the contributions of the analytical staff Étienne Gaudette and Jihong Yang and the editorial staff Sarah Parker and Laura Fortune.
Disclaimer
NPDUIS operates independently of the regulatory activities of the Board of the PMPRB. The research priorities, data, statements, and opinions expressed or reflected in NPDUIS reports do not represent the position of the PMPRB with respect to any regulatory matter. NPDUIS reports do not contain information that is confidential or privileged under sections 87 and 88 of the Patent Act, and the mention of a medicine in an NPDUIS report is not and should not be understood as an admission or denial that the medicine is subject to filings under sections 80, 81, or 82 of the Patent Act or that its price is or is not excessive under section 85 of the Patent Act.
Although this information is based in part on data obtained under license from the MIDAS® Database proprietary to IQVIA Solutions Canada Inc. and/or its affiliates (“IQVIA”), the statements, findings, conclusions, views, and opinions expressed in this report are exclusively those of the PMPRB and are not attributable to IQVIA.
Contact Information
Patented Medicine Prices Review Board
Standard Life Centre
Box L40
333 Laurier Avenue West
Suite 1400
Ottawa, ON K1P 1C1
Tel.: 1-877-861-2350
TTY 613-288-9654
Email: PMPRB.Information-Renseignements.CEPMB@pmprb-cepmb.gc.ca
Executive Summary
This is the sixth edition of the PMPRB’s Meds Entry Watch report, which explores the market entry of new medicines in Canada and other countries. Building on a retrospective analysis of trends since 2016, this report focuses on medicines that received first-time market approval through the US Food and Drug Administration (FDA), the European Medicines Agency (EMA), and/or Health Canada in 2019 and 2020, and analyzes their uptake, pricing, sales, and availability as of the last quarter of 2020 (Q4-2020).
In addition to the international analysis, a Canadian-focused section provides information on medicines that received their first Health Canada approval in 2019, as well as a retrospective review of annual marketing rates over the past five years.
This publication informs decision makers, researchers, and patients of the evolving market dynamics of emerging therapies in Canadian and international pharmaceutical markets.
The IQVIA MIDAS® Database was the primary source for the sales and list prices of new medicines in Canadian and international markets, as well as for the quantity sold.
International markets examined include the Organisation for Economic Co-operation and Development (OECD) members, with a focus on Australia, Belgium, France, Germany, Italy, Japan, the Netherlands, Norway, Spain, Sweden, and the United Kingdom (UK), which will comprise the PMPRB11 comparator countries. Where appropriate, the United States (US) is included to provide additional context.
Key Findings
A) Trends in New Medicine Approvals, 2015 to 2020
An average of 45 new medicines were approved each year from 2015 to 2020, with orphan and oncology medicines making up a significant portion of new approvals.
- Across Canada, US, and Europe, 50 new medicines were approved in 2020, up slightly from 47 in 2019.
- Orphan and oncology shares of new approvals have fluctuated over the past five years, averaging 50% and 28%, respectively.
A considerable portion of the new medicines approved internationally between 2015 and 2019 had Canadian sales by the end of 2020.
- New medicines approved between 2015 and 2019 accounted for approximately 15% of brand-name medicine sales in Canada in Q4-2020.
- There were sales in Canada for 37% of these medicines by the end of 2020, placing Canada ahead of the OECD median of 32%.
- New medicines with Canadian sales accounted for 85% of all new medicine sales in the OECD in Q4-2020, indicating that the higher-selling medicines continue to be among those approved and sold in Canada.
Canada outpaced the PMPRB11 median in terms of the number of new medicines sold within one year of their first international approval.
- Canada had recorded sales for 30% of 2015 to 2019 new medicines within the calendar year following first international approval, placing it fifth among the PMPRB11 countries.
- Over this five-year period, the share of new medicines approved and sold in Canada by the end of the following calendar year fluctuated from a high of 38% in 2017 to a low of 22% in 2018.
B) 2019 New Medicine Approvals
Forty-seven new medicines were approved in 2019, more than half of which had high treatment costs.
- 47 new medicines received market approval through the FDA, the EMA, and/or Health Canada in 2019.
- 40% of the 2019 new medicines received an orphan designation from the FDA and/or the EMA, while 23% were indicated for the treatment of cancer.
- Over 60% of new medicines with sales had high treatment costs: 10 oncology medicines had costs exceeding $5,000 per 28-day cycle and 16 non-oncology medicines had annual costs exceeding $10,000.
Fewer new medicines were approved by Health Canada than by the FDA and EMA, although Canada performed better than the OECD median and most PMPRB11 countries in terms of the number of new medicines with sales.
- 19 of the 47 new medicines first approved in 2019 had market authorization in Canada by Q4-2020, compared to 44 approved by the FDA and 24 by the EMA.
- Of the 19 approved medicines, 11 had recorded sales in Canada by the end of 2020, placing Canada third in the PMPRB11 countries and fifth in the OECD and third in the PMPRB11 countries for the number of new medicines with sales—an improved standing over previous years.
- Medicines approved and sold in Canada by Q4-2020 represented 49% of all new medicines sales in the OECD. This share is in line with comparator countries but lower than in previous years, due in large part to a later approval date for the top-selling 2019 medicine elexacaftor (Trikafta).
Sales for 2019 new medicines were highly concentrated, with two medicines accounting for almost 50% of OECD revenues for new approvals in the last quarter of 2020.
- Respiratory system products were the top-selling therapeutic class with 25% of OECD new medicines sales in Q4-2020, represented exclusively by the new medicine elexacaftor (Trikafta), which is used in the treatment of cystic fibrosis.
- Nonsteroidal products for anti-inflammatory skin disorders, represented by the plaque psoriasis treatment risankizumab (Skyrizi), accounted for approximately 23% of new medicine sales in the OECD. Risankizumab was also one of the most widely marketed new medicines, with sales in Canada, the US, and 10 of the PMPRB11 countries.
C) 2020 New Medicine Approvals
While the number of new medicines approved in 2020 was similar to 2019, the share of oncology and orphan medicines was notably higher.
- 50 new medicines received market approval through the FDA, the EMA, and/or Health Canada in 2020. Of these, 19 were approved in Canada by the third quarter of 2020.
- In total, 58% (29) of the new medicines received an orphan designation from the FDA and/or the EMA while oncology treatments accounted for 34% (19) of the 2020 new medicines.
- Of the 32 medicines with sales by Q4-2020, 24 (75%) had treatment costs exceeding $10,000 per year or $5,000 per 28-day course.
D) Spotlight on Canada
Canada approved 34 new medicines in 2019, including many of the international top-sellers from the same year.
- 34 new-to-Canada medicines were approved for market in 2019, of which 20 had reported sales by Q4-2020.
- Almost half (16) of the 2019 Canadian approvals were indicated to treat cancer.
- Three of the five international top-selling new medicines in 2019 received approval and had sales in Canada in the same year, including risankizumab (Skyrizi), which represented 45% of all 2019 new-to-Canada medicine sales in Q4-2020.
- From 2016 to 2020, between 82% and 95% of medicines approved in Canada had sales by the end of the following calendar year.
Introduction
Meds Entry Watch is an annual PMPRB publication that explores the dynamics of new medicines entering Canadian and international markets, providing information on their availability, sales, and prices.
This report builds on the five previous editions to provide a broad analysis of medicines that have received market approval since 2015, with a special focus on medicines approved in 2019 and 2020. New medicines are identified for each year based on the date of their first market authorization by the US Food and Drug Administration (FDA), the European Medicines Agency (EMA), and/or Health Canada.
The report consists of four main sections: Section A provides an overview of trends from 2015 to 2020; Section B focuses on new medicines that received international market approval in 2019; Section C presents a preliminary analysis of the new medicines approved internationally in 2020; and Section D spotlights Health Canada approvals in 2019.
This publication informs decision makers, researchers, and patients of emerging therapies in Canadian and international pharmaceutical markets.
Methods
This report analyzes new medicines that received first-time market approval from the FDA, the EMA, and/or Health Canada since 2015, with a focus on those approved in 2019 and 2020. A new medicine is selected for analysis if it received market authorization from any of these regulatory bodies during the calendar year for the first time, even if it was not yet listed for reimbursement or if there were no recorded sales in the available source data. For the purposes of this analysis, new medicines are identified at the medicinal ingredient level.
Using these criteria, 222 new medicines were identified as new approvals between 2015 and 2019, including the 47 new approvals in 2019 analyzed in Section B, and 50 medicines identified for the preliminary analysis in 2020 and presented in Section C. The approval of these medicines in Canadian and international markets was assessed as of the end of 2020 and the third quarter of 2021 (Q3-2021).
The selection of medicines featured in the analysis of the Canadian market in Section D differs from the previous sections. Medicines analyzed in Section D include new and previously marketed medicinal ingredients that received their first Canadian market authorization through Health Canada in 2019. This includes a number of medicines in the 2019 analysis in Section B, but also encompasses additional medicines that may have received initial approval through the FDA or EMA in previous years but were first approved for the Canadian market in 2019. Marketed status for Canadian approvals was sourced from Health Canada’s Drug Product Database.
International markets examined include the Organisation for Economic Co-operation and Development (OECD) countries, with a focus on Australia, Belgium, France, Germany, Italy, Japan, the Netherlands, Norway, Spain, Sweden, and the United Kingdom (UK), which will comprise the 11 PMPRB Schedule Countries (“PMPRB11”) specified in the amended Patented Medicines Regulations, which are scheduled to come into force on July 1, 2022. Results for the United States (US) are also provided for comparison purposes.
The IQVIA MIDAS® Database (all rights reserved) is the main data source for the sales and list prices of new medicines in Canadian and international markets, as well as the volume of units sold. MIDAS data reflects the national retail and hospital sectors for each country, including all sales (public, private, and out-of-pocket). Sales and volume data encompass all versions of a medicine available in a particular country, produced by any manufacturer in any strength and form. For more information on the MIDAS Database and other NPDUIS source materials, see the Resources section of the Analytical Studies page on the PMPRB website.
Canadian prices are based on MIDAS data, if available; otherwise, they are derived from publicly available results of the Reimbursement Review reports published by the Canadian Agency for Drugs and Technologies in Health (CADTH). Treatment costs are calculated using Canadian list prices where possible; if not, the foreign median price is used. Information on dosing regimens is taken from the product monographs published by Health Canada, or if not available, from the FDA or EMA. All medicines were reviewed as of Q3-2021, unless otherwise specified.
Prices and foreign-to-Canadian price ratios are reported for the highest-selling form and strength of each medicine in Canada, or in the PMPRB11 if no Canadian sales were available at the time of the analysis. The foreign-to-Canadian price ratios presented in this report are expressed as an index with the Canadian price set to a value of one and the international median reported relative to this value. For more details on how foreign-to-Canadian price ratios are calculated, see the Resources section of the Analytical Studies page on the PMPRB website.
Prices and sales in foreign currencies are converted into Canadian dollars using the 12-month or 3-month average exchange rate for the year or quarter, respectively.Limitations
New medicines reported in Sections A, B, and C are selected for analysis based on their date of market approval by the FDA, the EMA, and/or Health Canada. Some of the medicines reported may have earlier approval dates in other countries, such as Australia and Japan, which are governed by other regulatory bodies. Likewise, the medicines included in this analysis do not necessarily represent all of those introduced in 2019 and 2020, as other national regulatory bodies not examined in this report may have approved additional medicines. Nevertheless, as the FDA and EMA represent significant international markets, this is estimated to have little effect on the overall results.
This report reflects the initial market penetration of these new medicines, and their availability and uptake are expected to increase in subsequent years. The availability of a new medicine in a given country at any point in time is influenced by a variety of factors including the manufacturer’s business decision to launch, as well as the timing of that decision; the regulatory approval process in place; and the existing market dynamics.
Market approval through the EMA does not necessarily mean that the medicine is available in any European country. Likewise, medicines approved through the FDA or Health Canada may not necessarily be marketed, reimbursed, and/or have any recorded sales.
Some medicines with sales may not be reported in the IQVIA MIDAS® Database, and thus, the sales of new medicines may be slightly under-reported. However, as the effect is expected to be approximately consistent across all markets, this should not have an impact on the overall findings.
Canadian and international sales and prices are based on manufacturer list prices as reported in the MIDAS Database, and do not capture price rebates, managed entry agreements (also known as product listing agreements), dispensing fees, or patient access schemes. The methodology used by MIDAS for estimating prices varies by country and data availability.
Publicly available prices from the Canadian Agency for Drugs and Technologies in Health (CADTH) are based on the manufacturers’ submitted list prices, which may differ upon market entry.
Aggregated international sales and pricing data are skewed towards the United States and, as a result, the ranking of medicines by international sales generally reflects the order of sales in the US.
The assessment of medicine availability in Canada does not consider non-marketed medicines available through exceptional programs such as the Special Access Program in Canada (SAP).
A: Trends in New Medicine Approvals, 2015–2020
This section presents a five-year retrospective review of new medicine approvals and sales. It reports on the number of new medicines approved from 2015 to 2020 and tracks the progress of those approved from 2015 to 2019 through to the end of 2020. Sales and pricing information is reported as of Q4-2020.
Specialty medicines such as orphan and oncology treatments make up an important share of the new medicines approved over the past five years. Canada continues to be competitive in terms of the number of new medicines approved and sold domestically, ranking seventh among the PMPRB11 countries and tenth in the OECD. By the end of 2020, 15% of all brand-name sales in Canada were for medicines first approved by the US FDA, the EMA, or Health Canada between 2015 and 2019.
An average of 45 new medicines received first-time market approval through the FDA, the EMA, and/or Health Canada annually between 2015 and 2020 (Figure A1). In 2019, 47 new medicines were approved, of which over 40% (19) received an orphan designation for at least one indication from the FDA and/or EMA, and approximately one quarter (11) were indicated to treat cancer.
An additional 50 new medicines were approved in 2020, including greater shares of orphan and oncology treatments: orphan medicines accounted for 58% of new approvals while oncology medicines rose to 34%, the highest share since 2015.
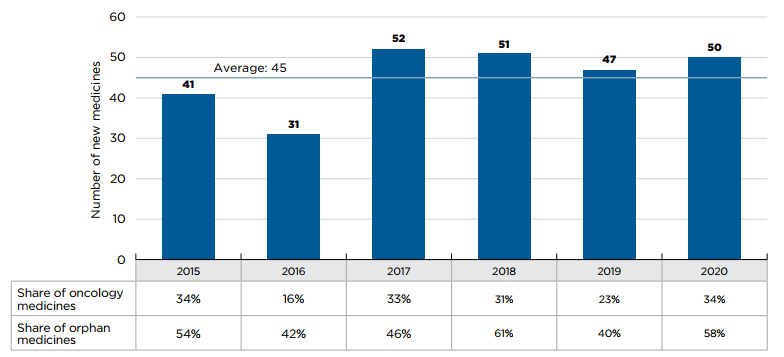
Figure description
This bar graph depicts the number of new medicines approved by the US Food and Drug Administration, the European Medicines Agency, and Health Canada from 2015 to 2020. A table shows the share of orphan and oncology medicines for each annual total. The average number of annual approvals for the period was 45.
| 2015 | 2016 | 2017 | 2018 | 2019 | 2020 | |
|---|---|---|---|---|---|---|
Number of new medicines |
41 |
31 |
52 |
51 |
47 |
50 |
Share of orphan medicines |
54% |
42% |
46% |
61% |
40% |
58% |
Share of oncology medicines |
34% |
16% |
33% |
31% |
23% |
34% |
Data source: US Food and Drug Administration, European Medicines Agency, and Health Canada databases.
Figure A2 illustrates the year-over-year uptake in sales for medicines first approved between 2015 and 2019. By Q4-2020, these medicines collectively accounted for 15.5% of the total brand-name pharmaceutical market in Canada and 14.4% of international sales. Medicines that were approved in 2019 represented 0.8% of all pharmaceutical sales in Canada and the PMPRB11.Footnote 1
In any given year, the impact of new medicines on pharmaceutical sales depends on their number, therapeutic relevance, and treatment costs. For example, direct-acting antiviral medicines approved in 2016 for the treatment of hepatitis C quickly gained large market shares by 2018, but have since started to decline, due in part to the curative nature of these treatments. By Q4-2020, the highest-selling new medicines in Canada were semaglutide, a diabetes medicine introduced in 2017, and palbociclib and daratumumab, two cancer medicines introduced in 2015.
Figure A2 New medicine cumulative share of all brand-name medicine sales by year of approval (2015 to 2019), Canada and the PMPRB11*

Figure description
This figure consists of two area graphs depicting the new medicine cumulative share of total brand-name medicine sales by year of approval between 2015 and 2019, tracking the percentage of new medicines in yearly sales up to the fourth quarter of 2020. New medicine share of sales for each year are also marked. The first graph is for both Canada and the eleven PMPRB comparator countries and the second is for Canada alone.
(a) Canada and the PMPRB11
| Year of approval | 2016 | 2017 | 2018 | 2019 | 2020 | Q4-2020 |
|---|---|---|---|---|---|---|
2015 |
0.8% |
2.0% |
3.4% |
4.7% |
5.5% |
5.6% |
2016 |
0.1% |
2.6% |
3.2% |
2.7% |
2.4% |
2.4% |
2017 |
0.0% |
0.2% |
2.0% |
2.7% |
3.7% |
4.0% |
2018 |
0.0% |
0.0% |
0.1% |
0.6% |
1.3% |
1.5% |
2019 |
0.0% |
0.0% |
0.0% |
0.2% |
0.6% |
0.8% |
New medicine share of sales |
0.9% |
4.8% |
8.8% |
10.9% |
13.5% |
14.4% |
(b) Canada
| Year of approval | 2016 | 2017 | 2018 | 2019 | 2020 | Q4-2020 |
|---|---|---|---|---|---|---|
2015 |
0.5% |
1.6% |
2.6% |
4.0% |
5.2% |
5.6% |
2016 |
0.2% |
3.6% |
4.9% |
3.9% |
2.4% |
2.0% |
2017 |
0.0% |
0.0% |
1.5% |
3.5% |
5.3% |
6.0% |
2018 |
0.0% |
0.0% |
0.0% |
0.4% |
1.2% |
1.4% |
2019 |
0.0% |
0.0% |
0.0% |
0.1% |
0.4% |
0.5% |
New medicine share of sales |
0.8% |
5.3% |
9.0% |
12.0% |
14.4% |
15.5% |
* Australia, Belgium, France, Germany, Italy, Japan, Netherlands, Norway, Spain, Sweden, and the United Kingdom.
Data source: IQVIA MIDAS® Database, 2020. All rights reserved.
Of the 222 medicines approved from 2015 to 2019, 83 (37%) had sales in Canada by Q4-2020 (Figure A3). While Canada’s proportion of new medicines with sales was higher than the OECD median of 32%, it ranked below the median of the PMPRB11 countries, many of which have lower average list prices for patented medicines than Canada (PMPRB 2021). The new medicines sold in Canada accounted for 85% of the OECD sales for all new medicines analyzed, representing the ninth-highest share in the OECD, well above the median of 76%. These findings are consistent with those observed in previous editions of Meds Entry Watch and continue to suggest that most of the top-selling new medicines in the OECD are being sold in Canada. Similar results have also been found in targeted analyses of the expensive drugs for rare diseases and oncology market segments (PMPRB 2020; 2022).
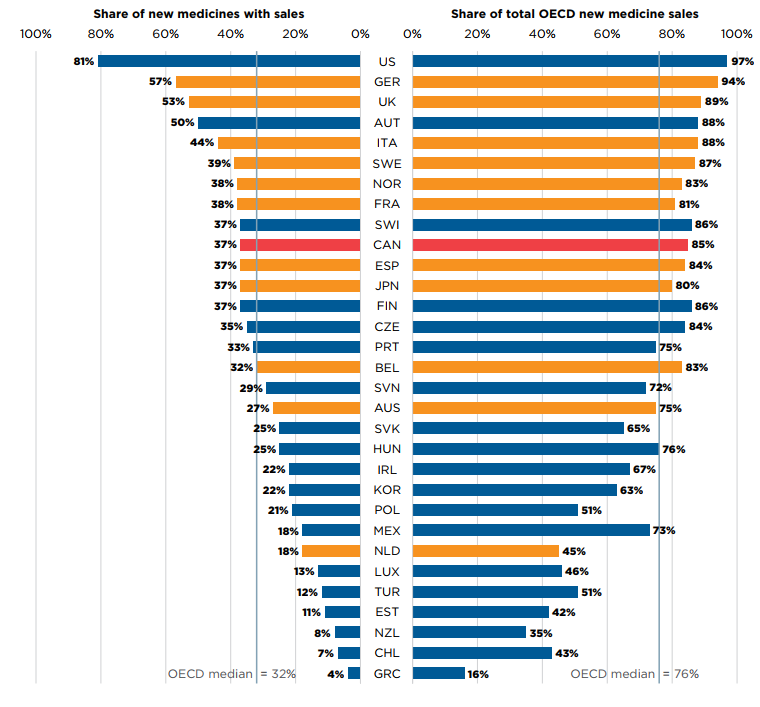
Figure description
This is a split bar graph. For each country in the Organisation for Economic Co-operation and Development, one side of the graph gives the market share of the new medicines launched in Canada and its eleven PMPRB comparator countries from 2015 to 2019. The other side gives the respective share of the Organisation for Economic Co-operation and Development sales in the fourth quarter of 2020. The Organisation for Economic Co-operation and Development median is shown for each side of the graph.
| Country | Share of new medicines with sales | Share of total Organisation for Economic Co-operation and Development new medicine sales |
|---|---|---|
United States |
81% |
97% |
Germany |
57% |
94% |
United Kingdom |
53% |
89% |
Austria |
50% |
88% |
Italy |
44% |
88% |
Sweden |
39% |
87% |
Norway |
38% |
83% |
France |
38% |
81% |
Switzerland |
37% |
86% |
Canada |
37% |
85% |
Spain |
37% |
84% |
Japan |
37% |
80% |
Finland |
37% |
86% |
Czechia |
35% |
84% |
Portugal |
33% |
75% |
Belgium |
32% |
83% |
Slovenia |
29% |
72% |
Australia |
27% |
75% |
Slovakia |
25% |
65% |
Hungary |
25% |
76% |
Ireland |
22% |
67% |
South Korea |
22% |
63% |
Poland |
21% |
51% |
Mexico |
18% |
73% |
Netherlands |
18% |
45% |
Luxembourg |
13% |
46% |
Turkey |
12% |
51% |
Estonia |
11% |
42% |
New Zealand |
8% |
35% |
Chile |
7% |
43% |
Greece |
4% |
16% |
OECD median |
32% |
76% |
Note: Sales are based on manufacturer list prices and include sales for all OECD countries.
* For the purposes of this analysis, new medicines were defined as those that received their first market authorization through the US Food and Drug Administration (FDA), the European Medicines Agency (EMA), or Health Canada.
Data source: IQVIA MIDAS® Database, 2020. All rights reserved.
While Figure A3 provides an overview of the current uptake for this basket of medicines, it does not provide a complete picture of the time-to-market for new medicines in Canadian and international markets. To explore this factor, Figure A4 uses a retrospective analysis to identify the number of new medicines that were approved and marketed in Canada and comparator countries by the end of the calendar year following their first international authorization.
Of the 222 new medicines first approved between 2015 and 2019, Canada had recorded sales for 66 (30%) within one year of their first international approval. Canada outperformed the PMPRB11 median of 62, ranking higher than France, Italy, Japan, the Netherlands, Spain, Belgium, and Australia.
The US was an outlier among the countries shown, having recorded sales for 182 (82%) of the new medicines within a one-year period. Of the PMPRB11 countries, only Germany marketed more than 100 new medicines within a one-year period.
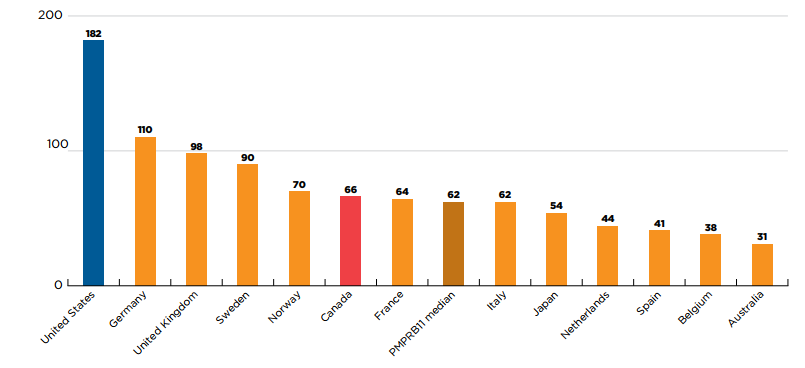
Figure description
This is a bar graph that gives the number of new medicines with sales within one year of their first international approval in Canada, the US, and each of the 11 PMPRB comparator countries. The median across the PMPRB11 countries was 62. For the purposes of this analysis, new medicines were defined as those that received their first market authorization through the US Food and Drug Administration (FDA), the European Medicines Agency (EMA), or Health Canada between 2015 and 2019. A medicine was considered to be marketed within a one-year period if it had sales before the end of the calendar year following its first international approval.
| Country | Number of new medicines with sales within one year |
|---|---|
United States |
182 |
Germany |
110 |
United Kingdom |
98 |
Sweden |
90 |
Norway |
70 |
Canada |
66 |
France |
64 |
Italy |
62 |
Japan |
54 |
Netherlands |
44 |
Spain |
41 |
Belgium |
38 |
Australia |
31 |
Note: A medicine was considered to be sold within a one-year period if it had sales before the end of the calendar year following its first international approval.
* For the purposes of this analysis, new medicines were defined as those that received their first market authorization through the US Food and Drug Administration (FDA), the European Medicines Agency (EMA), or Health Canada.
Data source: IQVIA MIDAS® Database, 2020. All rights reserved.
Figure A5(a) illustrates the percentage of new medicines approved and sold in Canada within one year of first international approval for each year from 2015 to 2019. The results indicate that Health Canada approved approximately half of 2015–2017 new medicines within a year of their international authorization, and closer to 40% of the medicines from 2018 and 2019. Previous editions of Meds Entry Watch have shown a similar decline in the proportion of medicines approved within one calendar year by the EMA during the same period.
Shares of new medicines with sales in Canada within the same period were approximately 15 percentage points lower than for approvals, fluctuating between a low of 22% to a high of 38%, for 2018 and 2017 new medicines, respectively.
These medicines accounted for a substantial proportion of the total sales for new medicines in the OECD. As shown in Figure A5(b), new medicines from 2015 to 2017 that were sold in Canada within one year of international approval represented 80% to 90% of OECD sales.
The share of sales declined for medicines approved in 2018 and 2019, falling to 75% and 49%, respectively. This dip is primarily attributable to differences in the marketing of Trikafta, which accounted for 25% of OECD sales of medicines approved in 2019 but was not approved in Canada until June 2021.
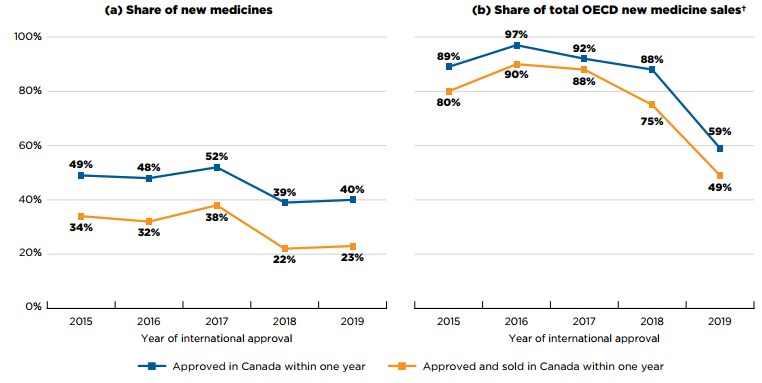
Figure description
This figure consists of two line graphs. The first gives the percentage of new medicines approved and sold in Canada within one year of their first international approval. The second gives the annual share of total new medicine sales in the Organisation for Economic Cooperation and Development countries that corresponds to these medicines.
Results for both graphs are given annually by the year the medicine received its first market authorization through the US Food and Drug Administration (FDA), the European Medicines Agency (EMA), or Health Canada from 2015 to 2019. A medicine was considered to be approved or marketed within a one-year period if its approval date or date of first sale fell before the end of the calendar year following its first international approval.
a) Share of new medicines
| Year of approval | Approved in Canada within one year | Approved and sold in Canada within one year |
|---|---|---|
2015 |
49% |
34% |
2016 |
48% |
32% |
2017 |
52% |
38% |
2018 |
39% |
22% |
2019 |
40% |
23% |
b) Share of total OECD new medicine sales
| Year of approval | Approved in Canada within one year | Approved and sold in Canada within one year |
|---|---|---|
2015 |
89% |
80% |
2016 |
97% |
90% |
2017 |
92% |
88% |
2018 |
88% |
75% |
2019 |
59% |
49% |
Note: A medicine was considered to be approved or sold within a one-year period if its approval date or date of first sale fell before the end of the calendar year following its first international approval.
* For the purposes of this analysis, new medicines were defined as those that received their first market authorization through the US Food and Drug Administration (FDA), the European Medicines Agency (EMA), or Health Canada between 2015 and 2019.
† Sales of new medicines by OECD countries in the fourth quarter of the calendar year following their first international approval.
Data source: IQVIA MIDAS® Database, 2020. All rights reserved.
B: New Medicine Approvals, 2019
This section reports on new medicines approved in 2019 and tracks their progress through the calendar year following approval. Sales and pricing data are provided as of Q4-2020, while assessments, recommendations, and reimbursement decisions are reported as of Q3-2021.
In addition to a slightly lower number of new approvals, 2019 brought a decrease in the number of orphan and oncology medicines authorized for market. Sales for 2019 new medicines were highly concentrated, with two medicines accounting for nearly half of revenues in the last quarter of 2020.
Forty-seven new medicines received their first market approval from Canada, Europe, and the US in 2019. By the end of 2020, 19 of these medicines had been approved by Health Canada, 24 by the EMA, and 44 by the US FDA (Figure B1).
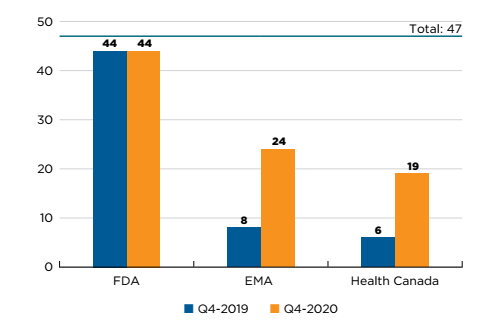
Figure description
This is a bar graph with the number of 2019 new medicines approved by Health Canada, the European Medicines Agency, and the US Food and Drug Administration as of the fourth quarter of 2019 and the fourth quarter of 2020. The total number of new medicines in 2019 was 47.
| US Food and Drug Administration | European Medicines Agency | Health Canada | |
|---|---|---|---|
Q4-2019 |
44 |
8 |
6 |
Q4-2020 |
44 |
24 |
19 |
Data source: US Food and Drug Administration (FDA), European Medicines Agency (EMA), and Health Canada databases.
Of the 19 medicines approved in Canada, 11 had sales data available in MIDAS by Q4-2020. This placed Canada fifth in the OECD and third in the PMPRB11 in terms of the number of new medicines sold. Despite Canada’s high number of approvals, its corresponding share of total new medicine sales was heavily influenced by the top-selling 2019 new medicine Trikafta, which accounted for 25% of OECD new medicine sales in Q4-2020 and was not approved in Canada until 2021. If Trikafta were omitted from the analysis, Canada’s total share of OECD new medicine sales would increase from 49% to 66%, compared to the OECD median of 36% and 48%, respectively.
These results reflect initial market penetration, and the availability and uptake in sales for these new medicines are expected to increase in subsequent years.
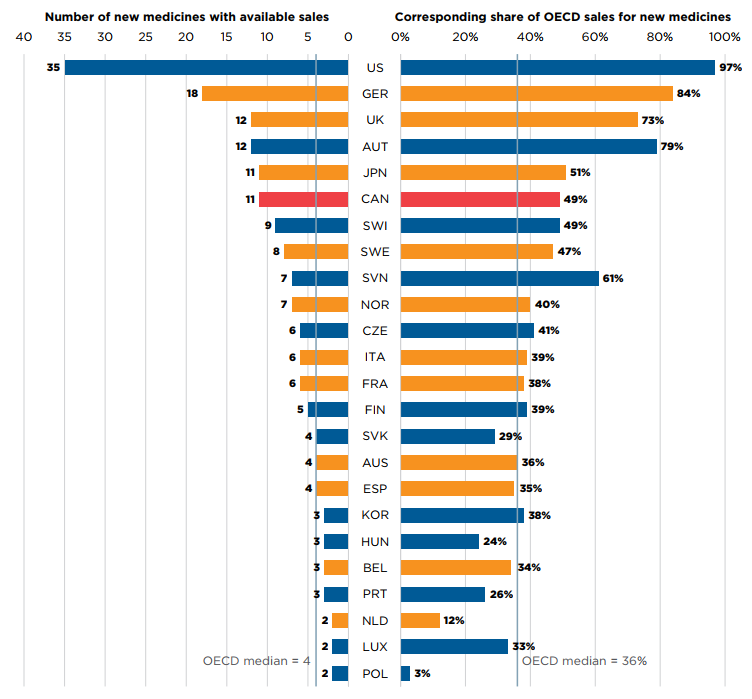
Figure description
This is a split bar graph showing the number of 2019 new medicines approved and with available sales as of the fourth quarter of 2020 and the corresponding share of 2020 fourth quarter sales in each of the Organisation for Economic Co-operation and Development countries. A median is given for each side of the graph.
| Country | Number of new medicines with available sales | Corresponding share of Organisation for Economic Co-operation and Development sales for new medicines |
|---|---|---|
United States |
35 |
97% |
Germany |
18 |
84% |
United Kingdom |
12 |
73% |
Austria |
12 |
79% |
Japan |
11 |
51% |
Canada |
11 |
49% |
Switzerland |
9 |
49% |
Sweden |
8 |
47% |
Slovenia |
7 |
61% |
Norway |
7 |
40% |
Czechia |
6 |
41% |
Italy |
6 |
39% |
France |
6 |
38% |
Finland |
5 |
39% |
Slovakia |
4 |
29% |
Australia |
4 |
36% |
Spain |
4 |
35% |
South Korea |
3 |
38% |
Hungary |
3 |
24% |
Belgium |
3 |
34% |
Portugal |
3 |
26% |
Netherlands |
2 |
12% |
Luxembourg |
2 |
33% |
Poland |
2 |
3% |
OECD median |
4 |
36% |
Note: Based on medicines that received market approval through the US Food and Drug Administration (FDA), the European Medicines Agency (EMA), and/or Health Canada in 2019 with recorded sales data as of Q4-2020.
Sales are based on manufacturer list prices and include sales for the selected new medicines in all OECD countries. The following countries did not register sales for any new medicines and have been omitted in the graph: Chile, Estonia, Greece, Ireland, Mexico, New Zealand, and Turkey. All countries were used to calculate the OECD median.
Data source: IQVIA MIDAS® Database, 2020 (all rights reserved); US Food and Drug Administration, European Medicines Agency, and Health Canada databases.
Table B1 lists the new medicines approved in 2019. For each medicine, the country with the first reported sales is given, along with the availability in Canada, the share of sales in Q4-2020, and the prices and corresponding treatment costs.Footnote 2 Prices are reported for the highest-selling form and strength of each medicine at the time of the analysis.
Antineoplastics continued to account for the greatest number of new medicines in 2019, with 10 medicines approved. Antivirals, which have been an important therapeutic class in recent years, only produced one new medicine in 2019 and had no reported sales. In total, the list of 2019 new medicines spanned 26 therapeutic classes.
Despite the range of therapeutic areas represented, sales for the 2019 new approvals were highly concentrated. The top three therapeutic classes, each represented by only one medicine, accounted for 60% of all new medicine sales across the OECD by Q4-2020 (Table B1).
Respiratory system products topped the list with one quarter (25%) of all sales, driven exclusively by Trikafta, a combination therapy treating cystic fibrosis. The therapy is a combination of three active ingredients: the 2012 medicine ivacaftor, the 2018 medicine tezacaftor, and the 2019 new medicine elexacaftor.
Nonsteroidal products for anti-inflammatory skin disorders followed with a 23% share of sales for risankizumab (Skyrizi), indicated for the treatment of plaque psoriasis. The strong sales of risankizumab may be attributed to its wide international market development, as it was sold in Canada, the US, and all but one PMPRB11 country by Q4-2020.
Musculo-skeletal medicines were the third highest-selling therapeutic class, driven solely by the rheumatoid arthritis treatment upadacitinib (Rinvoq). Upadacitinib was the only medicine to reach all 13 countries and was responsible for over 11% of sales by the end of 2020.
Despite having the greatest number of new medicines (10), antineoplastics collectively accounted for just 10% of new medicine sales. Analgesics ranked fifth among the top-selling therapeutic classes with 9% of the new medicine market, attributed to two new migraine treatments. Ubrogepant (Ubrelvy) was the strongest sales contributor in the class, with over 8% of 2019 new medicine sales.
In total, 40% (19) of the 2019 new medicines received an orphan designation from the FDA and/or the EMA. Approximately 23% (11) of new medicines were for the treatment of cancer and 30% (14) were biologics. There is a notable overlap between these categories, as illustrated in Figure B3.
Two gene therapies were approved in 2019. Onasemnogene abeparvovec (Zolgensma), an orphan medicines indicated for the treatment of spinal muscular atrophy, accounted for 2.6% of new medicine sales despite being sold in only one country. Betibeglogene autotemcel (Zynteglo), a treatment for beta thalassaemia first approved by the EMA, was among the seven new medicines that had not registered any sales in Q4-2020. Other medicines without recorded sales include diagnostic agents and vaccines, which are not always sold through conventional mechanisms and may be underreported by the data source.
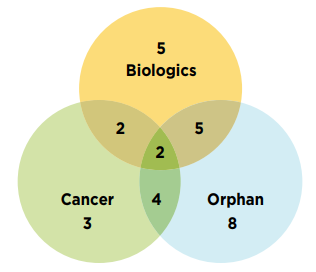
Figure description
This is a Venn diagram illustrating the overlap between orphan, biologic, and oncology treatments among the 2019 new medicines. Of the 47 new approvals, a total of 14 medicines were biologic, 19 had an orphan designation, and 11 were cancer medicines. Of these, five were both biologic and orphan, two were both biologic and oncological, four were both orphan and oncological, and two were biologic cancer medicines that also received an orphan designation.
Data source: US Food and Drug Administration, European Medicines Agency, and Health Canada databases.
Table B1 New medicines approved in 2019, availability, share of sales, prices, and treatment costs, ranked by therapeutic class share of sales, Q4-2020
| Rank | Therapeutic class* | Medicine (trade name, form, strength, volume) | Availability | Share of new medicine sales across the OECD | No. of countries with sales‡ | Canadian price (CAD) | PMPRB11 price (CAD) | US price (CAD) | Treatment cost | ||||||
|---|---|---|---|---|---|---|---|---|---|---|---|---|---|---|---|
| First sale in Canada, US, or PMPRB11† | First sale in Canada | Medicine | Therapeutic class | Min | Median | Max | Treatment cost (CAD) | Annual / Course | |||||||
1 |
R7-Other respiratory system products |
Elexacaftor (Trikafta, film-ctd tab, various strengths)O |
US |
Oct-19 |
– |
25% |
25% |
3 |
280 i |
– |
– |
– |
289 |
306,600 |
Annual |
2 |
D5-Nonsteroidal products for inflammatory skin |
Risankizumab (Skyrizi, prefill syrng sc, 90 mg/ml, 0.83 ml)B |
SWE/US |
Apr-19 |
May-19 |
23% |
23% |
12 |
2,540 |
1,984 |
2,387 |
3,088 |
7,140 |
24,675/ 21,385 |
First/subsequent years |
3 |
M1-musculo-skeletal system |
Upadacitinib (Rinvoq, film-ctd tab ret., 15 mg) |
US |
Aug-19 |
Jan-20 |
12% |
12% |
13 |
50 |
34 |
47 |
57 |
148 |
17,770 |
Annual |
4 |
L1-Antineoplastics |
Trastuzumab deruxtecan (Enhertu, infus. dry bottle, 100 mg)B,C |
US |
Dec-19 |
– |
3% |
10% |
2 |
– |
1,639 |
1,639 |
1,639 |
2,666 |
6,636 |
21-day cycle |
5 |
Alpelisib (Piqray, film-ctd tab, 300 mg)C |
US |
Jun-19 |
Jul-20 |
3% |
4 |
190 i |
– |
– |
– |
357 |
5,333 |
28-day cycle |
||
6 |
Polatuzumab vedotin (Polivy, infus. dry bottle, 140 mg)B,C,O |
US |
Jun-19 |
– |
2% |
6 |
14,750 i |
14,335 |
15,533 |
18,311 |
15,494 |
20,748 |
28-day course |
||
7 |
Fedratinib (Inrebic, capsule, 100 mg)C,O |
US |
Aug-19 |
– |
<1% |
1 |
84 i |
– |
– |
– |
200 |
121,819 |
Annual |
||
8 |
Erdafitinib (Balversa, film-ctd tab, 4 mg)C |
US |
Apr-19 |
Dec-19 |
<1% |
2 |
195 |
– |
– |
– |
464 |
8,190 |
21-day cycle |
||
9 |
Entrectinib (Rozlytrek, capsule, 200 mg)B,C,O |
US |
Aug-19 |
Jun-20 |
<1% |
7 |
99 |
71 |
85 |
136 |
222 |
8,008 |
28-day course |
||
10 |
Zanubrutinib (Brukinsa, capsule, 80 mg)C,O |
US |
Dec-19 |
– |
<1% |
1 |
– |
– |
– |
– |
125 |
99,324 |
Annual |
||
11 |
Pexidartinib (Turalio, capsule, 200 mg)C,O |
US |
Aug-19 |
– |
<1% |
1 |
– |
– |
– |
– |
180 |
15,120 |
21-day cycle |
||
12 |
Enfortumab vedotin (Padcev, infus. dry bottle, 30 mg)B,C |
US |
Dec-19 |
– |
<1% |
1 |
1,772 i |
– |
– |
– |
3,728 |
46,604 |
28-day cycle |
||
13 |
Selinexor (Xpovio, film-ctd tab, 20 mg)C,O |
US |
Jul-19 |
– |
<1% |
1 |
– |
– |
– |
– |
1,333 |
33,337 to 53,339 |
35-day cycle |
||
14 |
N2-Analgesics |
Ubrogepant (Ubrelvy, tab, 100 mg) |
US |
Jan-20 |
– |
9% |
9% |
1 |
– |
– |
– |
– |
105 |
53 to 210 |
Daily (acute) |
15 |
Lasmiditan (Reyvow, film-ctd tab, 100 mg) |
US |
Feb-20 |
– |
<1% |
1 |
– |
– |
– |
– |
100 |
50 to 200 |
Daily (acute) |
||
16 |
N7-Other central nervous system drugs |
Siponimod (Mayzent, film-ctd tab, 2 mg) |
US |
May-19 |
Apr-20 |
3% |
3% |
6 |
91 |
68 |
84 |
102 |
318 |
32,444/ 32,622 |
First/subsequent years |
17 |
Onasemnogene abeparvovec (Zolgensma, infus. vial/bottle, 16.5 ml)B,G,O |
US |
Jul-19 |
– |
3% |
1 |
2,910,500 i |
3,021,882 |
3,021,882 |
3,021,882 |
– |
2,910,500 |
One-time |
||
18 |
Solriamfetol (Sunosi, film-ctd tab, 150 mg)O |
US |
Jun-19 |
– |
1% |
4 |
– |
13 |
19 |
39 |
27 |
2,098 to 8,391 |
Annual |
||
19 |
M5-Other drugs for disorders of the musculo-skeletal |
Romosozumab (Evenity, prefill syrng sc, 90 mg/ml, 1.17 ml)B |
JPN |
Mar-19 |
Aug-19 |
5% |
5% |
6 |
336 |
– |
– |
– |
1,115 |
8,071 |
Annual |
20 |
Golodirsen (Vyondys 53, infus. vial/bottle, 50 mg/ml, 2 ml)O |
US |
Feb-20 |
– |
<1% |
1 |
– |
– |
– |
– |
1,799 |
1,122,576 |
Annual |
||
21 |
B3-Anti-anaemic preparations |
Luspatercept (Reblozyl, vial dry, 75 mg)B,O |
US |
Nov-19 |
– |
4% |
4% |
2 |
6,567 i |
6,889 |
6,889 |
6,889 |
12,350 |
113,828 to 151,771 |
Annual |
22 |
L2-Cytostatic hormone therapy |
Darolutamide (Nubeqa, film-ctd tab, 300 mg)C |
US |
Aug-19 |
Apr-20 |
2% |
2% |
7 |
28 |
23 |
45 |
54 |
114 |
3,174 |
28-day course |
23 |
S1-Ophthalmologicals |
Brolucizumab (Beovu, prefill syrng ophth., 120 mg/ml, 0.05 ml)B |
US |
Oct-19 |
May-20 |
2% |
2% |
8 |
1,497 |
1,417 |
1,417 |
1,417 |
223 |
8,508/ 6,672 |
First/subsequent years |
24 |
Brilliant blue G (TissueBlue, prefill syrng ophth., 250 mcg/ml, 0.5 ml)O |
US |
Jun-20 |
– |
<1% |
1 |
– |
– |
– |
– |
187 |
187 |
One-time |
||
25 |
B6-All other haematological agents |
Crizanlizumab (Adakveo, vial, 10 mg/ml, 10 ml)B,O |
US |
Nov-19 |
– |
1% |
1% |
2 |
– |
– |
– |
– |
2,608 |
127,160 |
Annual |
26 |
Givosiran (Givlaari, vial sc, 189 mg/ml, 1 ml)O |
FRA |
Mar-20 |
– |
<1% |
1 |
64,454 i |
71,451 |
71,451 |
71,451 |
– |
773,448 |
Annual |
||
27 |
Voxelotor (Oxbryta, film-ctd tab, 500 mg)O |
US |
Dec-19 |
– |
<1% |
1 |
– |
– |
– |
– |
130 |
142,335 |
Annual |
||
28 |
D10-Anti-acne preparations |
Trifarotene (Aklief, cream, 75 g) |
US |
Nov-19 |
Dec-19 |
1% |
1% |
8 |
2 |
1 |
1 |
1 |
– |
10 to 20 |
4- to 8-week treatment |
29 |
N4-Anti-parkinson drugs |
Istradefylline (Nouriast, film-ctd tab, 20 mg) |
JPN |
May-13 |
– |
1% |
1% |
2 |
– |
8 |
8 |
8 |
56 |
2,887 |
Annual |
30 |
B2-Blood coagulation system, other products |
Turoctocog alfa pegol (Esperoct, vial dry ret., 3000 IU)B |
SWE |
Jun-19 |
– |
1% |
1% |
8 |
– |
2,614 |
3,341 |
3,837 |
586,452 |
303,582 |
Annual (adult prophylaxis) |
31 |
N3-Anti-epileptics |
Cenobamate (Xcopri, film-ctd tab, 200 mg) |
US |
May-20 |
– |
1% |
1% |
1 |
– |
– |
– |
– |
40 |
12,555/ 14,427 |
First/subsequent years |
32 |
N5-Psycholeptics |
Lemborexant (Dayvigo, film-ctd tab, 5 mg) |
US |
May-20 |
– |
<1% |
<1% |
2 |
– |
1 |
1 |
1 |
11 |
329 |
Annual |
33 |
J1-Systemic antibacterials |
Cefiderocol (Fetroja, infus. dry bottle, 1 g) |
US |
Feb-20 |
– |
<1% |
<1% |
2 |
– |
– |
– |
– |
223 |
445 |
8-hour course (multiple may be required) |
34 |
Relebactam (Recarbrio, infus. dry bottle, 500 mg + 500 mg + 250 mg) |
US |
Jan-20 |
– |
<1% |
1 |
– |
– |
– |
– |
349 |
1,395 |
Daily |
||
35 |
Lefamulin (Xenleta, film-ctd tab, 600 mg) |
US |
Sep-19 |
– |
<1% |
1 |
– |
– |
– |
– |
164 |
1,640 |
5-day course |
||
36 |
C10-Lipid-regulating/anti-atheroma preparations |
Volanesorsen (Waylivra, prefill syrng sc, 190 mg/ml, 1.5 ml)O |
FRA |
Jun-19 |
– |
<1% |
<1% |
2 |
– |
– |
16,314 |
27,131 |
– | 522,032 |
Annual |
37 |
N6-Psychoanaleptics excluding anti-obesity preparations |
Brexanolone (Zulresso, infus. vial/bottle, 5 mg/ml, 20 ml) |
US |
Jul-19 |
– |
<1% |
<1% |
1 |
– |
– |
– |
– |
9,559 |
30,110 |
60-hour course |
38 |
J4-Antimycobacterials |
Pretomanid (Pretomanid, tab, 200 mg)O |
US |
Jun-20 |
– |
<1% |
<1% |
1 |
– |
– |
– |
– |
22 |
578 |
26-week course |
39 |
A6-Drugs for constipation and bowel cleansers |
Tenapanor (Ibsrela, tab, 50 mg) |
CAN |
Nov-20 |
Nov-20 |
<1% |
<1% |
1 |
3 |
– |
– |
– |
– |
2,178 |
Annual |
40 |
G2-Other gynaecologicals |
Bremelanotide (Vyleesi, prefill autoinj., 5.8 mg/ml, 0.3 ml) |
US |
Aug-19 |
– |
<1% |
<1% |
1 |
– |
– |
– |
– |
208 |
19,952 |
Annual (max dose) |
Medicines without sales data in MIDAS® as of Q4-2020 – date of approval by FDA, EMA, and/or Health Canada.
| Rank | Therapeutic class* | Medicine (trade name, form, strength, volume) | Date of approval by FDA, EMA, and/or Health Canada | |
|---|---|---|---|---|
41 |
Not assigned as of Q3-2021 |
Air polymer-type A (ExEm Foam) |
FDA |
Nov-19 |
42 |
B06-Other haematological agents |
Betibeglogene autotemcel (Zynteglo)B,G |
EMA |
May-19 |
43 |
J07-Vaccines |
Ebola Zaire vaccine (Ervebo)B,O |
EMA |
Dec-19 |
44 |
V09- Diagnostic radiopharaceuticals |
Fluorodopa F-18 |
FDA |
Oct-19 |
45 |
Not assigned as of Q3-2021 |
Lumateperone tosylate (Caplyta) |
FDA |
Dec-19 |
46 |
A10-Drugs used in diabetes |
Sotagliflozin (Zynquista) |
EMA |
Apr-19 |
47 |
J05-Antivirals for systemic use |
Modified vaccinia Ankara (Jynneos) B |
FDA |
Sep-19 |
Note: A medicine was considered to be new in 2019 if it received initial market authorization through the US Food and Drug Administration (FDA), the European Medicines Agency (EMA), and/or Health Canada during the calendar year.
Availability and sales information refer to all forms and strengths of the medicine, while pricing and treatment costs are based on the highest-selling form and strength indicated. Sales are based on manufacturer list prices.
Specialty medicines are indicated using the following abbreviations: B: biologic; C: cancer; G: gene therapy; O: orphan.
* Level 2 of the Anatomical Classification of Pharmaceutical Products, as reported in MIDAS, except for the new medicines without sales data in MIDAS, for which the reporting is based on the Anatomic Therapeutic Chemical (ATC) Classification System maintained by the World Health Organization (WHO).
† Australia, Belgium, France, Germany, Italy, Japan, Netherlands, Norway, Spain, Sweden, and the United Kingdom.
‡ Includes all PMPRB11 countries, as well as the US and Canada.
§ Canadian unit prices were retrieved from IQVIA MIDAS® Database, where available; otherwise, they were taken from:
i CADTH’s Reimbursement Review report.
** Treatment costs were calculated using Canadian list prices if available; otherwise, the PMPRB11 median price or available PMPRB11 price was used. If no other countries reported sales, the US price was used. Information on dosing regimens was taken from the product monograph provided by Health Canada, or the FDA or EMA if unavailable though Health Canada.
Data source: IQVIA MIDAS® Database, 2020 (all rights reserved); US Food and Drug Administration Novel Drugs 2019; European Medicines Agency Human Medicines Highlights 2019; Health Canada databases.
Of the 40 new medicines with available treatment costs, 65% cost over $10,000 per year or $5,000 per 28-day cycle. Ten of eleven new oncology medicines fell into this “high-cost” category, along with more than half of non-oncology medicines. Eight non-oncology and five oncology medicines were identified as expensive drugs for rare diseases (EDRDs)—orphan-designated therapies exceeding $100,000 in annual treatment costs, or $7,500 per 28-day cycle. Together, these 12 EDRDs accounted for over 36% of 2019 new medicine sales.
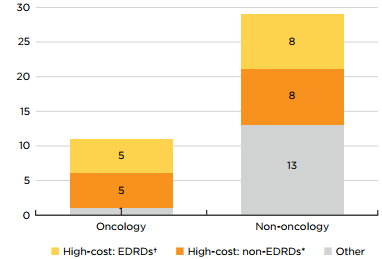
Figure description
This stacked bar graph gives the distribution of the 40 2019 new medicines with available treatment costs by high-cost bracket. The first bar shows the distribution of new oncology medicines, while the second gives the totals for non-oncology medicines. Each bar is broken down into the number of new medicines that are expensive drugs for rare diseases (EDRDs), those that are high-cost but do not qualify as EDRDs, and all other non-high-cost medicines. High-cost medicines exceed $10,000 in annual treatment costs or $5,000 per 28-day cycle. Expensive drugs for rare diseases are defined as having treatment costs in excess of $100,000 annually or $7,500 per 28-day cycle, as well as an orphan designation from either the US Food and Drug Administration or the European Medicines Agency.
| Expensive drugs for rare diseases† | High-cost medicines*, other than EDRDs | Other | Total | |
|---|---|---|---|---|
Oncology medicines |
5 |
5 |
1 |
11 |
Non-oncology medicines |
8 |
8 |
13 |
29 |
Note: This analysis considers the 40 new medicines approved in 2019 with treatment costs available as of Q3-2021.
* High-cost medicines are defined as those with treatment costs exceeding $10,000 annually or $5,000 per 28-day cycle.
† Expensive drugs for rare diseases (EDRDs) are defined as those with an orphan designation through the FDA or EMA and treatment costs exceeding $7,500 per 28-day cycle or $100,000 annually.
Data source: IQVIA MIDAS® Database, 2020 (all rights reserved); Canadian Agency for Drugs and Technologies in Health (CADTH) reports.
Prior to being marketed in Canada, medicines must be reviewed and authorized by Health Canada. However, to be added to the formulary of public insurers, medicines must also be assessed by the Canadian Agency for Drugs and Technologies in Health (CADTH), an independent, non-for-profit health technology assessment organization.Footnote 3 Depending on the results of this assessment, the pan-Canadian Pharmaceutical Alliance (pCPA)—a consortium of public drug plans that conducts joint negotiations for brand-name and generic drugs in Canada—may then choose to enter price negotiations with pharmaceutical manufacturers prior to the drugs being added to public formularies.
As of Q3-2021, 24 of the medicines first approved in 2019 had been authorized for market in Canada. Of this group, 12 had been reviewed through CADTH’s reimbursement review process, all receiving a recommendation to “reimburse with conditions”. Five of the 24 new medicines approved in Canada had completed pCPA negotiations by Q3-2021 and seven others had negotiations underway; the remaining 11 medicines had no record of negotiation.
A review of private drug plan data found that half (12) of the 24 new medicines had been reimbursed by a private drug plan in Canada by Q3-2021. These are early results and the rates of reimbursement for new medicines can be expected to increase in the coming years.
The PMPRB’s Human Drug Advisory Panel (HDAP), which conducts scientific reviews of new patented medicines, found that 12 of the 14 new medicines reviewed demonstrated slight or no improvement over their therapeutic comparators. The remaining 10 medicines had not yet been reviewed as of Q3-2021.Footnote 4
Table B2 provides an overview of the recommendations and negotiation status for the 24 approved medicines, as well as information on whether these medicines have recorded sales through private drug plans in Canada.
Table B3 provides further details on the pharmacoeconomic assessments conducted by CADTH through its review process, including the indications assessed, the recommended condition for reimbursement, the primary evaluation, the range of reported incremental cost-effectiveness ratios (ICER) reported, and the price reduction required for the medicine to achieve an ICER of $50,000 per quality-adjusted life year (QALY). The results suggest that none of the new medicines reviewed by CADTH were cost-effective at the submitted price. Accordingly, all were recommended to be approved on the condition that their price be reduced; price reductions needed to reach the $50,000/QALY level were estimated in 12 of the 15 available reports, ranging from 5% to over 90% of the submitted price. Of the 12 medicines, none produced an ICER below $50,000/QALY and some produced values as high as $2 million.
Table B2 Assessments, recommendations, and reimbursement decisions for 2019 new medicines approved in Canada by Q3-2021
| ATC* | Medicine (trade name)† | Health Canada approval | CADTH recommendation‡ | pCPA negotiation status§ | Private plans | ||||||
|---|---|---|---|---|---|---|---|---|---|---|---|
| Notice of Compliance | Reimburse | Reimburse with conditions | Do not reimburse | Review in progress | Active | Completed and closed | Concluded without agreement | No negotiations | Covered | ||
L1 |
Alpelisib (Piqray)C |
Mar-20 |
X |
X |
|||||||
B2 |
Turoctocog alfa pegol (Esperoct)B |
Jul-19 |
|||||||||
S1 |
Brilliant blue G (TissueBlue)O |
Jan-21 |
|
|
|||||||
S1 |
Brolucizumab (Beovu)B |
Mar-20 |
X |
X |
X |
||||||
L2 |
Darolutamide (Nubeqa)C |
Feb-20 |
X |
X |
X |
||||||
R7 |
Elexacaftor (Trikafta)O |
Jun-21 |
X |
X |
|
||||||
L1 |
Entrectinib (Rozlytrek)B,C,O |
Feb-20 |
X |
X |
X |
||||||
L1 |
Erdafitinib (Balversa)C |
Oct-19 |
|
X |
|||||||
L1 |
Fedratinib (Inrebic)C,O |
Jul-20 |
X |
X |
|
||||||
B6 |
Givosiran (Givlaari)O |
Oct-20 |
X |
X |
|
||||||
J1 |
Lefamulin (Xenleta) |
Jul-20 |
|
|
|||||||
N5 |
Lemborexant (Dayvigo) |
Nov-20 |
|
X |
|||||||
B3 |
Luspatercept (Reblozyl)B,O |
Sept-20 |
X |
X |
|
||||||
L1 |
Polatuzumab vedotin (Polivy)B,C,O |
Jul-20 |
X |
X |
|
||||||
D5 |
Risankizumab (Skyrizi)B |
Apr-19 |
X |
X |
X |
||||||
M5 |
Romosozumab (Evenity)B |
Jun-/19 |
|
X |
X |
||||||
N7 |
Siponimod (Mayzent) |
Feb-20 |
X |
X |
X |
||||||
N7 |
Solriamfetol (Sunosi)O |
May-21 |
|
||||||||
A6 |
Tenapanor (Ibsrela) |
Apr-20 |
X |
||||||||
L1 |
Trastuzumab deruxtecan (Enhertu)B,C |
Apr-21 |
|
||||||||
D10 |
Trifarotene (Aklief) |
Nov-19 |
X |
||||||||
M1 |
Upadacitinib (Rinvoq) |
Dec-19 |
X |
X |
X |
||||||
L1 |
Zanubrutinib (Brukinsa)C,O |
May-21 |
X |
||||||||
N7 |
Onasemnogene abeparvovec (Zolgensma)B,G,O |
Dec-20 |
X |
X |
|||||||
Note: Medicines were assessed through CADTH’s Reimbursement Review process.
* Level 2 of the Anatomical Classification of Pharmaceutical Products, as reported in MIDAS.
† B: biologic; C: cancer; G: gene therapy; O: orphan.
Data source: IQVIA Private Drug Plan database, 2020; Health Canada Notice of Compliance Database; Canadian Agency for Drugs and Technologies in Health (CADTH) reports; pan-Canadian Pharmaceutical Alliance (pCPA) reports; and IQVIA MIDAS® Database rights reserved).
Table B3 Summary of Reimbursement Review assessments for 2019 new medicines approved in Canada by Q3-2021
| Medicine (trade name)* | Date of recommendation† | Indication(s) | Conditional on price‡ | Type of evaluation (primary)§ | Incremental cost-effectiveness ratio (ICER) ($ per QALY) | Price reduction range ($50,000 per QALY) |
|---|---|---|---|---|---|---|
Alpelisib (Piqray, film-ctd tab, 300 mg)C |
In progress |
Advanced or metastatic breast cancer |
– |
– |
– |
– |
Brolucizumab (Beovu, prefill syrng ophth., 120 mg/ml, 0.05 ml)B |
Jul-20 |
Macular degeneration, age-related |
Not explicitly |
CUA |
$250,575 |
85% |
Darolutamide (Nubeqa, film-ctd tab, 300 mg)C |
Apr-20 |
Non-metastatic castration resistant prostate cancer (nmCRPC) |
Yes |
CUA |
$177,097 |
>50% |
Elexacaftor (Trikafta, film-ctd tab, various strengths)O |
Sep-21 |
Cystic fibrosis, F508del CFTR mutation |
Yes |
CUA |
$181,718 to $1,911,977 |
>90% |
Entrectinib (Rozlytrek, capsule, 200 mg)B,C,O |
Jan-21 |
ROS1-positive NSCLC |
Yes |
CUA |
$91,447 to $119,640 |
NA |
Fedratinib (Inrebic, capsule, 100 mg)C,O |
Jun-21 |
Myelofibrosis |
Not explicitly |
CUA |
$416,446 |
Impossible to achieve at any price due to the cost of subsequent therapies |
Givosiran (Givlaari, vial sc, 189 mg/ml, 1 ml)O |
Sep-21 |
Acute hepatic porphyria (AHP) in adults |
Yes |
CUA |
$17,928,198 |
63% |
Luspatercept (Reblozyl, vial dry, 75 mg)B,O |
Aug-21 |
Beta-thalassemia associated anemia |
Yes |
CUA |
$659,395 |
>85% |
Polatuzumab vedotin (Polivy, infus. dry bottle, 140 mg)B,C,O |
Apr-21 |
Diffuse large B-cell lymphoma (DLBCL) |
Yes |
CUA |
$67,000 to $147,000 |
35%–84% |
Risankizumab (Skyrizi, prefill syrng sc, 90 mg/ml, 0.83 ml)B |
May-19 |
Psoriasis, moderate to severe plaque |
Not explicitly |
CUA |
$2,370,521 |
26% |
Romosozumab (Evenity, prefill syrng sc, 90 mg/ml, 1.17 ml)B |
In progress |
Osteoporosis, postmenopausal women |
– |
– |
– |
– |
Siponimod (Mayzent, film-ctd tab, 2 mg) |
Jul-20 |
Secondary progressive multiple sclerosis |
Yes |
CUA |
$194,007 |
63% |
Upadacitinib (Rinvoq, film-ctd tab ret., 15 mg) |
Feb-20 |
Arthritis, rheumatoid |
Not explicitly |
CUA |
$116,257 to $778,700 |
50%–70% |
Upadacitinib (Rinvoq, film-ctd tab ret., 15 mg) |
Aug-21 |
Psoriatic arthritis, adults |
Not explicitly |
CUA |
Dominated** |
5%–27% |
Zanubrutinib (Brukinsa, capsule, 80 mg)C,O |
In progress |
Mantle cell lymphoma (MCL) |
– |
– |
– |
– |
Onasemnogene abeparvovec (Zolgensma, infus. vial/bottle, 16.5 ml)B,G,O |
May-21 |
Spinal muscular atrophy (SMA), pediatrics |
Yes |
CUA |
$334,090 |
>90% |
Note: The type of evaluation and the incremental cost-effectiveness ratio (ICER) are based on the Reimbursement Review reports. The table reports the low-bound and high-bound range estimated for all comparators and conditions analyzed. Cost-utility analysis (CUA) and cost-effectiveness analysis (CEA) evaluations are provided as a range per quality-adjusted life year (QALY). Additional information can be accessed at https://www.cadth.ca.
* B: biologic; C: cancer; G: gene therapy; O: orphan.
† Initial or final recommendation issued as of Q3-2021.
‡ Price was defined as a condition for reimbursement.
§ CUA: cost-utility analysis.
** Dominated indicates that a high-bound ICER value cannot be calculated as the product is more costly and less effective than comparator products. Dominant refers to a negative low-bound ICER value, which indicates that the product is less costly and more effective than comparators.
Data source: Canadian Agency for Drugs and Technologies in Health (CADTH) reports.
C: New Medicine Approvals, 2020
This section provides an analysis of the new medicines approved internationally in 2020, including information on approval status as of Q3-2021 and pricing as of Q4-2020.
The number of medicines approved in 2020 was in line with previous years and included a greater share of oncology and orphan medicines. Of the new approvals with sales by the end of the year, three quarters were identified as high-cost treatments.
Fifty new medicines received first-time market approval through the FDA, the EMA, and/or Health Canada in 2020. As of the third quarter of 2021, Health Canada had approved 19 of these new medicines, trailing the EMA (28) and the FDA (47) (Figure C1). Note that manufacturers may choose to submit new medicines for approval in the US, Europe, and Canada at different times, which may affect the number of medicines approved by each regulator.
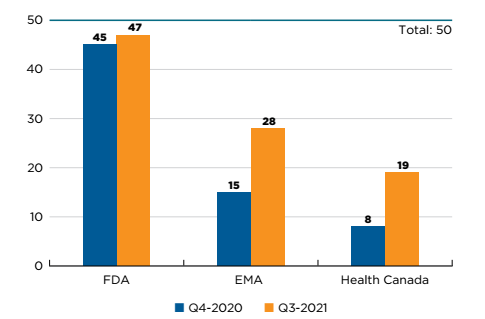
Figure description
This is a bar graph with the number of 2020 new medicines approved by Health Canada, the European Medicines Agency, and the US Food and Drug Administration as of the fourth quarter of 2020 and the third quarter of 2021. The total number of new medicines in 2020 was 50.
| US Food and Drug Administration | European Medicines Agency | Health Canada | |
|---|---|---|---|
Q4-2020 |
45 |
15 |
8 |
Q3-2021 |
47 |
28 |
19 |
Note: Based on medicines that received market approval through the US Food and Drug Administration (FDA), the European Medicines Agency (EMA) and/or Health Canada in 2020.
Data source: US Food and Drug Administration, European Medicines Agency, and Health Canada databases.
Table C1 provides a full list of the 50 new medicines approved in 2020 along with the country with first reported sales, availability in Canada, and price and treatment cost where available.Footnote 5 Prices are reported for the highest-selling form and strength of each medicine. Note that this information reflects the early availability and uptake of these medicines in the markets analyzed.
By Q4-2020, 32 of the new medicines had sales in Canada, the US, and/or the PMPRB11. Three quarters (24) of these had treatment costs exceeding $10,000 per year or $5,000 per 28-day course for oncology medicines, placing them in the high-cost category. Remdesivir, which is indicated for the treatment of COVID-19, was the new medicine sold in the most countries by Q4-2020, with sales recorded in six markets, including Canada. The Pfizer-BioNTech COVID-19 mRNA vaccine Comirnaty was also first approved in 2020, though no sales were recorded before the end of the year.
Figure C2 illustrates the overlap between the number of new specialty medicines authorized for market in 2020. Of the 50 new medicines approved in 2020, 58% (29) had received an orphan designation from the FDA and/or the EMA and 34% (19) were oncology treatments. Approximately 30% (15) of the new approvals were orphan oncology medicines. Biologics accounted for 38% (19) of the 2020 new medicines.
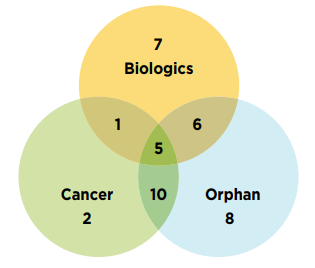
Figure description
This is a Venn diagram illustrating the overlap between orphan, biologic, and oncology treatments among the 2020 new medicines. Of the 50 new approvals, a total of 29 medicines were biologic, 29 had an orphan designation, and 18 were cancer medicines. Of these, six were both biologic and orphan, one was both biologic and oncological, 10 were both orphan and oncological, and five were biologic cancer medicines that also received an orphan designation.
Data source: US Food and Drug Administration Novel Drugs 2020; European Medicines Agency Human Medicines Highlights 2020; Health Canada Notice of Compliance Database.
Table C1 New medicines approved in 2020, availability, prices, and treatment costs, Q4-2020
| Medicine (trade name, form, strength, volume) | Therapeutic class* | Availability | No. of countries with sales‡ | Canadian price§ (CAD) | PMPRB11 price (CAD) | US price (CAD) | Treatment cost** | |||||
|---|---|---|---|---|---|---|---|---|---|---|---|---|
First sale in Canada, US, or PMPRB11† |
First sale in Canada | Min. | Median | Max. | Treatment cost (CAD) | Annual/Course | ||||||
Avapritinib (Ayvakyt, film-ctd tab, 100 mg)C,O |
L1-Antineoplastics |
US |
Jan-20 |
– |
2 |
– |
1,505 |
1,505 |
1,505 |
– |
63,193 to 94,789 |
21-day cycle |
Belantamab mafodotin (Blenrep, vial dry, 100 mg)B,C,O |
L1-Antineoplastics |
FRA |
Apr-20 |
– |
3 |
– |
– |
– |
– |
10,093 |
18,925 |
21-day cycle |
Bempedoic acid (Nexletol, film-ctd tab, 180 mg) |
C10-Lipid-regulating/anti-atheroma preparations |
US |
Mar-20 |
– |
3 |
– |
– |
– |
– |
14 |
4,956 |
Annual |
Bulevirtide (Hepcludex, vial dry, 2 mg)B,O |
J5-Antivirals for systemic use |
FRA |
Dec-19 |
– |
2 |
– |
459 |
529 |
598 |
– |
193,012 |
Annual |
Cabotegravir (Vocabria, film-ctd tab, 30 mg) |
J5-Antivirals for systemic use |
CAN |
Sep-20 |
Sep-20 |
1 |
21 |
– |
– |
– |
– |
15,742 to 14,513 |
Annual |
Capmatinib (Tabrecta, film-ctd tab, 200 mg)C,O |
L1-Antineoplastics |
US |
May-20 |
– |
2 |
– |
65 |
65 |
65 |
194 |
2,740 |
21-day cycle |
Cedazuridine (Inqovi, film-ctd tab, 100 mg + 35 mg)C,O |
L1-Antineoplastics |
US |
Sep-20 |
– |
1 |
879 i |
– |
– |
– |
1,769 |
4,396 |
28-day cycle |
Eptinezumab (Vyepti, infus. vial/bottle, 100 mg/ml, 1 ml)B |
N2-Analgesics |
US |
Apr-20 |
– |
1 |
– |
– |
– |
– |
1,838 |
7,965 to 23,894 |
Annual |
Filgotinib (Jyseleca, film-ctd tab, 200 mg)B |
M1-Anti-inflammatory and anti-rheumatic products |
GER |
Oct-20 |
– |
3 |
– |
33 |
38 |
42 |
– |
13,826 |
Annual |
Fostemsavir trometamol (Rukobia, film-ctd tab ret., 600 mg) |
J5-Antivirals for systemic use |
US |
Sep-20 |
– |
1 |
– |
– |
– |
– |
149 |
108,574 |
Annual |
Isatuximab (Sarclisa, infus. vial/bottle, 20 mg/ml, 25 ml)B,C,O |
L1-Antineoplastics |
US |
Mar-20 |
Jul-20 |
5 |
3,999 |
2,838 |
3,818 |
4,480 |
3,804 |
21,221 to 10,661 |
First/subsequent 28-day cycles |
Lurbinectedin (Zepzelca, infus. dry bottle, 4 mg)C,O |
L1-Antineoplastics |
US |
Sep-20 |
– |
1 |
– |
– |
– |
– |
7,450 |
11,175 |
21-day cycle |
Osilodrostat (Isturisa, film-ctd tab, 5 mg)O |
H4-Other hormones |
FRA |
Jan-20 |
– |
3 |
– |
161 |
161 |
161 |
– |
47,012 to 705,180 |
Annual |
Ozanimod (Zeposia, capsule, 920 mcg) |
N7-Other central nervous system drugs |
US |
Jun-20 |
– |
3 |
68 i |
83 |
87 |
92 |
267 |
25,017 |
Annual |
Pemigatinib (Pemazyre, tablet, 13.5 mg)C,O |
L1-Antineoplastics |
US |
May-20 |
– |
1 |
830 i |
– |
– |
– |
1,467 |
20,544 |
21-day cycle |
Pralsetinib (Gavreto, capsule, 100 mg)C,O |
L1-Antineoplastics |
US |
Nov-20 |
– |
1 |
– |
– |
– |
– |
190 |
15,937 |
21-day cycle |
Remdesivir (Veklury, infus. dry bottle, 100 mg) |
J5-Antivirals for systemic use |
UK |
Jul-20 |
Sep-20 |
6 |
503 |
400 |
462 |
523 |
655 |
3,017 to 5,530 |
5- to 10-day course |
Remimazolam (Anerem, infus. dry bottle, 50 mg) |
N1-Anaesthetics |
JPN |
Aug-20 |
– |
1 |
– |
22 |
22 |
22 |
– |
22 |
One-time |
Rimegepant (Nurtec, orally disintegrating tab, 75 mg) |
N2-Analgesics |
US |
Mar-20 |
– |
1 |
– |
– |
– |
– |
131 |
131/23,951 |
Acute/annual (preventive) |
Ripretinib (Qinlock, tab, 50 mg)C,O |
L1-Antineoplastics |
US |
Jun-20 |
– |
1 |
– |
– |
– |
– |
403 |
25,358 |
21-day cycle |
Risdiplam (Evrysdi, dry syrup/drop, 3.75 mg/5 ml, 80 ml)O |
N7-Other central nervous system drugs |
US |
Sep-20 |
– |
1 |
970 i |
– |
– |
– |
889 |
354,000 |
Annual |
Sacituzumab govitecan (Trodelvy, infus. dry bottle, 180 mg)B,C |
L1-Antineoplastics |
US |
Apr-20 |
– |
1 |
1,478 i |
– |
– |
– |
2,342 |
19,521 |
21-day cycle |
Satralizumab (Enspryng, prefill syrng sc, 120 mg/ml, 1 ml)B,O |
N7-Other central nervous system drugs |
JPN |
Aug-20 |
– |
2 |
9,450 i |
15,212 |
15,212 |
15,212 |
17,275 |
132,300/ 122,850 |
First/subsequent years |
Selpercatinib (Retevmo, capsule, 80 mg)C,O |
L1-Antineoplastics |
US |
May-20 |
– |
1 |
– |
– |
– |
– |
211 |
17,754 |
21-day cycle |
Selumetinib (Koselugo, capsule, 25 mg)O |
L1-Antineoplastics |
US |
Apr-20 |
– |
1 |
– |
– |
– |
– |
218 |
318,296 |
Annual |
Tafasitamab (Monjuvi, infus. dry bottle, 200 mg)B,C,O |
L1-Antineoplastics |
US |
Aug-20 |
– |
1 |
– |
– |
– |
– |
1,402 |
12,617 to 31,543 |
28-day cycle |
Tazemetostat (Tazverik, film-ctd tab, 200 mg)C,O |
L1-Antineoplastics |
US |
May-20 |
– |
1 |
– |
– |
– |
– |
73 |
12,189 |
21-day cycle |
Teprotumumab (Tepezza, infus. dry bottle, 500 mg)B,O |
S1-Ophthalmologicals |
US |
Feb-20 |
– |
1 |
– |
– |
– |
– |
18,225 |
920,374 |
Annual |
Triheptanoin (Dojolvi, oral liquid, 4.8 g/5 ml, 500 ml)O |
A16-Other alimentary tract and metabolism products |
US |
Jul-20 |
– |
1 |
63 i |
– |
– |
– |
55 |
118,678/ 466,971 |
Annual |
Tucatinib (Tukysa, film-ctd tab, 150 mg)C,O |
L1-Antineoplastics |
US |
Apr-20 |
– |
1 |
120 i |
– |
– |
– |
174 |
12,216/ 11,710 |
First/subsequent 21-day cycles |
Vibegron (Beova, film-ctd tab, 50 mg) |
G4-Urologicals |
JPN |
Nov-18 |
– |
1 |
– |
2 |
2 |
2 |
– |
1,000 |
Annual |
Viltolarsen (Viltepso, infus. vial/bottle, 50 mg/ml)O |
M5-Other drugs for disorders of the musculo-skeletal |
JPN |
May-20 |
– |
2 |
– |
905 |
905 |
905 |
1,814 |
1,128,849 |
Annual |
Medicines without sales data in MIDAS® as of Q4-2020 – date of approval by FDA, EMA, and/or Health Canada.
| Medicine (trade name, form, strength, volume) | Therapeutic class* | Date of approval by FDA, EMA, and/or Health Canada | |
|---|---|---|---|
Abametapir (Xeglyze) |
P03-Ectoparasiticides, incl. scabicides, insecticides and repellents |
FDA |
Jul-20 |
Ansuvimab-zykl (Ebanga)B,O |
Not assigned as of Q3-2021 |
FDA |
Dec-20 |
Atoltivimab, maftivimab, and odesivimab-ebgn‡‡ (Inmazeb)B,O |
Not assigned as of Q3-2021 |
FDA |
Oct-20 |
Berotralstat (Orladeyo)B |
B6-All other haematological agents |
FDA |
Dec-20 |
Clascoterone (Winlevi) |
D10-Anti-acne preparations |
FDA |
Aug-20 |
Inebilizumab (Uplizna)B,O |
N7-Other central nervous system drugs |
FDA |
Jun-20 |
Lonafarnib (Zokinvy)O |
V3-All other therapeutic products |
FDA |
Nov-20 |
Lumasiran (Oxlumo)O |
G4-Urologicals |
EMA |
Nov-20 |
Naxitamab (Danyelza)B,C,O |
L1-Antineoplastics |
FDA |
Nov-20 |
Oliceridine (Olinvyk) |
N2-Analgesics |
FDA |
Aug-20 |
Relugloix†† (Orgovyx)C |
L2-Cytostatic hormone therapy |
FDA |
Dec-20 |
Setmelanotide (Imcivree)O |
A08-Antiobesity preparations, excl. diet products |
FDA |
Nov-20 |
Somapacitan (Sogroya)B |
H01-Pituitary and hypothalamic hormones and analogues |
FDA |
Aug-20 |
Tirbanibulin (Klisyri) |
D5-Nonsteroidal products for inflammatory skin disorders |
FDA |
Dec-20 |
Imlifidase (Idefirix)B |
L04-Immunosuppressants |
EMA |
Aug-20 |
COVID-19 MRNA vaccine (Comirnaty)B |
J7-Vaccines |
EMA |
Dec-20 |
Brexucabtagene autoleucel (Tecartus)B,C,G,O |
L1-Antineoplastics |
FDA |
Jul-20 |
Coagulation Factor VIIa [Recombinant] (Sevenfact)B |
B2-Blood coagulation system, other products |
FDA |
Apr-20 |
Note: A medicine was considered to be new in 2020 if it received market approval through the US Food and Drug Administration (FDA), the European Medicines Agency (EMA), and/or Health Canada during the calendar year.
Availability and sales information refers to all forms and strengths of the medicine while pricing and treatment costs are based on the highest-selling form and strength indicated. Sales are based on manufacturer list prices. Specialty medicines are indicated using the following abbreviations: B: biologic; C: cancer; G: gene therapy; O: orphan.
* Level 2 of the Anatomical Classification of Pharmaceutical Products, as reported in MIDAS, except for the new medicines without sales data in MIDAS, for which the reporting is based on the Anatomic Therapeutic Chemical (ATC) Classification System maintained by the World Health Organization (WHO).
† Australia, Belgium, France, Germany, Italy, Japan, Netherlands, Norway, Spain, Sweden, and the United Kingdom.
‡ Includes all PMPRB11 countries, as well as the US and Canada.
§ Canadian unit prices were retrieved from IQVIA MIDAS® Database, where available; otherwise, they were taken from:
i CADTH’s Reimbursement Review report.
** Treatment costs were calculated using Canadian list prices if available; otherwise, the PMPRB11 median price or available PMPRB11 price was used. If no other countries reported sales, the US price was used. Information on dosing regimens was taken from the product monograph provided by Health Canada, or the FDA or EMA if unavailable though Health Canada.
†† This medicinal ingredient has been sold in Japan for another indication and in another strength and form than were approved by the FDA.
‡‡ All three medicinal ingredients were first approved in the 2020 combination product Inmazeb, which is indicated to treat infections caused by the Zaire ebolavirus. For the purposes of this report, all three medicinal ingredients are considered one new medicine.
Data source: IQVIA MIDAS® Database, 2020 (all rights reserved); US Food and Drug Administration Novel Drugs 2020; European Medicines Agency Human Medicines Highlights 2020; Health Canada Notice of Compliance Database.
D: Spotlight on Canada
While Sections B and C reported new medicines approved internationally, this section reports on Canadian approvals between 2016 and 2020, with a focus on the 34 medicines that received their first Canadian market authorization in 2019.
The number of new-to-Canada medicines approved in 2019 and 2020 was consistent with recent trends and included many of the top-selling new medicines approved internationally in the same year, as listed in Tables B1 and C1.
In 2019, Health Canada granted initial market authorization to 34 medicines, aligning with the average rate of nine new medicines approvals per quarter in the three previous years (Figure D1). Almost half (16) of the new medicines were indicated to treat cancer.
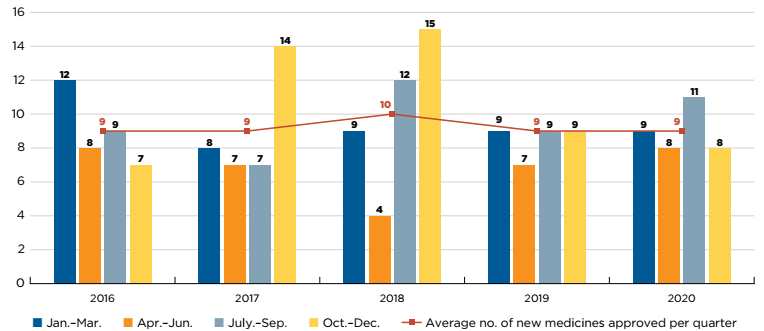
Figure description
This is a bar graph showing the number of new medicines approved quarterly by Health Canada between 2016 and 2020. For each year, the number of new approvals is given for January to March; April to June; July to September; and October to December. A trend line gives the annual average number of new medicines approved per quarter.
| Year of approval | January to March | April to June | April to June | October to December | Average number of new medicines approved per quarter |
|---|---|---|---|---|---|
2016 |
12 |
8 |
9 |
7 |
9 |
2017 |
8 |
7 |
7 |
14 |
9 |
2018 |
9 |
4 |
12 |
15 |
10 |
2019 |
9 |
7 |
9 |
9 |
9 |
2020 |
9 |
8 |
11 |
8 |
9 |
Data source: Health Canada Notice of Compliance database (NOC).
Table D1 reports on the therapeutic class, availability, sales, and pricing of the 34 new-to-Canada medicines approved in 2019 as of the end of 2020. The 20 new medicines with sales collectively accounted for less than 1% of branded pharmaceutical sales in Canada by Q4-2020. Notably, three of the five highest-selling medicines reported in the list of 2019 new medicines in Table B1 are also reported here, indicating that Canadian approval occurred in the same year as international approval.
For each medicine, Table D1 also provides foreign-to-Canadian price ratios, which compare the median price of medicines in the PMPRB11 countries and the US price with the Canadian price. The average price of the medicine in Canada is set to a value of one and the corresponding foreign prices are reported relative to this value. The resulting ratios reflect how much more or less Canadians would have paid for a new medicine if they had paid the median international price or the US price.
The median PMPRB11 to Canadian price ratio reported across all new medicines was 0.91, indicating that international prices in Q4-2019 were approximately 9% lower than Canadian prices at introduction. In contrast, the median US price ratios show that the US pays about 170% as much as Canada for the same medicines.
Table D1 Medicines first approved in Canada in 2019, availability, sales, and prices as of Q4-2020
| Medicine (trade name, form, strength, volume) | Therapeutic class* | Availability | Share of Canadian new medicine sales | No. of countries with sales‡ | Price (CAD) | ||||||
|---|---|---|---|---|---|---|---|---|---|---|---|
| First sale in the PMPRB11† | First sale in Canada | First sale in US | Canada | PMPRB11 median | US | Median PMPRB11-to-Canadian price ratio | US-to-Canadian price ratio | ||||
177Lu-Dotatate (Lutathera, infus. vial/bottle, 25 ml)C,O |
V3C0-Radiopharmaceuticals |
Apr-15 |
– |
– |
– |
3 |
35,000 i |
31,073 |
– |
0.89 |
– |
Abemaciclib (Verzenio, film-ctd tab, 150 mg)C |
L1H5-Protein kinase inhibitor (PKI) antineoplastics, CDK 4/6 |
Sep-18 |
Jul-19 |
Oct-17 |
3% |
12 |
97 |
80 |
– |
0.83 |
– |
Acalabrutinib (Calquence, capsule, 100 mg)C,O |
L1H9-Protein kinase inhibitor (PKI) antineoplastics, other |
Sep-20 |
Jul-20 |
Nov-17 |
16% |
5 |
134 |
133 |
275 |
0.99 |
2.05 |
Axicabtagene ciloleucel (Yescarta, infus. bag, 68 ml)B,C,O,G |
L1X5-CAR T-cell therapy antineoplastics |
Jul-18 |
– |
– |
– |
5 |
– |
473,092 |
– |
– |
– |
Cemiplimab (Libtayo, infus. vial/bottle, 50 mg/ml, 7 ml)B,C |
L1G5-Monoclonal antibody antineoplastics, PD-1/PD-L1 |
Apr-19 |
May-19 |
Oct-18 |
1% |
7 |
8,543 |
7,800 |
10,839 |
0.91 |
1.27 |
Cenegermin (Oxervate, ophth. preservative-free multi-dose liquid, 20 mcg/ml, 1 ml)B,O |
S1X2-Other ophthalmologicals, topical |
Nov-17 |
– |
– |
– |
2 |
– |
24 |
– |
– |
– |
Dacomitinib (Vizimpro, film-ctd tab, 30 mg)C,O |
L1H2-Protein kinase inhibitor antineoplastics, EGFR |
Mar-19 |
Apr-19 |
Oct-18 |
<1% |
6 |
122 |
121 |
506 |
1.00 |
4.15 |
Decitabine (Dacogen, infus. dry bottle, 50 mg)C,O |
L1B0-Antimetabolites |
Sep-12 |
– |
May-06 |
– |
9 |
– |
1,671 |
– |
– |
– |
Enasidenib (Idhifa, film-ctd tab, 100 mg)C,O |
L1X9-All other antineoplastics |
Jan-00 |
– |
Aug-17 |
– |
1 |
1,216 i |
– |
1,022 |
– |
0.84 |
Erdafitinib (Balversa, film-ctd tab, 4 mg)C |
L1H9-Protein kinase inhibitor (PKI) antineoplastics, other |
Jan-00 |
Dec-19 |
Apr-19 |
1% |
2 |
195 |
– |
464 |
– |
2.38 |
Ethyl-eicosapentaenoic acid (Vascepa, capsule, 1 g) |
C10B0-Anti-atheroma preparations of natural origin |
Jun-90 |
Feb-20 |
Sept-05 |
2% |
10 |
3 |
– |
3 |
– |
1.32 |
Galcanezumab (Emgality, prefill autoinj., 120 mg/ml, 1 ml)B |
N2C2-Antimigraine CGRP antagonists |
Nov-18 |
Oct-19 |
Oct-18 |
12% |
9 |
632 |
596 |
727 |
0.94 |
1.15 |
Gemtuzumab ozogamicin (Mylotarg, infus. dry bottle, 4.5 mg)B,C,O |
L1G9-Monoclonal antibody antineoplastics, other |
Sep-05 |
May-20 |
May-00 |
3% |
11 |
20,121 |
– |
9,050 |
– |
0.45 |
Gilteritinib (Xospata, film-ctd tab, 40 mg)C,O |
L1H9-Protein kinase inhibitor (PKI) antineoplastics, other |
Dec-18 |
Feb-20 |
Dec-18 |
1% |
8 |
293 |
287 |
291 |
0.98 |
0.99 |
Larotrectinib (Vitrakvi, oral liquid, 100 mg/5 ml, 100 ml)C,O |
L1H9-Protein kinase inhibitor (PKI) antineoplastics, other |
Oct-19 |
Sep-19 |
Dec-18 |
<1% |
5 |
340 |
397 |
858 |
1.17 |
2.52 |
Lorlatinib (Lorbrena, film-ctd tab, 100 mg)C,O |
L1H3-Protein kinase inhibitor antineoplastics, ALK |
Nov-18 |
Apr-19 |
Nov-18 |
2% |
9 |
346 |
242 |
671 |
0.70 |
1.94 |
Neratinib (Nerlynx, film-ctd tab, 40 mg)C |
L1H9-Protein kinase inhibitor (PKI) antineoplastics, other |
Aug-18 |
Dec-19 |
Sep-17 |
1% |
5 |
47 |
39 |
80 |
0.82 |
1.69 |
Niraparib (Zejula, capsule, 100 mg)C,O |
L1X4-PARP inhibitor antineoplastics |
Nov-17 |
Jan-20 |
Apr-17 |
3% |
10 |
136 |
125 |
275 |
0.91 |
2.02 |
Patisiran (Onpattro, infus. vial/bottle, 2 mg/ml, 5 ml)O |
N7X0-All other CNS drugs |
Oct-18 |
– |
Aug-18 |
– |
8 |
13,022 i |
12,206 |
10,584 |
0.94 |
0.81 |
Plecanatide (Trulance, tab, 3 mg) |
A3G0-Gastro-intestinal sensorimotor modulators |
Jan-00 |
– |
Mar-17 |
– |
1 |
– |
– |
18 |
– |
– |
Prasterone (Intrarosa, vaginal suppos., 6.5 mg) |
G2F0-Topical sex hormones |
Jan-99 |
– |
Nov-98 |
– |
6 |
– |
1 |
9 |
– |
– |
Ravulizumab (Ultomiris, infus. vial/bottle, 10 mg/ml, 30 ml)B,O |
L4X0-Other immunosuppressants |
Aug-19 |
– |
Jan-19 |
– |
3 |
– |
3,190 |
7,407 |
– |
– |
Risankizumab (Skyrizi, prefill syrng sc, 90 mg/ml, 0.83 ml)B |
D5B0-Systemic antipsoriasis products |
Apr-19 |
May-19 |
Apr-19 |
45% |
12 |
2,540 |
2,387 |
– |
0.94 |
– |
Romosozumab (Evenity, prefill syrng sc, 90 mg/ml, 1.17 ml)B |
M5B9-Other bone calcium regulators |
Mar-19 |
Aug-19 |
Apr-19 |
1% |
6 |
336 |
– |
1,115 |
– |
3.32 |
Safinamide (Onstryv, film-ctd tab, 100 mg) |
N4A0-Anti-parkinson preparations |
Feb-15 |
Jul-19 |
Jun-17 |
<1% |
13 |
7 |
4 |
37 |
0.55 |
5.23 |
Talazoparib (Talzenna, capsule, 1 mg)C |
L1X4-PARP inhibitor antineoplastics |
Oct-18 |
– |
Nov-18 |
– |
4 |
– |
276 |
623 |
– |
– |
Tibolone (Tibella, tab, 2.5 mg) |
G3X0-Other sex hormones and similar products |
Dec-87 |
Jul-20 |
– |
<1% |
11 |
3 |
1 |
– |
4.41 |
– |
Trifarotene (Aklief, cream, 75 g) |
D10A0-Topical anti-acne preparations |
Feb-20 |
Dec-19 |
Nov-19 |
1% |
8 |
2 |
1 |
– |
0.24 |
– |
Turoctocog alfa pegol (Esperoct, vial dry ret., 3000 IU)B |
B2D1-Factor VIII, including substitutes |
Jun-19 |
– |
Feb-20 |
– |
8 |
– |
3,341 |
2 |
– |
– |
Upadacitinib (Rinvoq, film-ctd tab ret., 15 mg) |
M1C0-Specific antirheumatic agents |
Dec-19 |
Jan-20 |
Aug-19 |
6% |
13 |
50 |
47 |
– |
0.94 |
– |
Vonicog alfa (Vonvendi, infus. dry bottle, 1300 IU)B |
B2D9-Other blood fractions |
Aug-18 |
– |
Oct-16 |
<1% |
6 |
2,006 i |
1,498 |
2,688 |
0.75 |
1.34 |
Zirconium cyclosilicate (Lokelma, oral u-d powder, 5 g/dose, 5 g) |
V3G1-Hyperkalaemia products |
Mar-18 |
Oct-19 |
Dec-18 |
<1% |
7 |
13 |
11 |
– |
0.83 |
– |
Medicines without sales data in MIDAS® as of Q4-2020 – date of approval by Health Canada
| Medicine (trade name, form, strength, volume) | Therapeutic class* | Date of approval by Health Canada |
|---|---|---|
Gallium (68GA) chloride |
V09IX-Other diagnostic radiopharmaceuticals for tumour detection |
Nov-19 |
Oxodotreotide (Netspot) |
V10XX-Various therapeutic radiopharmaceuticals |
Jul-19 |
Note: Specialty medicines are indicated using the following abbreviations: B: biologic; C: cancer; G: gene therapy; O: orphan.
* Level 4 of the Anatomical Classification of Pharmaceutical Products, as reported in MIDAS; if unavailable in MIDAS, the reporting is based on the Anatomical Therapeutic Chemical (ATC) Classification System maintained by the World Health Organization (WHO).
† Australia, Belgium, France, Germany, Italy, Japan, Netherlands, Norway, Spain, Sweden, and the United Kingdom.
‡ Includes all PMPRB11 countries, as well as the US and Canada.
§ Canadian unit prices were retrieved from IQVIA MIDAS® Database, where available; otherwise, they were taken from:
i CADTH’s Reimbursement Review report.
Data source: IQVIA MIDAS® Database, 2020 (all rights reserved); Health Canada Notice of Compliance Database.
To provide an overview of the time-to-market for new medicines in Canada, Figure D2 presents the proportion of new medicines approved in Canada from 2016 to 2020 that were listed as “marketed” in Health Canada’s Drug Product Database by the end of the following calendar year. The results indicate that over the past five years, more than 80% of new-to-Canada medicines have been sold within one year of their approval.
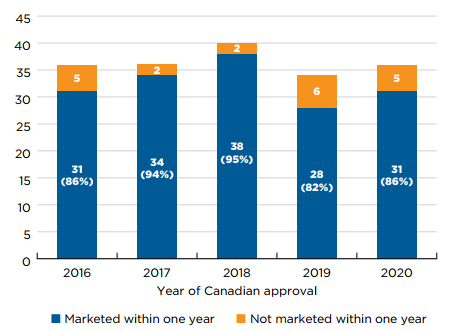
Figure description
This is a stack bar graph that gives the number and share of new medicines approved in Canada for each year from 2016 to 2020 that were listed as marketed in Health Canada’s Drug Product Database in the calendar year following their approval. The number of non-marketed medicines is also shown.
| Year of approval | Number of new medicines marketed | Share of new medicines marketed | Number of new medicines not marketed | Total number of new medicines |
|---|---|---|---|---|
2016 |
31 |
86% |
5 |
36 |
2017 |
34 |
94% |
2 |
36 |
2018 |
38 |
95% |
2 |
40 |
2019 |
28 |
82% |
6 |
34 |
2020 |
31 |
86% |
5 |
36 |
Note: A medicine was considered to be marketed if it was listed as such in Health Canada’s Drug Product Database before the end of the calendar year following its approval in Canada.
Data source: Health Canada Drug Product Database.
References
European Medicines Agency. 2020. Human Medicines Highlights 2019. Available: https://www.ema.europa.eu/en/news/human-medicines-highlights-2019
European Medicines Agency. 2021. Human Medicines Highlights 2020. Available: https://www.ema.europa.eu/en/news/human-medicines-highlights-2020
Food and Drug Administration. 2020. Novel Drugs 2019. Silver Spring, Maryland: US FDA, Center for Drug Evaluation and Research. Available: https://www.fda.gov/drugs/new-drugs-fda-cders-new-molecular-entities-and-new-therapeutic-biological-products/novel-drug-approvals-2019
Food and Drug Administration. 2021. Novel Drugs 2020. Silver Spring, Maryland: US FDA, Center for Drug Evaluation and Research. Available: https://www.fda.gov/drugs/new-drugs-fda-cders-new-molecular-entities-and-new-therapeutic-biological-products/novel-drug-approvals-2020
Health Canada. 2020. Drug and medical device highlights 2019: Helping you maintain and improve your health. Ottawa: Health Canada. Available: https://www.canada.ca/en/health-canada/services/publications/drugs-health-products/drug-medical-device-highlights-2019.html
Health Canada. 2021. Drug and medical device highlights 2020: Helping you maintain and improve your health. Ottawa: Health Canada. Available: https://www.canada.ca/en/health-canada/services/publications/drugs-health-products/drug-medical-device-highlights-2020.html
PMPRB. 2020. Oncology Medicines in Canada: Trends and International Comparisons, 2010-2019. Ottawa: Patented Medicine Prices Review Board. Available: https://www.canada.ca/en/patented-medicine-prices-review/services/npduis/analytical-studies/oncology-medicines-trends-international-comparisons/intro.html
PMPRB. 2021. Annual Report, 2019. Ottawa: Patented Medicine Prices Review Board. Available: https://www.canada.ca/en/patented-medicine-prices-review/services/annual-reports/annual-report-2019.html
PMPRB. 2022. Expensive Drugs for Rare Diseases: Canadian Trends and International Comparisons, 2011-2020. Ottawa: Patented Medicine Prices Review Board. Available: https://www.canada.ca/en/patented-medicine-prices-review/services/npduis/analytical-studies/chartbook/expensive-drugs-rare-diseases-2011-2020.html