
Archived - TB Drug resistance 2017

 Download this article as a PDF
Published by: The Public Health Agency of Canada
Issue: Volume 44-11: Healthcare-associated infections and antimicrobial resistance
Date published: November 1, 2018
ISSN: 1481-8531
Submit a manuscript
About CCDR
Browse
Volume 44-11, November 1, 2018: Healthcare-associated infections and antimicrobial resistance
Surveillance
Tuberculosis drug resistance in Canada: 2017
M LaFreniere1, H Hussain1,2, J Vachon1
Affiliations
1 Centre for Communicable Disease and Infection Control, Public Health Agency of Canada, Ottawa, ON
2 Dalla Lana School of Public Health, University of Toronto, Toronto, ON
Correspondence
Suggested citation
LaFreniere M, Hussain H, Vachon J. Tuberculosis drug resistance in Canada: 2017. Can Commun Dis Rep 2018;44(11):290–6. https://doi.org/10.14745/ccdr.v44i11a04
Keywords: tuberculosis, resistance, multidrug-resistant tuberculosis, extensively drug-resistant tuberculosis, isolates, surveillance, isoniazid, rifampin, ethambutol, pyrazinamide
Abstract
Background: Drug-resistant tuberculosis (TB) is a global public health issue. To monitor this in Canada, surveillance systems have been in place for the last 20 years.
Objective: To describe drug resistance patterns among TB isolates in Canada in 2017 by type of resistance as well as geographic location, demographic data and origin and to compare current data to those of the previous 10 years.
Methods: Data were derived and analyzed from two sources. The Canadian Tuberculosis Laboratory Surveillance System (CTBLSS) is an isolate-based laboratory surveillance system and was used to obtain information on the results of drug susceptibility testing (DST) as well as province or territory, sex and age of the individual from which the sample originated. The Canadian Tuberculosis Reporting System (CTBRS) is a case-based surveillance system with information on active and retreatment TB cases in Canada and was used to derive origin data, which is defined as either foreign-born, Canadian-born Indigenous or Canadian-born non-Indigenous. Analysis was descriptive and compared with data from these two sources for 2007–2016.
Results: In 2017, 1,515 TB isolates were tested for resistance to anti-TB drugs, with 123 (8.1%) demonstrating resistance to any first-line anti-TB drug. Of these, 103 were monoresistant, six were polyresistant and 14 were multidrug-resistant tuberculosis (MDR-TB). No extensively drug-resistant tuberculosis (XDR-TB) isolates were reported. Drug resistance was reported in seven provinces/territories (British Columbia, Alberta, Saskatchewan, Manitoba, Ontario, Quebec and New Brunswick). There were 63 isolates from females with drug resistance (9.5%) and 60 isolates from males with drug resistance (7.0%). Drug resistance was found in a greater percentage of isolates among those aged 25–34 (n=29, 23.6%). By origin, 1,072 (11%) foreign-born TB cases reported between 2005 and 2015 were drug-resistant. Among the Canadian-born non-Indigenous and Canadian-born Indigenous TB cases, 143 (9%) and 54 (2%) were drug-resistant, respectively. Compared with previous years, the number of isolates tested increased slightly (from 1,267 to 1,515); however, there was a decrease in the percentage of isolates with reported drug resistance (from 10.5% in 2007 to 8.1% in 2017).
Conclusion: In 2017, TB drug resistance rates remained low in Canada.
Introduction
Tuberculosis (TB) is an infectious airborne illness, primarily of the lungs, caused by the bacterium Mycobacterium tuberculosis. It is one of the most frequently reported infectious diseases globally Footnote 1. In 2016, the World Health Organization (WHO) estimated that 10.4 million people became ill with active TB Footnote 1. Although TB is curable, resistance of M. tuberculosis to anti-TB treatment may develop. In 2016, WHO estimated that 4.1% of new cases and 19% of previously treated cases globally had multidrug-resistant tuberculosis (MDR-TB) or rifampin-resistant TB Footnote 1.
In Canada, incidence of TB in the general population remains low at 4.8 cases per 100,000; however, certain subpopulations are disproportionally affected. Of those TB cases reported to the Public Health Agency of Canada (PHAC) in 2016, 70% were among individuals born outside Canada. As well, the rate among all Indigenous people was 23.5 cases per 100,000 and among Inuit, 170.1 per 100,000 Footnote 2.
Surveillance of drug-resistant TB has been conducted in Canada for the last 20 years because of the international importance of the disease in terms of public health and the potential for drug-resistant TB to spread to Canada. Among the reported cases of TB, drug resistance in Canada remains uncommon. Over the past decade, drug resistance trends have remained stable and low, with resistance to any of the first-line anti-TB drugs ranging from 8.2% to 10.5%. During the same period, MDR-TB also continued to be uncommon, with the percentage of positive isolates ranging from 0.6% to 1.6% Footnote 3.
The objective of this surveillance report is to describe the drug resistance patterns of TB isolates in Canada in 2017 by type of resistance, geographic location, demographic data and origin, and to compare current data to those of the previous 10 years.
Methods
Definitions
The Canadian Tuberculosis Standards categorizes TB drug resistance patterns as follows Footnote 4:
- Monoresistance: Resistance to one first-line anti-TB drug only (isoniazid, rifampin, ethambutol or pyrazinamide)
- Polyresistance: Resistance to more than one first-line anti-TB drug, not including the combination of isoniazid and rifampin
- Multidrug-resistant tuberculosis (MDR-TB): Resistance to isoniazid AND rifampin with or without resistance to other anti-TB drugs; and
- Extensively drug-resistant tuberculosis (XDR-TB): Resistance to isoniazid AND rifampin AND any fluoroquinolone AND at least one of the three injectable second-line drugs (amikacin, capreomycin or kanamycin)
Data sources
Data were derived and analyzed from two surveillance systems, the Canadian Tuberculosis Laboratory Surveillance System (CTBLSS) and the Canadian Tuberculosis Reporting System (CTBRS).
Canadian Tuberculosis Laboratory Surveillance System
The CTBLSS is an isolate-based laboratory surveillance system. Isolates from culture-positive TB cases undergo drug susceptibility testing (DST), and the results are reported to PHAC on a voluntary basis by the testing laboratory.
This current article includes the DST results for first-line drugs, and others if required, as well as sex, age and province/territory of the individual from whom the sample originated. To the extent possible, only one set of DST results per case was included in the analysis; we identified potential duplicates using sex, date of birth or age and the province/territory and clarified these with the submitting laboratory. Isolate counts were verified by the submitting laboratories to ensure report completion and to clarify any data inconsistencies.
Canadian Tuberculosis Reporting System
Whereas the CTBLSS collects data on M. tuberculosis isolates, the CTBRS is a case-based surveillance system with information on active and retreatment TB cases in Canada. The CTBRS collects some drug resistance data on TB cases when provincial and territorial health authorities report these cases to PHAC.
In the current article, we used information from CTBRS to obtain data on origin, which is defined here as either foreign-born, Canadian-born Indigenous or Canadian-born non-Indigenous. Further information on the CTBRS system can be found in Tuberculosis in Canada, 2012 Footnote 5. The most recent data available for this analysis were for 2015.
Data analysis
Data were cleaned and analyzed using SAS Enterprise Guide 5.1 (Cary, North Carolina, United States [US]) and Microsoft Excel 2010 (Redmond, Washington, US). Any TB isolates that were demonstrated as positive for Mycobacterium tuberculosis complex on culture, specifically M. tuberculosis, M. africanum, M. canetti, M. caprae, M. microti, M. pinnipedii or M. bovis, were included in the analyses. TB isolates that were positive for M. bovis Bacille Calmette Guérin (BCG) were excluded from the analyses.
Descriptive analyses of the resistance data, geographic and demographic data for 2017 and data on origin from 2015 were completed. These analyses were then compared with the trends from the previous 10 years.
Results
Anti-TB drug resistance patterns
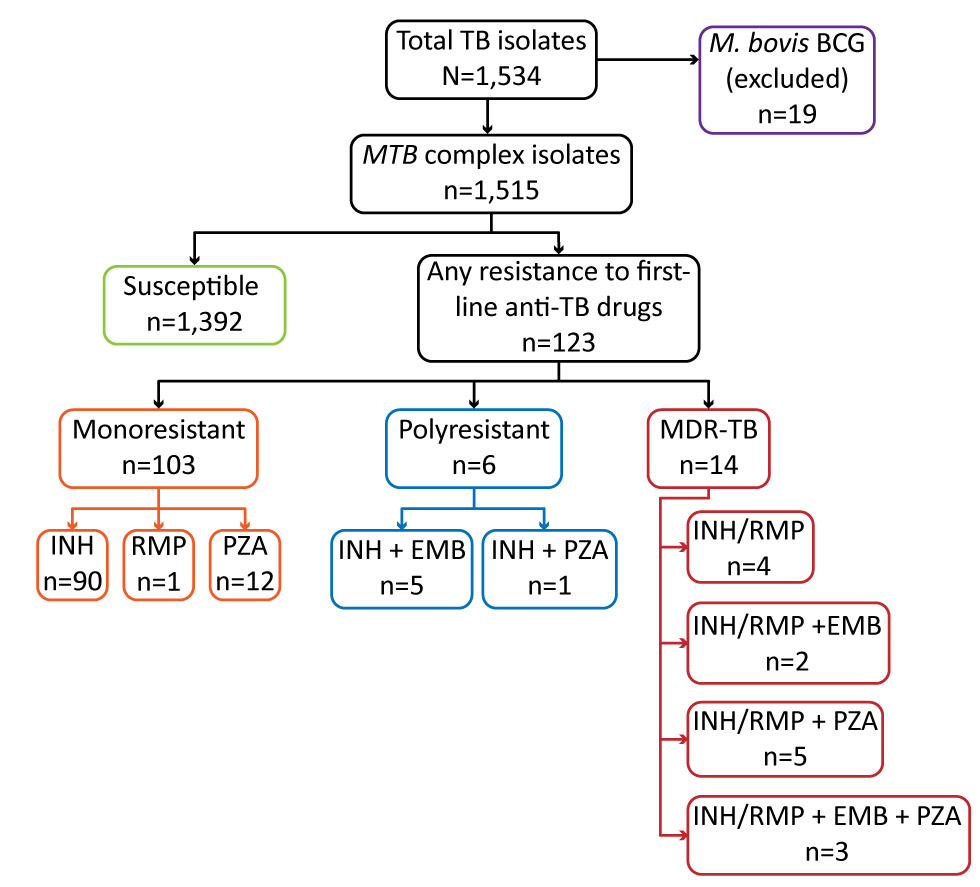
In 2017, DST results from 1,534 isolates were reported to PHAC. Of these, 19 were M. bovis BCG and were not included in the analysis (Figure 1). Of all 1,515 isolates included, 123 (8.1%) showed resistance to any of the first-line anti-TB drugs and 1,392 (91.9%) were sensitive to all first-line anti-TB drugs.
Figure 1: Number of tuberculosis isolates tested for anti-TB drug susceptibility and results, Canada, 201
Text description: Figure 1
Figure 1: Number of tuberculosis isolates tested for anti-TB drug susceptibility and results, Canada, 2017
Figure 1 is a flowchart depicting the number of tuberculosis isolates tested for anti-TB drug susceptibility and results for Canada in 2017. The first box is the total TB isolates N=1,534, with an arrow pointing right to a text box noting M. bovis BCG (excluded) n=19. Immediately below Total isolates box is a text box noting MTB complex isolates n=1,515. Immediately below, it branches off into to a text box to the left, Susceptible n=1,392, and the text box to the right notes any resistance to first line anti-TB drugs n=123. From this box, it then branches down into three text boxes; Monoresistant; Polyresistant and MDR-TB. Under Monoresistant n=103 are three additional text boxes; INH n=90, RMP n=1, and PZA n=12. Under Polyresistant n=6, there are two additional text boxes; INH + EMB n=5 and INH + PZA n=1. Under the MDR-TB n=14 are four boxes; INH/RMP n=4, INH/RMP + EMB n=2, INH/RMP + PZA n=5 and INH/RMP + EMB + PZA n=3.
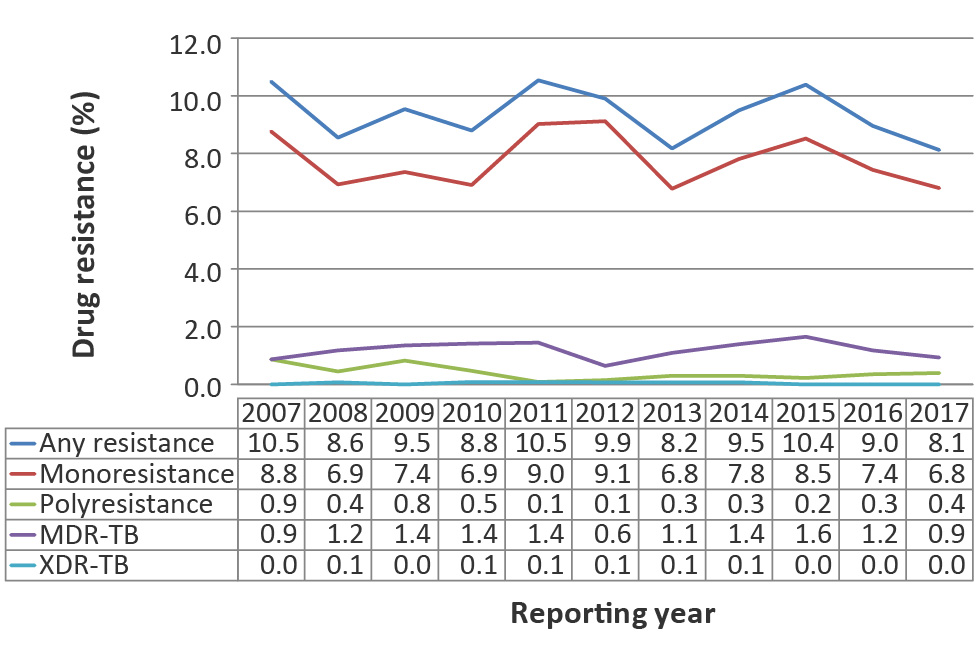
While the number of culture-positive TB isolates receiving DST has risen slightly overall since 2007 (from 1,267 isolates), the number of reported isolates with drug resistance to any anti-TB drug has fluctuated from year to year, resulting in an overall small decrease in the percentage of isolates with reported drug resistance (from 10.5% in 2007 to 8.1% in 2017) (Figure 2).
Figure 2: Proportion of tuberculosis isolates with reported drug resistance by drug resistance pattern, Canada, 2007–2017
Text description: Figure 2
| Drug resistance (%) | Reporting Year | ||||||||||
|---|---|---|---|---|---|---|---|---|---|---|---|
| 2007 | 2008 | 2009 | 2010 | 2011 | 2012 | 2013 | 2014 | 2015 | 2016 | 2017 | |
| Any resistance | 10.5 | 8.6 | 9.5 | 8.8 | 10.5 | 9.9 | 8.2 | 9.5 | 10.4 | 9.0 | 8.1 |
| Monoresistance | 8.8 | 6.9 | 7.4 | 6.9 | 9.0 | 9.1 | 6.8 | 7.8 | 8.5 | 7.4 | 6.8 |
| Polyresistance | 0.9 | 0.4 | 0.8 | 0.5 | 0.1 | 0.1 | 0.3 | 0.3 | 0.2 | 0.3 | 0.4 |
| MDR-TB | 0.9 | 1.2 | 1.4 | 1.4 | 1.4 | 0.6 | 1.1 | 1.4 | 1.6 | 1.2 | 0.9 |
| XDR-TB | 0.0 | 0.1 | 0.0 | 0.1 | 0.1 | 0.1 | 0.1 | 0.1 | 0.0 | 0.0 | 0.0 |
Monoresistance
Monoresistance was the most commonly reported resistance pattern. Of the isolates that were resistant to any first-line anti-TB drug in 2017, 103 (83.7%) were monoresistant. Of those, 90 were resistant to only isoniazid, 12 to only pyrazinamide and one to only rifampin. No isolates were monoresistant to ethambutol (Figure 1). This is consistent with previous data; since 2015, there has been a slight downward trend between 2007 and 2017 (Figure 2).
Polyresistance
In 2017, six isolates (0.4%) were polyresistant: five were resistant to the combination of isoniazid and ethambutol, and one was resistant to isoniazid and pyrazinamide (Figure 1). Compared with previous years, the percentage of isolates that were polyresistant has remained low (Figure 2).
MDR-TB and XDR-TB
In 2017, 14 (0.9%) isolates were identified as resistant to both isoniazid and rifampin (with or without resistance to other anti-TB drugs) and therefore considered to be MDR-TB. Of these, four were resistant to the combination of isoniazid and rifampin; five were resistant to isoniazid, rifampin and pyrazinamide; and two were resistant to isoniazid, rifampin and ethambutol. Three isolates were resistant to all four first-line drugs (Figure 1). Between 2007 and 2017, 172 (1.1%) TB isolates were reported as MDR-TB, with the percentage reported being low and the overall trend stable during this time (Figure 2).
No isolates were reported as XDR-TB in Canada in 2017. Although two isolates were resistant to isoniazid, rifampin and any fluoroquinolone, and another two were resistant to isoniazid, rifampin and at least one of the injectable anti-TB drugs, none were resistant to the combination of all four. Since 2007, only six isolates have tested positive for XDR-TB in Canada; the most recent was reported in 2014.
Geographic Distribution
In 2017, Ontario reported the largest number of isolates (559 isolates; 36.9%), followed by 260 (17.2%) in British Columbia, 199 (13.1%) in Alberta, 183 (12.1%) in Quebec, 157 (10.4%) in Manitoba, 64 (4.2%) in Saskatchewan and 60 (4.0%) in Nunavut. Newfoundland and Labrador, Nova Scotia, New Brunswick, Yukon and Northwest Territories accounted for 2.2% of the total isolates tested in 2017. Compared to 2016, Nunavut submitted almost twice as many isolates for DST in 2017, likely due to increased cases of TB in that jurisdiction Footnote 6. There were no reported cases of TB in Prince Edward Island in 2017.
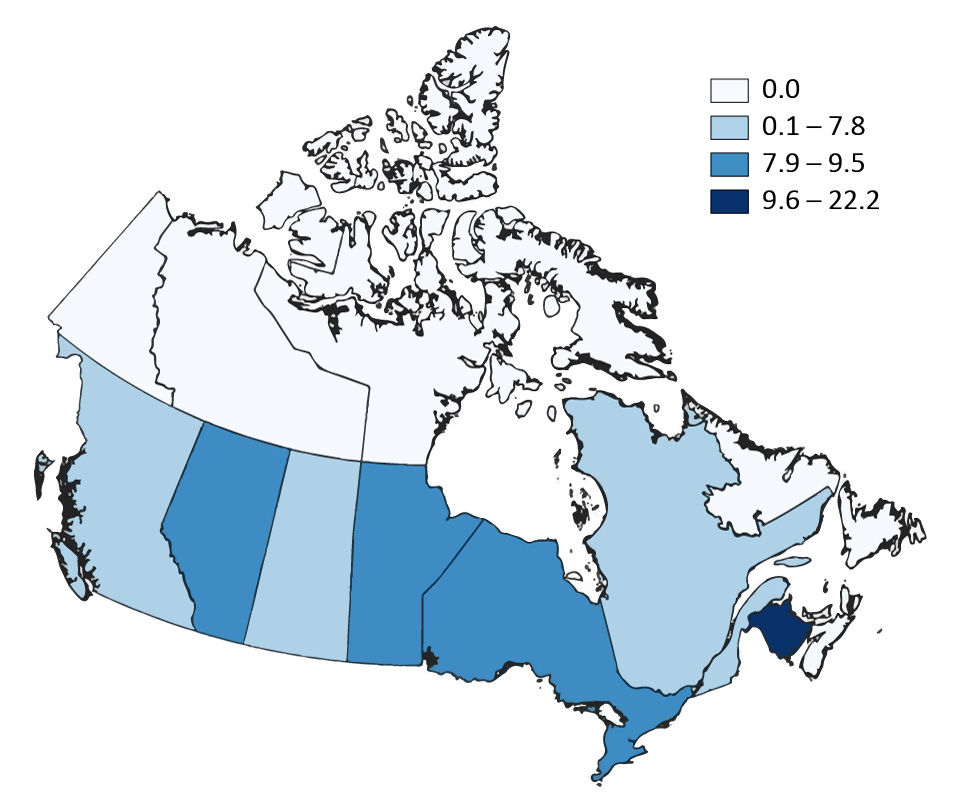
Of all the provinces and territories, British Columbia, Alberta, Saskatchewan, Manitoba, Ontario, Quebec and New Brunswick reported some type of drug resistance in 2017 (Figure 3). For British Columbia, Alberta, Saskatchewan, Manitoba, Ontario and Quebec, the proportion of isolates with any anti-TB drug resistance ranged from 6.9% to 9.5%. Of the nine isolates submitted by New Brunswick, two were reported to demonstrate anti-TB drug resistance (22.2%). No drug-resistant isolates were reported from Nunavut, Newfoundland and Labrador, Nova Scotia, Yukon and Northwest Territories in 2017.
Figure 3. Proportion (%) of isolates demonstrating any anti-TB drug resistance by province/territory, Canada, 2017
Text description: Figure 3
| Canada 2017 | Province/Territory | ||||||||||||
|---|---|---|---|---|---|---|---|---|---|---|---|---|---|
| N.L. | P.E.I. | N.S. | N.B. | QC | Ont. | Man. | Sask. | Alta. | B.C. | Y.T. | N.W.T. | Nvt. | |
| Proportion | 0.0 | 0.0 | 0.0 | 22.2 | 7.7 | 9.1 | 8.9 | 7.8 | 9.5 | 6.9 | 0.0 | 0.0 | 0.0 |
Of the 14 total MDR-TB isolates reported in 2017, Ontario accounted for seven isolates, New Brunswick, Quebec and British Columbia each reported two, and Alberta reported one isolate.
Distribution by sex
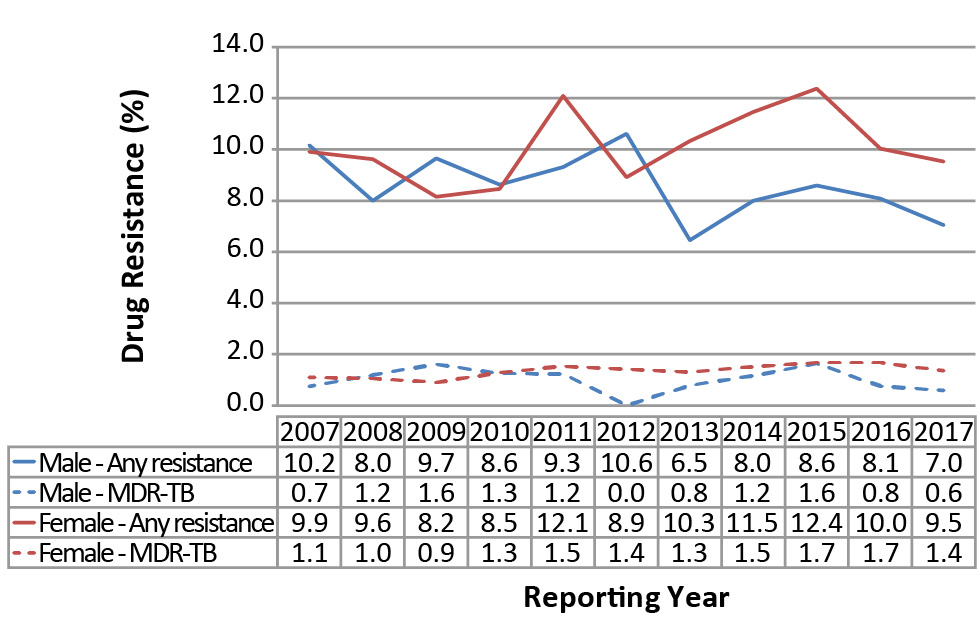
In 2017, 60 (7.0%) of the isolates from males and 63 (9.5%) of the isolates from females had any resistance to first-line drugs (Figure 4). The percentage of isolates with any resistance to first-line drugs has fluctuated by sex since 2007. However, overall, the percentage has decreased among males (68 isolates; 10.2%), with a similar decrease showing among females (54 isolates; 9.5%). Between 2007 and 2012, the percentage of isolates reported with any drug resistance among males and females was similar, but since that time, a larger proportion of isolates from females had any drug resistance (Figure 4). Of the 14 MDR-TB isolates, five were from males and nine were from females. The percentage of isolates in both sexes identified as MDR-TB remained low and stable from 2007 through 2017, ranging from 0.1% to 1.6% of isolates from males and from 0.9% to 1.7% in isolates from females. For XDR-TB reported from 2007 through 2017, there were only six isolates total; five were from females.
Figure 4: Percentage of tuberculosis isolates with reported drug resistance by sex and resistance pattern, Canada, 2007–2017
Text description: Figure 4
| Gender | Reporting Year | ||||||||||
|---|---|---|---|---|---|---|---|---|---|---|---|
| 2007 | 2008 | 2009 | 2010 | 2011 | 2012 | 2013 | 2014 | 2015 | 2016 | 2017 | |
| Male – Any resistance | 10.2 | 8.0 | 9.7 | 8.6 | 9.3 | 10.6 | 6.5 | 8.0 | 8.6 | 8.1 | 7.0 |
| Male – MDR-TB | 0.7 | 1.2 | 1.6 | 1.3 | 1.2 | 0.0 | 0.8 | 1.2 | 1.6 | 0.8 | 0.6 |
| Female – Any resistance | 9.9 | 9.6 | 8.2 | 8.5 | 12.1 | 8.9 | 10.3 | 11.5 | 12.4 | 10.0 | 9.5 |
| Female - MDR-TB | 1.1 | 1.0 | 0.9 | 1.3 | 1.5 | 1.4 | 1.3 | 1.5 | 1.7 | 1.7 | 1.4 |
Distribution by age
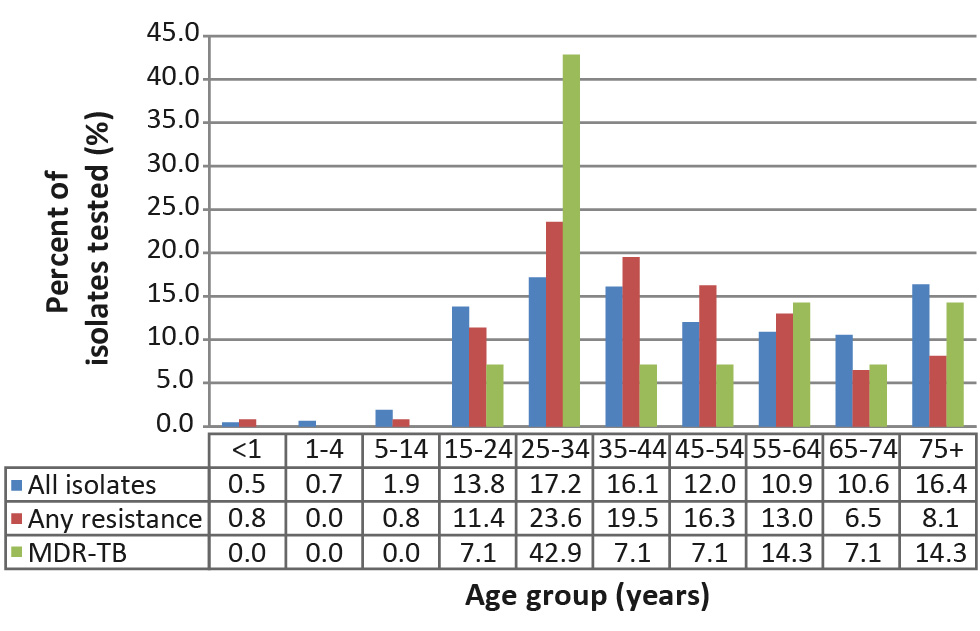
Isolates from individuals under 15 years of age represented a very small proportion of the total tested and those with any drug resistance in 2017 (Figure 5). Only 46 (3%) of the isolates were from this age group with two having any drug resistance, neither of which was MDR-TB. In contrast, isolates from the 25–34 year age group represented the largest proportion tested (260 isolates; 17.2%) and the largest proportion with any drug resistance (29 isolates; 23.6%) and MDR-TB (six isolates; 42.9%).
In all other age groups, the number of total isolates ranged from 160 (10.6%) among those aged 65–74 to 248 (16.4%) among those aged 75+. The percentage of isolates with any resistance ranged from 6.5% (eight isolates) among those aged 65–74 to 19.5% (24 isolates) among those aged 35–44. The number of MDR-TB isolates ranged from one among the 15–24, 35–44, 45–54 and 65–74 age groups, respectively to two among the 55–64 and 75+ age groups, respectively.
Figure 5: Percentage of tuberculosis isolates with reported drug resistance, by age group and resistance pattern, Canada, 2017
Text description: Figure 5
| Isolates | PERCENTAGE | |||||||||
|---|---|---|---|---|---|---|---|---|---|---|
| Less than 1 | 1-4 | 5-14 | 15-24 | 25-34 | 35-44 | 45-54 | 55-64 | 65-74 | 75 and over | |
| All isolates | 0.5 | 0.7 | 1.9 | 13.8 | 17.2 | 16.1 | 12.0 | 10.9 | 10.6 | 16.4 |
| Any resistance | 0.8 | 0.0 | 0.8 | 11.4 | 23.6 | 19.5 | 16.3 | 13.0 | 6.5 | 8.1 |
| MDR-TB | 0.0 | 0.0 | 0.0 | 7.1 | 42.9 | 7.1 | 7.1 | 14.3 | 7.1 | 14.3 |
Distribution by origin
There were 9,745 cases of the foreign-born cases with active culture-positive TB reported to the CTBRS between 2005 and 2015, 1,050 (11%) had any resistance to first-line anti-TB drugs and 151 (1.5%) were MDR-TB. There were 2,711 of Canadian-born Indigenous TB cases, 67 (2%) had any resistance and none were MDR-TB. Among the 1,588 of Canadian-born non-Indigenous TB cases, 149 (9%) had reported resistance to at least one of the first-line anti-TB drugs and seven (0.5%) were MDR-TB. Of all the TB cases reported to be MDR-TB, 96% were foreign born and 4% were Canadian-born or non-Indigenous.
See Appendix for a list supplementary tables that are available upon request.
Discussion
In Canada, the rates of drug resistance among culture-positive TB isolates remained relatively low in 2017. Of these isolates, 8.1% were resistant to any of the first-line anti-TB drugs and 0.9% were MDR-TB. No isolates of XDR-TB have been reported in Canada since 2014. The rates of TB drug resistance between 2007 and 2017 remained relatively low. While there was an increase in the number of culture-positive TB isolates reported in 2017 compared to 2007, the proportion of isolates with resistance to at least one of the first-line anti-TB drugs decreased over time.
In general, trends in TB drug resistance tend to echo the overall trends in active TB cases in Canada reported in the CTBRS. Ontario continues to have the majority of isolates and positives for drug resistance, as well as the largest reported number of active TB cases in Canada. This is not surprising as Ontario has the largest population of all the Canadian provinces/territories and receives the highest percentage of immigrants to Canada annually (39.0% of immigrants to Canada in 2016) Footnote 7.
About half the provinces/territories have not reported any MDR-TB cases between 2007 and 2017 (Yukon, Northwest Territories, Nunavut, Nova Scotia, Prince Edward Island, Newfoundland and Labrador). These provinces/territories have small populations and constitute a small number of the overall TB cases reported in Canada annually. Similar to all TB cases reported in Canada Footnote 2, drug resistance continued to be most frequently reported among isolates from persons aged 25–34 (42.9% of MDR-TB).
Foreign-born individuals comprised 71% of the total TB cases reported in Canada in 2015 Footnote 8, and also constituted a larger proportion of cases of MDR-TB (96%). This may be due to incomplete treatment from a previous episode of TB or the acquisition of a drug-resistant strain in their countries of origin Footnote 4.
This surveillance report is subject to a few limitations. In terms of data quality, there is the potential of reported errors, missing data and duplicates; however, every effort has been made to identify and remove additional isolate results per individual and to correct errors through multiple rounds of validation by submitting laboratories. As the CTBLSS is a laboratory-based surveillance system, limited demographic information is available, and the isolates reported are not able to be directly linked to case-based surveillance data from the CTBRS. Therefore, we are currently not able to describe the CTBLSS data further by ethnic origin, country of birth or treatment outcomes, as is done by other countries and organizations Footnote 1Footnote 9Footnote 10. In an effort to provide a more complete epidemiological picture of TB drug resistance in Canada, CTBRS data were used to describe TB cases with drug resistance by ethnic origin. Drug resistance information reported in CTBRS is fairly complete (98%) Footnote 11 and reasonably comparable to the CTBLSS, although some discrepancies may exist between the two which cannot be resolved.
Drug resistance remains a concern worldwide as MDR-TB continues to spread globally Footnote 1. In Canada, despite drug resistance rates remaining consistently low, monitoring emerging trends and patterns in TB drug resistance continues to be important, as the potential for importing drug-resistant TB into Canada remains a possibility. The CTBLSS will continually be updated as newer technology for detecting drug resistance (e.g. whole genome sequencing) and drugs for TB treatment (e.g. bedaquiline, delaminid) become available.
Authors’ statement
ML – Conceptualization, methodology, software, validation, formal analysis, writing (original draft)
HH – Conceptualization, software, validation, formal analysis, writing (review) and editing
JV – Conceptualization, writing (review) and editing, supervision
Conflict of interest
None.
Acknowledgements
The Surveillance and Epidemiology Division, Centre for Communicable Diseases and Infection Control at the Public Health Agency of Canada would like to acknowledge the members of the Canadian Tuberculosis Laboratory Technical Network and their teams as well as colleagues at the National Microbiology Laboratory for this contribution to and participation in the Canadian Tuberculosis Laboratory Surveillance System.
Funding
This work was supported by the Public Health Agency of Canada as part of its core mandate.
Appendix: List of supplementary tables available upon request
Supplementary Table 1: Total number and percentage of Mycobacterium tuberculosis complex isolates identified with any resistance, as multidrug and extensively drug resistant, by year, 2007-2017, Canada
Supplementary Table 2: Overall pattern of reported tuberculosis drug resistance in Canada, 2007 to 2017
Supplementary Table 3: Results for routine to anti-tuberculosis drug susceptibility testing of Mycobacterium tuberculosis complex isolates originating from Alberta, 2007 to 2017
Supplementary Table 4: Results for routine to anti-tuberculosis drug susceptibility testing of Mycobacterium tuberculosis complex isolates originating from British Columbia, 2007 to 2017
Supplementary Table 5: Results for routine to anti-tuberculosis drug susceptibility testing of Mycobacterium tuberculosis complex isolates originating from Manitoba, 2007 to 2017
Supplementary Table 6: Results for routine to anti-tuberculosis drug susceptibility testing of Mycobacterium tuberculosis complex isolates originating from New Brunswick, 2007 to 2017
Supplementary Table 7: Results for routine to anti-tuberculosis drug susceptibility testing of Mycobacterium tuberculosis complex isolates originating from Newfoundland and Labrador, 2007 to 2017
Supplementary Table 8: Results for routine to anti-tuberculosis drug susceptibility testing of Mycobacterium tuberculosis complex isolates originating from Northwest Territories, 2007 to 2017
Supplementary Table 9: Results for routine to anti-tuberculosis drug susceptibility testing of Mycobacterium tuberculosis complex isolates originating from Nova Scotia, 2007 to 2017
Supplementary Table 10: Results for routine to anti-tuberculosis drug susceptibility testing of Mycobacterium tuberculosis complex isolates originating from Nunavut, 2007 to 2017
Supplementary Table 11: Results for routine to anti-tuberculosis drug susceptibility testing of Mycobacterium tuberculosis complex isolates originating from Ontario, 2007 to 2017
Supplementary Table 12: Results for routine to anti-tuberculosis drug susceptibility testing of Mycobacterium tuberculosis complex isolates originating from Prince Edward Island, 2007 to 2017
Supplementary Table 13: Results for routine to anti-tuberculosis drug susceptibility testing of Mycobacterium tuberculosis complex isolates originating from Quebec, 2007 to 2017
Supplementary Table 14: Results for routine to anti-tuberculosis drug susceptibility testing of Mycobacterium tuberculosis complex isolates originating from Saskatchewan, 2007 to 2017
Supplementary Table 15: Results for routine to anti-tuberculosis drug susceptibility testing of Mycobacterium tuberculosis complex isolates originating from Yukon, 2007 to 2017
Supplementary Table 16: Multidrug-resistant tuberculosis and extensively drug-resistant tuberculosis isolates by province/territory of origin, 2017
Supplementary Table 17: Total number of Mycobacterium tuberculosis complex isolates by reporting and originating province/territory, 2017
Supplementary Table 18: Provincial/territorial breakdown by any resistance, multidrug-resistant tuberculosis and extensively drug-resistant tuberculosis in Canada, 2007 to 2017
Supplementary Table 19: Tuberculosis drug resistance by sex and age group in Canada, 2017