
Archived - Clostridioides difficile infections in Canada

 Download this article as a PDF
Published by: The Public Health Agency of Canada
Issue: Volume 45-7/8: Zoonotic diseases
Date published: July 4, 2019
ISSN: 1481-8531
Submit a manuscript
About CCDR
Browse
Volume 45-7/8, July 4, 2019: Zoonotic diseases
Surveillance
Epidemiology of Clostridioides difficile infection in Canada: A six-year review to support vaccine decision-making
Y Xia1,2, MC Tunis3, C Frenette4, K Katz5, K Amaratunga6,7, S Rhodenizer Rose8, A House3, C Quach1,2,9,10
Affiliations
1 Department of Epidemiology, Biostatistics, and Occupational Health, McGill University, Montreal, QC
2 Infection Prevention and Control, Department of Pediatrics, CHU Sainte-Justine, Montreal, QC
3 Centre for Immunization and Respiratory Infectious Diseases, Public Health Agency of Canada, Ottawa, ON
4 Department of Laboratory Medicine, McGill University Health Centre, Montreal, QC
5 North York General Hospital, Toronto, ON
6 Centre for Communicable Diseases and Infection Control, Public Health Agency of Canada, Ottawa, ON
7 Department of Medicine, Division of Infectious Diseases, University of Ottawa, Ottawa, ON
8 Infection Prevention and Control Canada, Halifax, NS
9 Department of Microbiology, Infectious Diseases, and Immunology, University of Montreal, Montreal, QC
10 Department of Pediatric Laboratory Medicine, CHU Sainte-Justine, Montreal, QC
Correspondence
Suggested citation
Xia Y, Tunis MC, Frenette C, Katz K, Amaratunga K, Rhodenizer Rose S, House A, Quach C. Epidemiology of Clostridioides difficile infection in Canada: A six-year review to support vaccine decision-making. Can Commun Dis Rep 2019;45(7/8):191–211. https://doi.org/10.14745/ccdr.v45i78a04
Keywords: epidemiology, vaccine, C. difficile, surveillance, definitions, burden of illness
Abstract
Background: Two vaccines against Clostridioides difficile infections (CDI) are currently in phase III trials. To enable decision-making on their use in public health programs, national disease epidemiology is necessary.
Objectives: To determine the epidemiology of hospital-acquired CDI (HA-CDI) and community-associated CDI (CA-CDI) in Canada using provincial surveillance data and document discrepancies in CDI-related definitions among provincial surveillance programs.
Methods: Publicly-available CDI provincial surveillance data from 2011 to 2016 that distinguished between HA-CDI and CA-CDI were included and the most common surveillance definitions for each province were used. The HA-, CA-CDI incidence rates and CA-CDI proportions (%) were calculated for each province. Both HA- and CA-CDI incidence rates were examined for trends. Types of disparities were summarized and detailed discrepancies were documented.
Results: Canadian data were analyzed from nine provinces. The HA-CDI rates ranged from 2.1/10,000 to 6.5/10,000 inpatient-days, with a decreasing trend over time. Available data on CA-CDI showed that both rates and proportions have been increasing over time. Discrepancies among provincial surveillance definitions were documented in CDI case classifications, surveillance populations and rate calculations.
Conclusion: In Canada overall, the rate of HA-CDI has been decreasing and the rate of CA-CDI has been increasing, although this calculation was impeded by discrepancies in CDI-related definitions among provincial surveillance programs. Nationally-adopted common definitions for CDI would enable better comparisons of CDI rates between provinces and a calculation of the pan-Canadian burden of illness to support vaccine decision-making.
Introduction
Clostridioides difficile is the most frequent cause of healthcare-associated infectious diarrhea in Canada and other industrialized countriesFootnote 1. In the United States, it affects more than 300,000 hospitalized patients yearlyFootnote 2. Symptoms of C. difficile infection (CDI) range from mild diarrhea to severe life-threatening inflammation of the colonFootnote 3. In Canada, many provinces initiated CDI surveillance programs following a dramatic increase in incidence and severity in the early 2000s, and in response to CDI becoming a national notifiable disease in 2009Footnote 4. In parallel, the Canadian Nosocomial Infections Surveillance Program (CNISP) networkFootnote 2, a sentinel network of 67 primarily tertiary teaching hospitals in urban centers, has participated in hospital-acquired and community-associated CDI surveillanceFootnote 5. Most provinces use hospital-acquired CDI as one of the indicators assessing health system performance and patient safety. The main objective of provincial surveillance programs is to determine the incidence of hospital-acquired CDI and to monitor trends and patterns in CDI over time, in order to prevent and control diseaseFootnote 6Footnote 7Footnote 8Footnote 9Footnote 10Footnote 11Footnote 12Footnote 13Footnote 14. However, in 2015, the Canadian Communicable Disease Steering Committee’s Antimicrobial Resistance Surveillance Task Group identified several surveillance gaps in CDI surveillance activities, most notably gaps in data from community settingsFootnote 4Footnote 15.
Two C. difficile vaccines are currently in phase III trials worldwideFootnote 16Footnote 17. To enable decision-making on the potential use of these vaccines in public health programs, considering the Erickson-DeWals-Farand analytical frameworkFootnote 18 and methods of the National Advisory Committee on ImmunizationFootnote 19 for immunization programs decisions in Canada, national disease epidemiology is a critical factor. Although the Public Health Agency of Canada provides annual national healthcare-associated CDI surveillance reports, the data are primarily derived from large, tertiary acute care hospitals and may not be representative of all hospital types and jurisdictionsFootnote 5Footnote 20. There has never been a study conducted systematically on provincial CDI surveillance programs in Canada. Additionally, since healthcare—and thus hospital-acquired infection—is under provincial/territorial jurisdiction, discrepancies in definitions, surveillance methodologies, available laboratory diagnostics and variation in the validation of surveillance programs may exist, hence rendering inter-provincial/territorial comparison difficult.
The objectives of this study were to determine the epidemiology of hospital-acquired CDI (HA-CDI) and community-associated CDI (CA-CDI) as it pertains to Canada, using provincial surveillance data from 2011 to 2016 and to document discrepancies in CDI-related definitions among the provincial surveillance programs.
Methods
Study population
The study population included fiscal-year C. difficile infection surveillance in Canada from 2011 to 2016 at the provincial/territorial level. All of Canada’s provinces and territories were potential participants in the study. To be included, the jurisdiction needed to have a surveillance system that distinguished between HA-CDI and CA-CDI.
Definitions
The definitions related to CDI have been well-describedFootnote 6Footnote 7Footnote 8Footnote 9Footnote 10Footnote 11Footnote 12Footnote 13Footnote 14. For the purpose of this study, definitions for HA-CDI and CA-CDI used included the most common descriptions shared by the ten provinces (Text box). The HA-CDI and CA-CDI definitions, case classification, population surveilled, denominator definition and sources, and laboratory confirmation requirements were extracted separately from provincial protocols for comparison. Surveillance definitions varied from province to province and type of discrepancies were summarized.
Definitions
Hospital-acquired Clostridium difficile infection (HA-CDI)
HA-CDI was defined as:
- a primary CDI case in an inpatient, with symptom onset at least 72 hours, or more than three calendar days, after admission to the reporting facility
OR
- a primary CDI case, with symptom onset in the community or occurring less than 72 hours or less than or equal to three calendar days after admission to the reporting facility, who was discharged from the reporting facility in the four weeks prior to the current hospitalizationFootnote 6Footnote 7Footnote 8Footnote 9Footnote 10Footnote 11Footnote 12Footnote 13Footnote 14
Community-associated Clostridium difficile infection (CA-CDI)
CA-CDI was defined as:
- CDI case with symptom onset in the community
OR
- occurring less than or equal to 72 hours or less than or equal to three calendar days after admission to a healthcare facility, provided that symptom onset was more than four weeks after the patient was discharged from any healthcare facility
Data collection
Data were extracted from provincial public reports retrieved from the Internet in July 2018. Data missing (i.e. number of HA-CDI cases and total inpatient days for Nova Scotia) were requested via email directly from the provinces (i.e. Nova Scotia’s Freedom of Information and Protection of Privacy Act) in June/July 2018, with answers received in July 2018. For more specific data on the search strategy, please refer to Appendix A. All data were published or requested through legal access with the consent of the province.
Statistical analysis
When available, HA-CDI incidence rates per 10,000 inpatient-days, pooled HA-CDI incidence rates per 10,000 inpatient days, CA-CDI incidence rates per 100,000 population and CA-CDI proportions (%) were recorded. If no incidence rates existed in the provincial reports, the HA-CDI incidence rates and CA-CDI incidence rates were calculated from available data. Pooled HA-CDI incidence rates for the entire study period were calculated for each province. The CA-CDI proportions were generated for provinces with numbers of CA-CDI cases and total CDI cases available. Both HA-CDI incidence rates and CA-CDI incidence rates were examined for trends.
Pooled HA-CDI incidence rates and HA-CDI incidence rates were generated based on the following formula: (total number of HA-CDI cases/total inpatient days) × 10,000. Other than provinces with available total inpatient-days data used for calculating incidence rates, the denominator of that formula was back-calculated using the following formula: (number of HA-CDI cases/HA-CDI rate) × 10,000. Similarly, CA-CDI incidence rates were computed using the following formula: (total number of CA-CDI cases/mid-year population) × 100,000 (mid-year data from July 1). The CA-CDI proportions were calculated using the following formula: total number of CA-CDI/total number of CDI cases reported in the province × 100%.
Results
Based on the inclusion criteria, the study included nine of the 10 provinces and no territories. One province was excluded because its surveillance system did not distinguish between HA-CDI and CA-CDI. The territories were excluded as they did not have existing CDI surveillance programs.
Hospital-acquired incidence rates
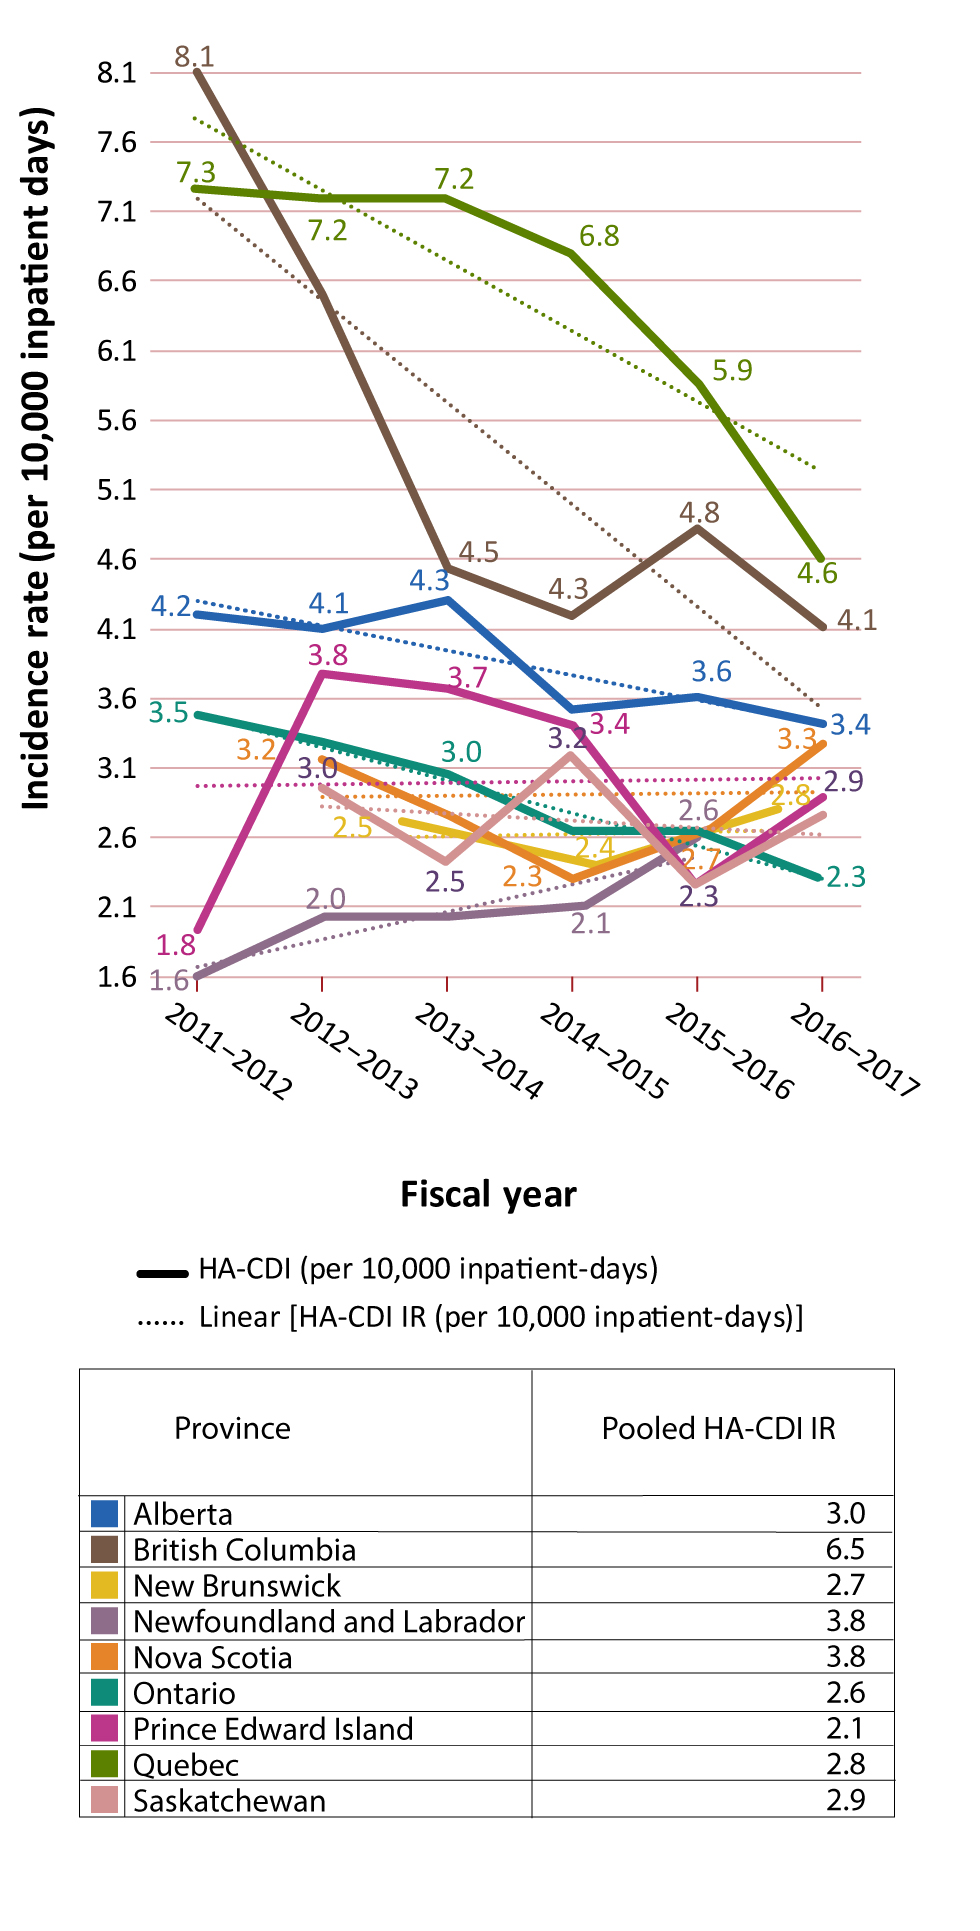
The HA-CDI incidence rates by year and province and pooled HA-CDI incidence rates are presented in Table 1 with additional detail in Appendix B. The HA-CDI incidence rates by year indicated that, for almost all provinces, trendlines had been decreasing. In contrast, rates in Newfoundland and Labrador had been increasing, rates in Prince Edward Island had been rising slightly and no obvious trends were seen for New Brunswick and Nova Scotia. Pooled HA-CDI incidence rates showed that Quebec and British Columbia had relatively higher rates, at 6.5/10,000 and 5.3/10,000 inpatient-days, respectively, followed by Alberta (3.8/10,000 inpatient-days) and Prince Edward Island (3.0/10,000 inpatient-days) (Appendix C: Figure C-1). The other provinces (Ontario, Nova Scotia, Saskatchewan, New Brunswick and Newfoundland and Labrador) each had rates of less than 3/10,000 inpatient-days
| Prov. | Fiscal yearFootnote a of Table 1 | Pooled rateFootnote b of Table 1 | |||||
|---|---|---|---|---|---|---|---|
| 2011–2012 | 2012–2013 | 2013–2014 | 2014–2015 | 2015–2016 | 2016–2017 | ||
| ABFootnote c of Table 1 | 4.2 | 4.1 | 4.3 | 3.5 | 3.6 | 3.4 | 3.8 |
| BCFootnote c of Table 1 | 8.1 | 6.5 | 4.5 | 4.2 | 4.8 | 4.1 | 5.3 |
| NBFootnote c of Table 1 | - | - | 2.7 | 2.4 | 2.8 | - | 2.6 |
| NLFootnote c of Table 1 | 1.6 | 2.0 | 2.0 | 2.1 | 2.6 | - | 2.1 |
| NSFootnote d of Table 1 | - | 3.2Footnote c of Table 1 | 2.8 | 2.3 | 2.7 | 3.3 | 2.8 |
| ONFootnote b of Table 1 | 3.5 | 3.3 | 3.0 | 2.6 | 2.6 | 2.3 | 2.9 |
| PEFootnote b of Table 1 | 1.8 | 3.8 | 3.7 | 3.4 | 2.3 | 2.9 | 3.0 |
| QCFootnote b of Table 1 | 7.3 | 7.2 | 7.2 | 6.8 | 5.9 | 4.6 | 6.5 |
| SKFootnote c of Table 1 | - | 3.0 | 2.5 | 3.2 | 2.3 | 2.8 | 2.7 |
Community-associated incidence rates
Only Alberta, British Columbia, Newfoundland and Labrador, Prince Edward Island, Quebec and Saskatchewan had publicly-accessible CA-CDI data. Alberta was excluded from this part of the study, since it posted only rates and utilized a unit that was different from the one used in this study (per 100,000 population versus per 1,000 admissions).
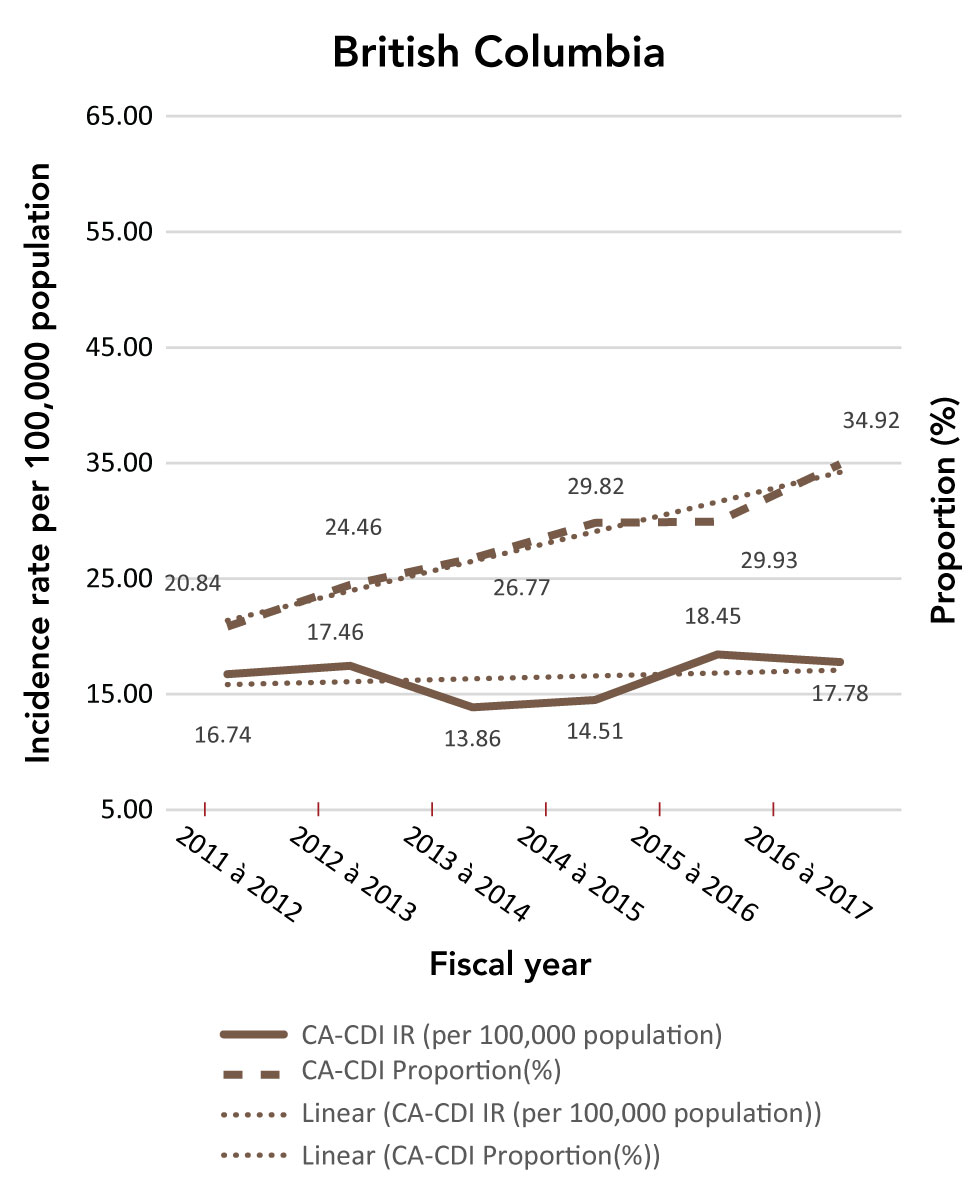
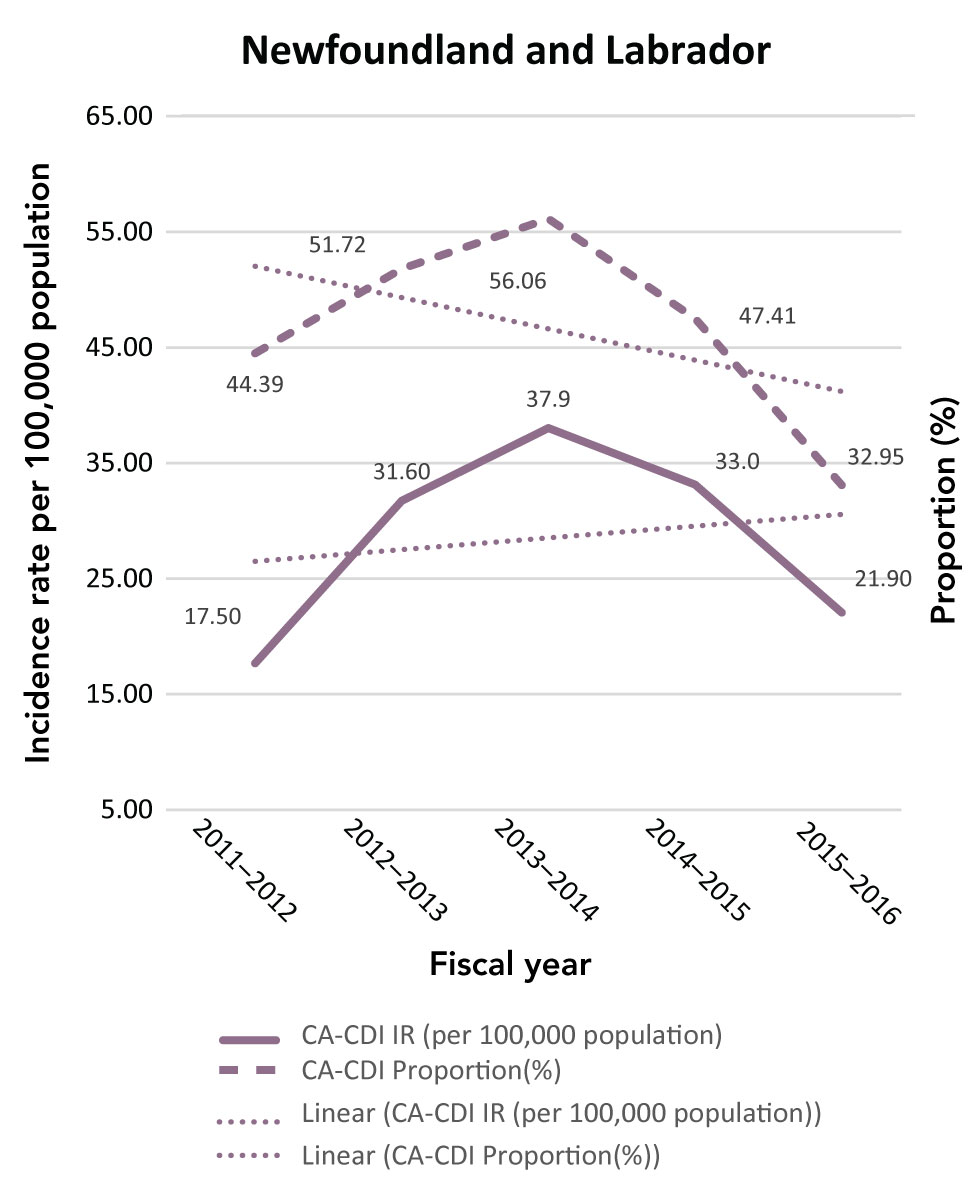
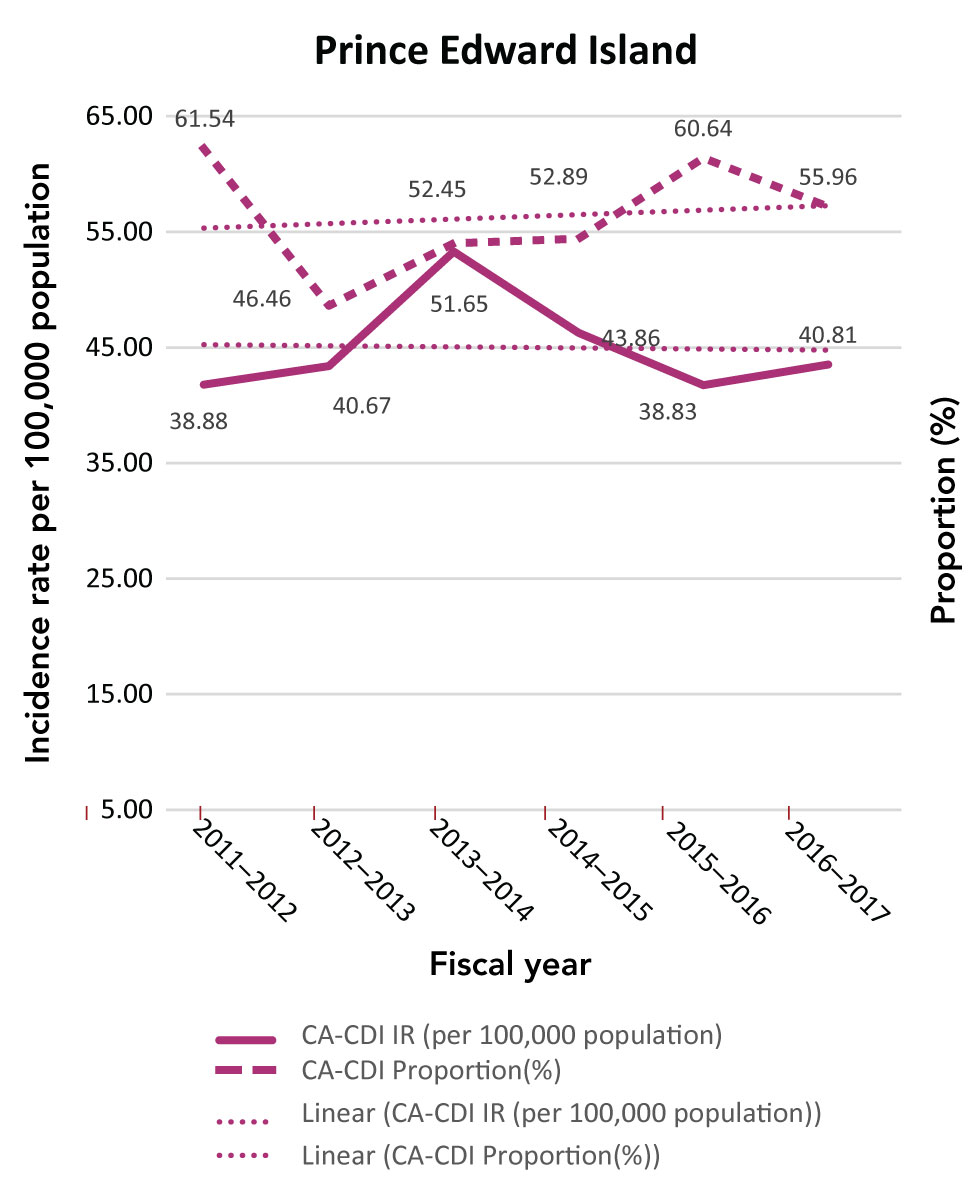
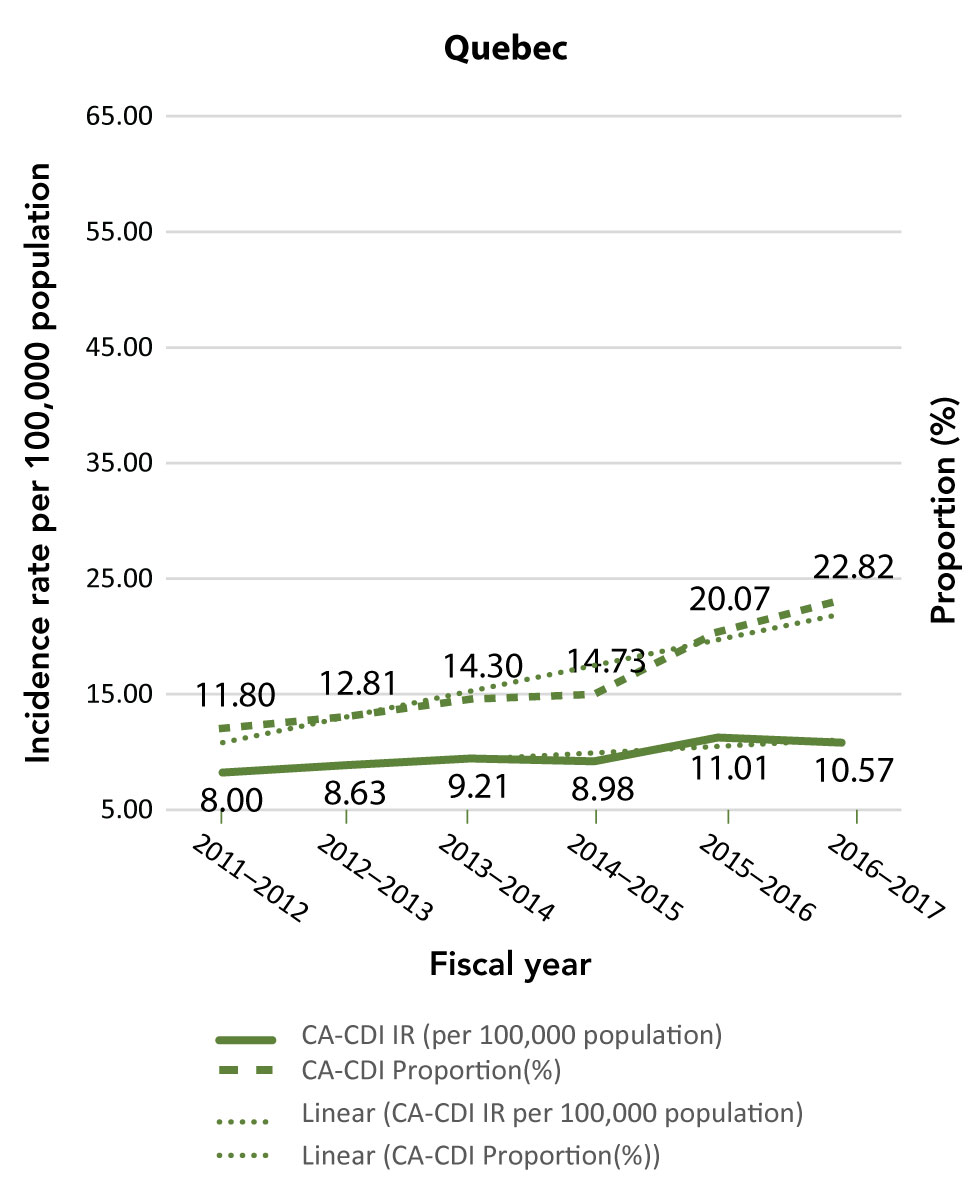
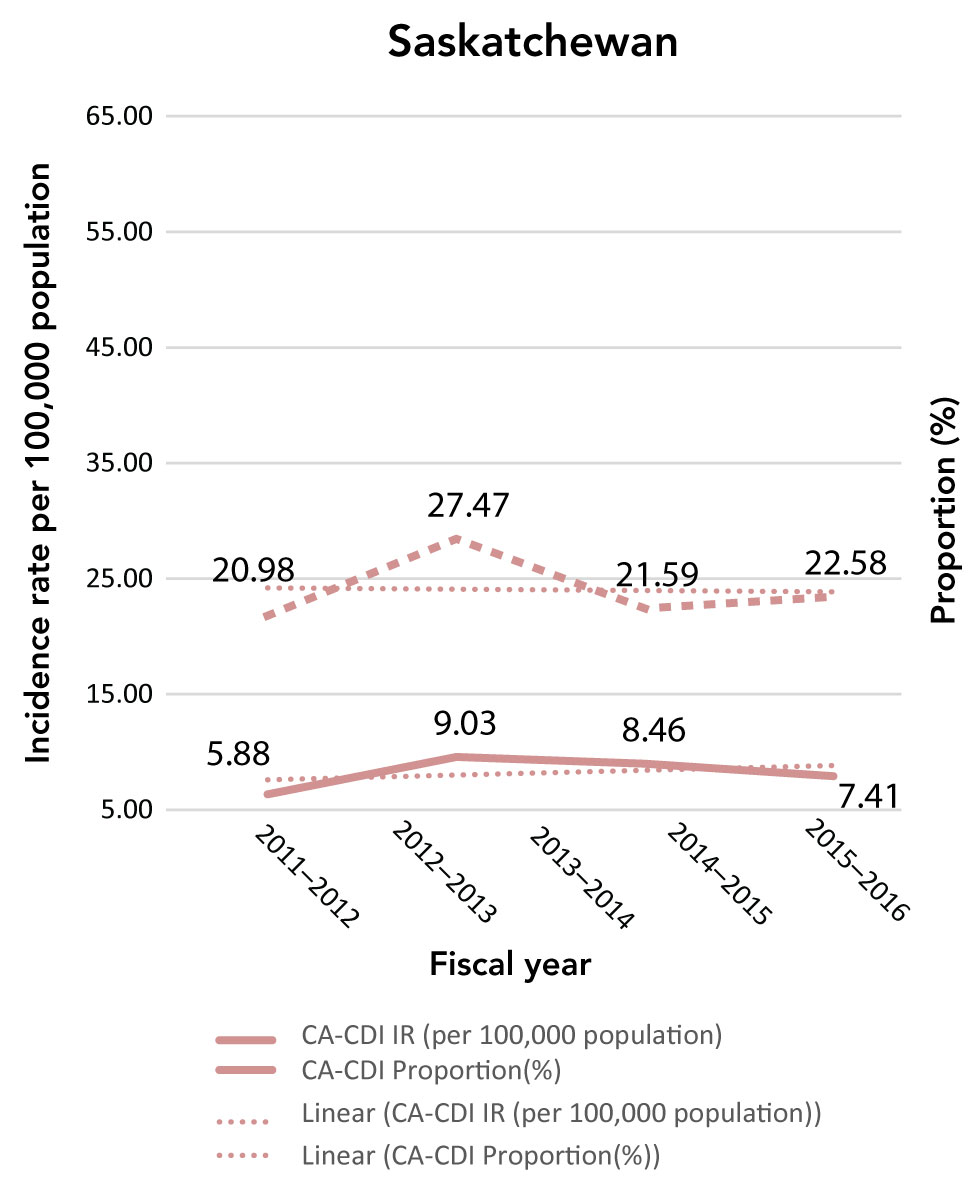
The CA-CDI incidence rates and CA-CDI proportions for provinces are presented in Table 2 with additional detail in Appendix B. In contrast to the HA-CDI incidence rates trends, the CA-CDI incidence rates of all five provinces examined (with the exception of Prince Edward Island) increased (Appendix C: Figure C-2). For Newfoundland and Labrador and Prince Edward Island, there were marked increases in CA-CDI incidence rates from 2012–2013 to 2014–2015. The same trend was also seen for CA-CDI proportions in British Columbia and Quebec. Even though the CA-CDI proportions in Newfoundland and Labrador were declining over the time period of the study, and the proportion seemed to be increasing in Prince Edward Island, the overall CA-CDI case counts in both provinces still represented a large portion of the total CDI cases reported.
| Province | Fiscal yearFootnote a of Table 2Footnote b of Table 2 | |||||||||||
|---|---|---|---|---|---|---|---|---|---|---|---|---|
| 2011–2012 | 2012–2013 | 2013–2014 | 2014–2015 | 2015–2016 | 2016–2017 | |||||||
| Rate | % | Rate | % | Rate | % | Rate | % | Rate | % | Rate | % | |
| BC | 16.74 | 20.84 | 17.46 | 24.46 | 13.86 | 26.77 | 14.51 | 29.82 | 18.45 | 29.93 | 17.78 | 34.92 |
| NLFootnote c of Table 2 | 17.50 | 44.39 | 31.60 | 51.72 | 37.90 | 56.06 | 33.00 | 47.41 | 21.90 | 32.95 | - | - |
| PE | 38.88 | 61.54 | 40.67 | 46.46 | 51.65 | 52.45 | 43.86 | 52.89 | 38.83 | 60.64 | 40.81 | 55.96 |
| QC | 8.00 | 11.80 | 8.63 | 12.81 | 9.21 | 14.30 | 8.98 | 14.73 | 11.01 | 20.07 | 10.57 | 22.82 |
| SK | - | - | 5.88 | 20.98 | 9.03 | 27.47 | 8.46 | 21.59 | 7.41 | 22.58 | - | - |
Discrepancies
In the process of data collation and analysis, discrepancies among provincial surveillance definitions of CDI case classification, surveillance populations and rate calculation were detected, which impeded comparison of CDI rates between provinces. The fundamental issue was that each province defined and complied with its own protocol, leading to highly varied numerators (number of CDI cases) and denominators (total inpatient-days). A summary of discrepancies with examples are shown in Table 3. For a more detailed description of the different definitions by provincial surveillance programs, refer to Appendix D. We were unable to use the Canadian Institute for Health Information (CIHI) Management Information System (MIS) database to estimate the denominators due to the differences in total inpatient days between CIHI and provincial surveillance programs. The differences between the data in the CIHI MIS database and denominators adopted by provinces varied plus or minus 5% to 10%. We were unable to match denominators that fit the definitions of provinces from the CIHI database. For detailed differences between denominators estimated from the CIHI MIS database and those used by provinces, and the calculations used to extract the denominators, please refer to Appendix B.
| Discrepancy | ExamplesFootnote 6Footnote 7Footnote 8Footnote 9Footnote 10Footnote 11Footnote 12Footnote 13Footnote 14 |
|---|---|
| Population under surveillance | The population under surveillance in British Columbia is defined as “inpatients aged one year or older and admitted to acute care facilities”, while some provinces monitor “any patient with a laboratory-confirmed CDI in the province”. Quebec excludes from surveillance patients in long-term care facilities. Only cases admitted to acute care hospital, from long-term care would be included; it is not clear if the same is done everywhere. |
| Classification of cases | While some of the provinces only report hospital-acquired CDI or only monitor new cases, some classify CDI cases into more refined categories: the category of “related to reporting facility” is further stratified into “related to current/previous hospitalization”; “another facility” is stratified into “long-term/ambulatory care and non-reporting”; and also, “new” and “recurrent” cases are documented separately. All HA-CDI cases might be classified into a single category or could be separated in two: acute care facility-acquired or long-term care facility-acquired. CA-CDI surveillance: Quebec only reports hospitalized cases; it is unclear what is done elsewhere. |
| Definition for the cases classifications | Even though the same categories of CDI cases were monitored, they might have different denominators and case definitions. For example, most provinces define HA-CDI as symptoms occurring more than 72 hours after admission, while Manitoba defines HA-CDI as 48 hours after admission. |
| Denominators used for calculating the rates | In some jurisdictions, patients less than one year of age (or a proxy of that) and/or psychiatric patients were excluded. Meanwhile, some provinces use the total number of inpatient-days regardless of age or area of care. In some instances, the denominator was estimated from other provincial data sources and might be adjusted to fit CDI rate reporting. |
| Denominators used by the provinces and CIHI MIS database | Unable to generate the denominators used by the provinces using the data available in CIHI MIS database. Some provinces used denominators that were higher than the total inpatient-days showed in CIHI MIS database. |
Discussion
From 2011 to 2016, the HA-CDI incidence rates in most provinces decreased, which is consistent with the trend reported by the Canadian Antimicrobial Resistance Surveillance System and a study based on the CNISP networkFootnote 21Footnote 22. This reduction in rates might be attributed to infection prevention and control interventions (e.g. hand hygiene, environmental cleaning, patient-dedicated toilets and single-patient rooms), antibiotic stewardship and increased CDI awareness. The reduction in the proportion of NAP1 isolatesFootnote 22, which has been the predominant strain in Canada associated with increasing rate of severe HA-CDI, may also have played an important role.
On the other hand, despite the possibility of an actual increase in CDI cases, the increased incidence rates could be partly explained by the evolution of circulating strains, which might lead to increased toxigenic potential and survival of the bacteria, or to improvements in surveillance and reporting in the province. Notwithstanding the slightly increasing trend in New Brunswick and Nova Scotia, there were only three years of data available for New Brunswick and only the fourth quarter of 2011–2012 fiscal year data available for Nova Scotia, decreasing our power to conclude on trends of HA-CDI incidence rate in these two provinces.
Even though most CA-CDI cases were reported in admitted patients, trends, not absolute rates, were studied in this article. Therefore, choosing the provincial population or admissions as the denominator had only a minor impact on the results. The five provinces included in the analysis of CA-CDI incidence rates showed a slight, increasing trend. Of the nine provinces, almost all focused only on HA-CDI. However, the observation of these trends in HA-CDI indicated the importance of also monitoring and analyzing CA-CDI in future surveillance activities. Improved surveillance and reporting from the community may explain these trends. Moreover, the mutual effect of decreasing numbers of HA-CDI cases, growing numbers of CA-CDI cases, and increased use of nucleic acid amplification testing may also explain the observed trends. The decrease in HA-CDI cases may results in an increase in the proportion of CA-CDI cases, even though the overall numbers (HA-CDI plus CA-CDI cases) remain stable, while the increased testing could contribute to the detection of more CA-CDI cases, which were not tested for in the past. In Newfoundland and Labrador and Prince Edward Island, CA-CDI cases still accounted for a relatively high percentage of all CDI cases reported.
The introduction of more sensitive laboratory testing methods, such as polymerase chain reaction, which detects the toxigenic potential but not the actual toxin production, has been associated with increasing numbers of positive tests and earlier detection compared with enzyme-linked immunosorbent assayFootnote 23Footnote 24. Currently, although all the provinces required clinical validation for the identification of CDI cases, the test methods used for this validation varied. Moreover, laboratory tests and protocols have changed over the years, and the impact of these changes on the accuracy of CDI rates is difficult to assess.
Limitations
There are a number of limitations to consider. Given the shortage of data, we were limited in the analyses that could be performed. Optimally, comparisons between the provinces and stratified analyses, such as incidence rates by age strata, underlying medical conditions and sex, are performed to determine high-risk populations and to provide useful information for cost-effective analyses that could support future CDI vaccine decision-making processes. Unfortunately, these comparisons and analyses could not be performed fully due to the tremendous disparities among the current provincial surveillance systems (Appendix D).
Another limitation was the discrepancy in the denominators (total inpatient-days) used to calculate HA-CDI rates; discrepancies among the provinces and also between the provinces and the CIHI MIS database. The CIHI database was initially considered for providing a relatively accurate estimation of total inpatient-days. This was because these data were reported on the basis of the fiscal year and are representative of the inpatient population during that year. However, it was found that denominators used by the provinces to calculate their provincial CDI rates were different from the denominators in the CIHI MI database. Furthermore, later comparisons showed a divergence between CIHI data and CNISP denominators. One of the reasons for this difference is that the definitions for denominators derived from the CIHI database did not match those used by either the provinces or CNISP. This suggested that total inpatient-days reported to CIHI and those used for provincial CDI rate calculations were derived from different reporting systems. The target population contributing to the total inpatient-days might vary as well. Because it was not clear how the provinces generated the total inpatient-days, these discrepancies cannot be fully explained. Further research and collaboration is needed to identify the cause of and to solve this discrepancy.
It should also be noted that the data retrieved from provinces through this analysis did not include laboratory-linked strain data for CDI cases. This is a major limitation and prevents the monitoring of ecological trends over time with varied CDI strain types.
Although two potential vaccines are currently undergoing clinical trials, it is not yet known how broadly protective these candidate vaccines will be against the various C. difficile strains or the potential mutants escaped from being detected by traditional strategy. The CNISP has already revealed important trends in virulent strains and antimicrobial resistanceFootnote 5Footnote 22. However, as previously discussed, CNISP is limited to data primarily from a small sample of large, tertiary acute care hospitals across Canada and thus does not provide a complete picture.
Missing data were an important limitation in our study. Only Quebec provided data of total inpatient-days that met the definition of their CDI surveillance protocol. For the other provinces, although some total inpatient-days data might have appeared in the provincial reports, none matched those used to calculate HA-CDI rates. Although, as demonstrated in this paper, denominators can be estimated by back-calculation, this erodes the reliability and accuracy of data presented.
Next steps
There is a fundamental need for a nationally-adopted CDI surveillance protocol. This type of surveillance would be the single most important way to address the many discrepancies between provinces, arising from highly varied data—numerators (number of CDI cases), denominators (total inpatient-days) and different definitions for populations under surveillance—that make incidence rates difficult to compare and interpret.
To provide national-level epidemiological data to support decision-makers in their recommendations for the implementation of a potential CDI vaccine program, several key elements are needed. First, demographically-stratified incidence rates, including delineation by age and sex, would be useful to determine whether certain at-risk groups would benefit more from the vaccine. A study conducted in SpainFootnote 22Footnote 25 showed that CDI evolves differently by sex and age group. Second, as mentioned in the CNISP Summary ReportFootnote 2 and as shown in our study, recurrent and CA-CDI should be monitored to increase the understanding of the burden, risk factors and outcomes of such infections in Canada. Third, the use of a common, nationally-adopted definition for CDI, CDI categories and total inpatient-days is critical; the CNISP CDI case definitionFootnote 26 could be adopted for this purpose, with standardized data collected and reported. Fourth, a quality assessment system is needed to ensure quality of reported data. Fifth, CIHI could be an ideal partner to provide data for total inpatient-days, given its already well-established data gathering system from provinces. The CIHI is able to provide the general total inpatient-days that fit the selected definition, allowing for validation of provincial data, and could be an excellent source for stratified inpatient-days. Finally, the ideal solution would be a national online reporting system that includes universal case definitions, and all hospitals across Canada could provide standardized and comparable data that would be accessed and reported via an online platform, allowing for local, regional, provincial and national comparisons. This would not only simplify the study of the epidemiology of different diseases at different levels and make it more feasible to gather case characteristics to gain a complete view of the disease, but it would provide better control of the overall quality of the information as well. In our interconnected open-data era, this would meet the heightened expectation of timely and publicly-accessible surveillance data. One way to do this would be by expanding CNISP, the Public Health Agency of Canada’s sentinel surveillance program that uses a data entry platform on the Canadian Network for Public Health Intelligence (CNPHI), but there may be other equally valid means of collecting CDI surveillance data.
Conclusion
In Canada, the rate of HA-CDI has generally been decreasing but the rate of CA-CDI is increasing. There are important discrepancies in CDI-related definitions among provincial surveillance programs that impede comparisons of CDI rates between provinces, and calculating a pan-Canadian burden of illness to support vaccine program decision-making.
Authors’ statement
- YX — Conceptualization, methodology, formal analysis, investigation, writing—original draft, review and editing
- MCT, CF, KK, KA, SRR, AH — Writing—reviewing and editing
- CQ — Conceptualization, writing—reviewing and editing, supervision
Conflict of interest
- Y Xia has no conflict of interest
- MC Tunis, K Amaratunga and A House are employees of the Public Health Agency of Canada
- C Frenette and K Katz are co-Chairs of CNISP
- SR Rose is a Past-President of Institute of Public Administration of Canada
- C Quach is the current Chair of the National Advisory Committee on Immunization and the Past-President for the Association for Medical Microbiology and Infectious Diseases Canada
Funding
This study did not receive any funding.
Acknowledgements
We thank A MacLaurin (senior program manager, Canadian Patient Safety Institute), C Couris (manager, Indicator Research and Development at Canadian Institute for Health Information), K Allain, B Jenkins, J Dell and the Department of Internal Services in Access and Privacy (Nova Scotia Health Authority), J Johnstone (Public Health Ontario), M Ramprashad and J Noronha (Ontario Ministry of Health and Long-Term Care), J Ellison and IPC Surveillance & Standards team (Alberta Health Services), J Wei (Manitoba Health, Seniors and Active Living) and Saskatchewan Manager Information Services—all of whom provided insight and expertise that greatly assisted the research. We would also like to thank R Galioto, Executive Director for the Association for Medical Microbiology and Infectious Diseases Canada and G Hansen, Executive Director for Infection Prevention and Control Canada for their support on the project.
Appendices
Appendix A: Data searching strategy
Appendix C: Supplementary data
Appendix D: Data used for calculation of Appendix B
Appendix A: Data searching strategy
This document summarizes the sources of data used in the study and additional sources of provincial Clostridioides difficile infections (CDI) surveillance information for further study. For those not separately indicating the origin of the data used in the study, the data are all derived from the reports mentioned below.
Alberta
- Number of hospital-acquired CDI (HA-CDI) cases, incidence rate of HA-CDI and total inpatient days:
Requested via Alberta Research Facilitation (email: Research.Facilitation@ahs.ca)
- IPC Annual Report to Alberta Health (2016):
www.albertahealthservices.ca/assets/healthinfo/ipc/hi-ipc-provincial-surveillance.pdf
- CDI Surveillance Protocol:
www.albertahealthservices.ca/assets/healthinfo/ipc/hi-ipc-sr-cdi-protocol.pdf
- Quarterly Performance Report:
www.albertahealthservices.ca/about/Page833.aspx
British Columbia
- CDI Surveillance Protocol, Quarterly Report and Annual Report:
www.picnet.ca/surveillance/cdi/
Only the most recent reports were listed on the website: to access the archived reports, change the date in the URL of the latest report
- Population Statistics:
www2.gov.bc.ca/gov/content/data/statistics/people-population-community/population/population-estimates
Manitoba
- Manitoba Monthly Surveillance Reports:
www.gov.mb.ca/health/publichealth/surveillance/episummary/index.html
- Manitoba Annual Summary of Communicable Diseases:
www.gov.mb.ca/health/publichealth/surveillance/cds/index.html
- CDI Surveillance Protocol
New Brunswick
- Quarterly Healthcare Associated Infections Surveillance Report:
www2.gnb.ca/content/gnb/en/departments/ocmoh/cdc/content/HAI.html
- No CDI Surveillance Protocol was available. Only the most recent report was listed on the website: to access the archived reports, change the date in the URL of the latest report
- New Brunswick Communicable Disease Annual Report:
www2.gnb.ca/content/gnb/en/departments/ocmoh/for_healthprofessionals/cdc.html
Newfoundland and Labrador
- Healthcare-associated Infections Annual report:
www.health.gov.nl.ca/health/publichealth/cdc/informationandsurveillance.html#currentyear
- CDI Surveillance Protocol:
www.health.gov.nl.ca/health/publichealth/cdc/CDI_surveillance_protocol_final.pdf
Nova Scotia
- Number of cases of HA-CDI and total inpatient days:
requested via Freedom of Information and Protection of Privacy Act (email: FOIPOP@nshealth.ca)
- CDI (New cases of healthcare-associated C. difficile infection that occur in the hospital)
Quarterly Performance and CDI Surveillance Protocol:
https://novascotia.ca/dhw/hsq/public-reporting/c-difficile-data-trending.asp
- Annual Notifiable Disease Surveillance Report (overall CDI cases and incidence):
https://novascotia.ca/dhw/populationhealth/
Ontario
- Number of HA-CDI cases: “clostridium-difficile-infection.xls” document obtained from
www.hqontario.ca/portals/0/documents/system-performance/clostridium-difficile-infection.xls
by searching “Clostridium difficile” in Public Health Ontario official website
www.publichealthontario.ca/en/Pages/default.aspx
Total inpatient days:
Requested via @MOH-G-Patient Safety (email: PatientSafety@ontario.ca)
- C. Difficile Infections in Hospital Patients Performance Quarterly Report:
www.hqontario.ca/System-Performance/Hospital-Patient-Safety/C-Difficile-Infections-in-Hospital-Patients
- CDI Surveillance Guideline:
www.publichealthontario.ca/en/eRepository/PIDAC-IPC_Annex_C_Testing_SurveillanceManage_C_difficile_2013.pdf
Prince Edward Island
- Prince Edward Island (PE) Infection Prevention and Control Program Surveillance Data Summary (only reports for 2015 and 2016 were available):
www.princeedwardisland.ca/en/topic/reports-and-trends
- PE Infection Prevention and Control Program Surveillance Data Summary (2014):
www.gov.pe.ca/photos/original/cpho_ipc_ar2014.pdf
- PE Infection Prevention and Control Program Report (2011):
www.gov.pe.ca/photos/original/DHW_IPC2011.pdf
- CDI Surveillance Guideline:
www.princeedwardisland.ca/sites/default/files/publications/c_diff_infection_guideline.pdf
- Population Statistics:
www.princeedwardisland.ca/sites/default/files/publications/pt_pop_rep_1.pdf
Quebec
- Diarrhées à Clostridium difficile (DACD) Annual Surveillance Report and Protocol:
www.inspq.qc.ca/infections-nosocomiales/spin/dacd
- Population Statistics:
www.stat.gouv.qc.ca/statistiques/population-demographie/structure/qc_1971-20xx.htm
Saskatchewan
- CDI Surveillance Annual Report and Protocol:
www.ehealthsask.ca/services/resources/Pages/Communicable-Disease.aspx
- Population Statistics:
www.saskatchewan.ca/government/government-data/bureau-of-statistics/population-and-census
Appendix B: Hospital-acquired and community-associated Clostridioides difficile infections: definitions, case classification in provincial reports, population surveilled, denominator definition and sources and laboratory confirmation requirements
| Province | Definition |
|---|---|
| AlbertaAppendix B footnote1 | For a primary, symptomatic case, the patient’s symptom meeting CDI case definition occur in a hospital more than or equal to 72 hours after admissionOR For a primary, insufficient info case, the positive C. difficile test date more than or equal to 72 hours after admissionOR A patient is readmitted to an Alberta Health Services/Covenant Health facility under surveillance within four weeks of discharge from a facility where the admission was more than or equal to 72 hoursANDThe patient’s symptoms meeting CDI case definition occur in a hospital within 72 hours of readmission |
| British ColumbiaAppendix B footnote2 | A CDI case occurring more than 72 hours or more than three calendar days (the day of admission counted as the first calendar day, the same hereinafter) after admission to an acute care facility cases identified on or after the fourth calendar day of hospitalization will be classified as HCA)ORA CDI case with symptom onset in the community or occurring fewer than or equal to 72 hours or fewer than or equal to three calendar days after admission to an acute care facility, provided that the patient was admitted to a healthcare facility (including acute care and long-term care) for a period of more than or equal to 24 hours or at least overnight stay in the past four weeks before onset of CDI symptoms |
| ManitobaAppendix B footnote3 | Patient’s initial symptoms occur more than 48 hours post-admission to a healthcare facilityORA patient, who has been discharged from the current healthcare facility within the preceding four weeks, who develops an onset of C. difficile-acquired disease that requires readmission to the same healthcare facility |
| New BrunswickAppendix B footnote4 | Same as Canadian Nosocomial Infections Surveillance Program 2014 definition. Cannot be found online |
| Newfoundland and LabradorAppendix B footnote5 | A case in which symptoms occur at least 72 hours or more after the current admissionORSymptoms occur in a patient who has been hospitalized at a hospital and discharged within the previous four weeks |
| Nova ScotiaAppendix B footnote6 | The patient’s CDI symptoms occur in your healthcare facility three or more days after admission, with day of admission being day oneORThe patient’s CDI symptoms occur less than three days after admission and are seen in a patient who had been hospitalized at a healthcare facility and discharged within the previous four weeks |
| OntarioAppendix B footnote7 | Onset of symptoms more than 72 hours after admissionORThe infection was present at the time of admission but was related to a previous admission to the same facility within the last four weeks and the case has not had Clostridium difficile-associated disease in the past eight weeks |
| Prince Edward IslandAppendix B footnote8 | Symptoms were not present on admission (onset of symptoms more than 72 hours after admission) and there was no admission to an acute care or long term care facility in the last four weeks (if the patient/resident was in another facility in the past four weeks, the case may be attributed to that facility)Not mentioned in the guideline or other reports |
| QuebecAppendix B footnote9 | Patients hospitalized on a short-term care unit of the reporting facility AND diagnosed with CDAD three days and more (so starting on D4) after admission (admission=D1)ORLong-term or psychiatric patients hospitalized in short-term units three days or more after admission (D4) * Excluded: patients hospitalized on registered psychiatric, neonatal and children's complete long-term care unitsORPatients hospitalized or not in the reporting facility and diagnosed with CDAD up to four weeks after their release from a short-term care unit of the reporting facility whatever the length of hospitalizationORPatients transferred to a residential and long-term care centre or private residence providing care and diagnosed with CDAD up to four weeks after their release from a short-term care unit of the reporting facility whatever the length of hospitalization whether they are re-admitted to the reporting facility or notORPatients transferred to a general hospital specialty clinic (other participating short-term care centre) or rehabilitation centre, participating in monitoring or not, and diagnosed with CDAD less than three days (so D1, D2 or D3) after their admission/registration in emergency (D1)* Excluded: patients transferred to a short-term care centre or rehabilitation centre, participating in monitoring or not, and diagnosed with CDAD three days and more after admission (so starting on D4) after their transfers (these cases will then be attributed to the centre to which each patient was transferred) |
| SaskatchewanAppendix B footnote10 | The patient’s CDI symptoms began more than or equal to three days after admission to the reporting healthcare facilityOR The patient’s symptoms began in the community or fewer than three days after admission to the reporting facilityANDThe patient was admitted to the reporting facility for a period of more than or equal to three days in the past four weeks |
| Province | Definition |
|---|---|
| AlbertaAppendix B footnote 1 | Any primary CDI case not meeting the criteria for the hospital-acquired or healthcare-associated will be considered community acquired |
| British ColumbiaAppendix B footnote 2 | A CDI case with symptom onset in the community or occurring within fewer than or equal to 72 hours or fewer than or equal to three calendar days after admission to an acute care facility, provided that the patient was not admitted to any healthcare facility (including acute care and long-term care) for a period of more than or equal to 24 hours or at least overnight stay in the past four weeks before onset of CDI symptoms |
| ManitobaAppendix B footnote 3 | Patient does not meet either nosocomial case definition |
| New Brunswick | n/a |
| Newfoundland and LabradorAppendix B footnote 5 | A case with symptom onset in the community or three calendar days or less after admission to a healthcare facility, provided that symptoms onset was more than four weeks after the last discharge from a healthcare facility |
| Nova Scotia | n/a |
| Ontario | n/a |
| Prince Edward IslandAppendix B footnote 8 | Symptom onset in the community or fewer than 72 hours after being admitted to an acute care or long term care facility, and symptom onset was more than four weeks post-discharge from an acute care/long term care facility Not mentioned in the guideline or other reports |
| QuebecAppendix B footnote 9 | Patients hospitalized on a short-term care unit of the reporting facility and diagnosed with CDAD less than three days (so D1, D2 or D3) after admission/registration in emergency and having no connection with the care environment (hospital, residential centre or ambulatory services included in categories 1b, 1c, 1d and 2) within the preceding four weeks (28 days) |
| SaskatchewanAppendix B footnote 10 | CDI symptoms began in the community or fewer than three days after admission to a healthcare facility, provided that symptom onset was more than four weeks after the patient was discharged from any healthcare facility CA-CDI cases do NOT need to be entered into the CDI Electronic Report Form—might underestimate the number of CA-CDI cases |
| Province | Case classification |
|---|---|
| AlbertaAppendix B footnote 11 | Hospital-acquired infections |
| British ColumbiaAppendix B footnote 12 | HA-CDI
|
| ManitobaAppendix B footnote 13 | Total CDI cases |
| New BrunswickAppendix B footnote 4 | CDI attributed to reporting hospital (definition see HA-CDI) CDI attributed to reporting hospital but does not meet the criteria of the first classification CDI attributed to another acute care facility CDI attributed to long term care or non-acute care facility Unknown |
| Newfoundland and LabradorAppendix B footnote 14 | CDI in acute care facilities CDI in long term care facilities Healthcare-associated (not hospitalized cases) CDI Community-associated CDI |
| Nova ScotiaAppendix B footnote 15 | Healthcare-associated CDI in the reporting facility * Not mentioned new/recurrent case |
| OntarioAppendix B footnote 16 | New hospital acquired CDI in the reporting facility |
| Prince Edward IslandAppendix B footnote 17 | New cases of healthcare-associated CDI in long term care, acute care and other, respectively New cases of community-associated CDI Other |
| QuebecAppendix B footnote 18 | Case associated with current hospitalization in the reporting facility Case associated with previous hospitalization in the reporting facility Case associated with ambulatory care of the reporting facility Case associated with long-term care unit of the reporting facility Case associated with a stay in a non-reporting facility Case of community origin, not associated with care environment |
| SaskatchewanAppendix B footnote 19 | CA-CDI (2012–2015) HA-CDI
|
| Province | Population |
|---|---|
| AlbertaAppendix B footnote 1 | All individuals admitted to Alberta Health Services and Covenant Health acute and acute tertiary rehabilitation care facilities, where inpatient care is provided 24 hours/day, seven days a week, who are more than or equal to one year of age |
| British ColumbiaAppendix B footnote 2 | Inpatient one year or older admitted to acute care facilities Inclusion criteria:
|
| ManitobaAppendix B footnote 3 | Patients, residents and clients |
| New BrunswickAppendix B footnote 4 | Patients who have been hospitalized (no protocol) |
| Newfoundland and LabradorAppendix B footnote 5 | Any patient with laboratory-confirmed CDIs in the province Not specified in the protocol. |
| Nova ScotiaAppendix B footnote 6 | To be included in the surveillance, a patient with healthcare-associated CDI must be:
|
| OntarioAppendix B footnote 7 | Total number of new nosocomial (i.e. hospital acquired) CDI cases Inclusions:
|
| Prince Edward IslandAppendix B footnote 17 | All cases of CDI in Health Prince Edward Island facilities Not specified in the guideline |
| QuebecAppendix B footnote 9 | For each administrative period for each facility must be included in monitoring for all categories of CDAD cases meeting the definition:
|
| SaskatchewanAppendix B footnote 10 | Only patients or residents admitted into a hospital or long-term care facility at the time the CDI diagnosis is made, OR who had been acute care inpatients/long-term care residents in the four weeks prior to diagnosis are included for surveillance Inclusion criteria
|
| Province | Denominator |
|---|---|
| AlbertaAppendix B footnote 1 | The data are abstracted from Admission, Discharge and Transfer Data using a standard methodology and is provided to Infection Prevention and Control. Inpatient admissions and inpatient days cannot be excluded for inpatients younger than one year of age; therefore, as a proxy, the Neonatal Intensive Care Unit denominators and newborn denominators in maternal or labour and delivery units are excluded |
| British ColumbiaAppendix B footnote 2 | Total number of inpatient days collected from the patient information systems by the respective health authority |
| ManitobaAppendix B footnote 13 | Denominator used is total population, not total inpatient days |
| New BrunswickAppendix B footnote 4 | Days spent in a hospital for all patients, regardless of medical condition Derived from the report, no protocol available |
| Newfoundland and Labrador | Not mentioned in the guideline or reports |
| Nova ScotiaAppendix B footnote 6 | The total number of days that patients are in hospital (“patient days”) on the units on which surveillance for CDI is conducted. This is collected on a quarterly basis. Excluded from “patient days” are dedicated long-term care, mental health/psychiatric or withdrawal management units, and patients younger than one year of age. Denominator data should be collected using the health information systems of the respective authority |
| OntarioAppendix B footnote 7 | Total number of inpatient days Inclusions:
|
| Prince Edward Island | Not mentioned in the guideline or reports |
| QuebecAppendix B footnote 9 | Based on the number of patients and their length of stay in the facility or care unit |
| SaskatchewanAppendix B footnote 10 | The appropriate denominator used to determine CDI rates is ‘patient/resident days’. Denominator data (estimated from other provincial data sources) is provided to regional Infection Control Professionals (ICPs). The ICPs may change these numbers if they are not reflective of the current situation (e.g. due to bed closures), or if the ICPs are able to refine the estimate provided. Some ICPs have submitted exact denominator data for their region and others have allowed the estimated provincial data to be used. However, given that the denominator is based on 10,000 patient days, the discrepancy between the actual denominator and the estimate would have to be fairly large to make a significant difference in the rate |
| Province | Laboratory confirmation requirements |
|---|---|
| AlbertaAppendix B footnote 11 | Laboratory-confirmed positive Clostridium difficile test (by polymerase chain reaction or toxin assay) |
| British ColumbiaAppendix B footnote 12 | The presence of C. difficile toxin A and/or B (positive toxin, or culture with evidence of toxin production, or detection of toxin genes) |
| ManitobaAppendix B footnote 13 | Positive C. difficile toxin, culture with evidence of toxin production or histological/pathological diagnosis of C. difficile-associated disease |
Appendix C: Supplementary data
Figure C-1: Hospital-associated Clostridioides difficile infection incidence rates (cases per 10,000 inpatient days)
Text description: Figure C-1
Figure C-1: Hospital-associated Clostridioides difficile infection incidence rates (cases per 10,000 inpatient days)
The figure is a series of line graphs depicting incidence rate (Y axis) by fiscal year (X axis). Each graph depicts a different province. Dates range from 2011/12-2016/17 fiscal year.
| Province | Fiscal Year | Hospital-associated Clostridioides difficile infection incidence rates (per 10,000 inpatient-days) |
|---|---|---|
| Alberta | 2011/12 | 4.2 |
| 2012/13 | 4.1 | |
| 2013/14 | 4.3 | |
| 2014/15 | 3.5 | |
| 2015/16 | 3.6 | |
| 2016/17 | 3.4 | |
| British Columbia | 2011/12 | 8.1 |
| 2012/13 | 6.5 | |
| 2013/14 | 4.5 | |
| 2014/15 | 4.2 | |
| 2015/16 | 4.8 | |
| 2016/17 | 4.1 | |
| New Brunswick | 2013/14 | 2.7 |
| 2014/15 | 2.4 | |
| 2015/16 | 2.8 | |
| Newfoundland and Labrador | 2011/12 | 1.6 |
| 2012/13 | 2.0 | |
| 2013/14 | 2.0 | |
| 2014/15 | 2.1 | |
| 2015/16 | 2.6 | |
| Nova Scotia | 2012/13 | 3.2 |
| 2013/14 | 2.8 | |
| 2014/15 | 2.3 | |
| 2015/16 | 2.7 | |
| 2016/17 | 3.3 | |
| Ontario | 2011/12 | 3.5 |
| 2012/13 | 3.3 | |
| 2013/14 | 3.0 | |
| 2014/15 | 2.6 | |
| 2015/16 | 2.6 | |
| 2016/17 | 2.3 | |
| Prince Edward Island | 2011/12 | 1.8 |
| 2012/13 | 3.8 | |
| 2013/14 | 3.7 | |
| 2014/15 | 3.4 | |
| 2015/16 | 2.3 | |
| 2016/17 | 2.9 | |
| Quebec | 2011/12 | 7.3 |
| 2012/13 | 7.2 | |
| 2013/14 | 7.2 | |
| 2014/15 | 6.8 | |
| 2015/16 | 5.9 | |
| 2016/17 | 4.6 | |
| Saskatchewan | 2012/13 | 3.0 |
| 2013/14 | 2.5 | |
| 2014/15 | 3.2 | |
| 2015/16 | 2.3 | |
| 2016/17 | 2.8 |
Figure C-2: Community-associated Clostridioides difficile infection incidence rates (per 100,000 population) and proportions (%)
BC
NL
PE
QC
SK
Text description: Figure C-2
Figure C-2: Community-associated Clostridioides difficile infection incidence rates (per 100,000 population) and proportions (%)
The figure is a series of line graphs depicting incidence rate (Y axis) by fiscal year (X axis). Each graph depicts a different province. Dates range from 2011/12-2016/17 fiscal year. The dashed line shows the community-associated Clostridioides difficile infection proportion change, while the solid line shows the incidence rate.
| Province | Fiscal Year | Community-associated Clostridioides difficile infection incidence rates (per 100,000 population) | Community-associated Clostridioides difficile infection proportion (%) |
|---|---|---|---|
| British Columbia | 2011/12 | 16.74 | 20.84 |
| 2012/13 | 17.46 | 24.46 | |
| 2013/14 | 13.86 | 26.77 | |
| 2014/15 | 14.51 | 29.82 | |
| 2015/16 | 18.45 | 29.93 | |
| 2016/17 | 17.78 | 34.92 | |
| Newfoundland and Labrador | 2011/12 | 17.50 | 44.39 |
| 2012/13 | 31.60 | 51.72 | |
| 2013/14 | 37.90 | 56.06 | |
| 2014/15 | 33.00 | 47.41 | |
| 2015/16 | 21.90 | 32.95 | |
| Prince Edward Island | 2011/12 | 38.88 | 61.54 |
| 2012/13 | 40.67 | 46.46 | |
| 2013/14 | 51.65 | 52.45 | |
| 2014/15 | 43.86 | 52.89 | |
| 2015/16 | 38.83 | 60.64 | |
| 2016/17 | 40.81 | 55.96 | |
| Quebec | 2011/12 | 8.00 | 11.80 |
| 2012/13 | 8.63 | 12.81 | |
| 2013/14 | 9.21 | 14.30 | |
| 2014/15 | 8.98 | 14.73 | |
| 2015/16 | 11.01 | 20.07 | |
| 2016/17 | 10.57 | 22.82 | |
| Saskatchewan | 2012/13 | 5.88 | 20.98 |
| 2013/14 | 9.03 | 27.47 | |
| 2014/15 | 8.46 | 21.59 | |
| 2015/16 | 7.41 | 22.58 |
Appendix D: Detailed data for hospital and community-acquired Clostridioides difficile infections
| Year | Type of data | Provinces | ||||||||
|---|---|---|---|---|---|---|---|---|---|---|
| AB | BC | NB | NL | NSFootnote a of Appendix D Table D-1 | ONFootnote b of Appendix D Table D-1 | PEFootnote c of Appendix D Table D-1 | QC | SK | ||
| 2011–2012 | rate | 4.2 | 8.1 | n/a | 1.6 | n/a | 3.5 | 1.8 | 7.27 | n/a |
| Number of cases | 1,200 | 2,212 | n/a | 71 | n/a | 3,555 | 26 | 3,778 | n/a | |
| TID | 2,846,938 | 2,733,174 | n/a | 443,750 | n/a | 10,223,096 | 141,552 | 5,196,485 | n/a | |
| CIHI TID | 2,883,600 | 2,616,700 | n/a | 479,600 | n/a | 10,261,500 | 137,900 | n/a | n/a | |
| 2012–2013 | rate | 4.1 | 6.5 | n/a | 2.0 | 3.2 | 3.3 | 3.8 | 7.2 | 3.0 |
| Number of cases | 1,166 | 1,835 | n/a | 89 | 61 | 3,356 | 55 | 3,794 | 184 | |
| TID | 2,857,501 | 2,825,727 | n/a | 445,000 | 192,430 | 10,258,361 | 143,690 | 5,240,187 | 613,333 | |
| CIHI TID | 2,928,400 | 2,653,200 | n/a | 485,700 | n/a | 10,345,000 | 143,700 | n/a | 1,010,300 | |
| 2013–2014 | rate | 4.3 | 4.5 | 2.7 | 2.0 | 2.8 | 3.0 | 3.7 | 7.2 | 2.5 |
| Number of cases | 1,263 | 1,309 | 228 | 97 | 210 | 3,086 | 52 | 3,689 | 213 | |
| TID | 2,929,444 | 2,883,121 | 844,444 | 485,000 | 744,868 | 10,174,367 | 140,766 | 5,136,300 | 852,000 | |
| CIHI TID | 2,996,200 | 2,709,000 | 804,400 | 500,100 | 925,300 | 9,254,300 | 140,700 | n/a | 960,700 | |
| 2014–2015 | rate | 3.5 | 4.2 | 2.4 | 2.1 | 2.3 | 2.6 | 3.4 | 6.8 | 3.2 |
| Number of cases | 1,065 | 1,206 | 208 | 107 | 195 | 2,707 | 47 | 3,455 | 296 | |
| TID | 3,059,257 | 2,903,390 | 866,667 | 509,524 | 831,901 | 10,274,057 | 139,350 | 5,091,013 | 925,000 | |
| CIHI TID | 3,120,000 | 2,731,100 | 830,600 | 511,400 | 943,600 | 9,199,000 | 139,300 | n/a | 969,300 | |
| 2015–2016 | rate | 3.6 | 4.8 | 2.77 | 2.6 | 2.7 | 2.6 | 2.3 | 5.9 | 2.3 |
| Number of cases | 1,091 | 1,423 | 238 | 127 | 216 | 2,645 | 31 | 2,979 | 217 | |
| TID | 3,058,834 | 2,943,047 | 859,206 | 488,462 | 803,310 | 10,260,427 | 133,640 | 5,046,574 | 943,478 | |
| CIHI TID | 3,111,200 | 2,765,100 | 747,600 | 494,000 | 907,100 | 9,203,700 | 131,200 | n/a | 941,900 | |
| 2016–2017 | rate | 3.4 | 4.1 | n/a | n/a | 3.3 | 2.3 | 2.9 | 4.6 | 2.8 |
| Number of cases | 1,043 | 1,190 | n/a | n/a | 266 | 2,388 | 43 | 2,330 | 265 | |
| TID | 3,098,415 | 2,908,197 | n/a | n/a | 813,469 | 10,345,978 | 150,116 | 5,022,104 | 946,429 | |
| CIHI TID | 3,219,300 | 2,799,400 | n/a | n/a | 912,100 | 9,387,400 | 146,900 | n/a | 956,700 | |
| Pooled | rate | 3.8 | 5.3 | 2.6 | 2.1 | 2.8 | 2.9 | 3.0 | 6.5 | 2.7 |
| Number of cases | 6,828 | 9,175 | 674 | 491 | 948 | 17,737 | 254 | 20,025 | 1,175 | |
| TID | 17,850,389 | 17,196,656 | 2,570,317 | 2,371,735 | 3,385,978 | 61,536,286 | 849,114 | 30,732,663 | 4,280,240 | |
| Year | Type of data | BC | NL | PE | QC | SK |
|---|---|---|---|---|---|---|
| 2011–2012 | Number of CA cases | 753 | 91 | 56 | 641 | - |
| Total | 3,613 | 205 | 91 | 5,431 | - | |
| Population | 4,499,139 | - | 144,038 | 8,007,656 | - | |
| Rate | 16.74 | 17.50 | 38.88 | 8.00 | - | |
| Percentage | 20.84 | 44.39 | 61.54 | 11.80 | - | |
| 2012–2013 | Number of CA cases | 794 | 165 | 59 | 698 | 64 |
| Total | 3,246 | 319 | 127 | 5,448 | 305 | |
| Population | 4,546,290 | - | 145,080 | 8,085,906 | 1,088,030 | |
| Rate | 17.46 | 31.60 | 40.67 | 8.63 | 5.88 | |
| Percentage | 24.46 | 51.72 | 46.46 | 12.81 | 20.98 | |
| 2013–2014 | Number of CA cases | 636 | 199 | 75 | 751 | 100 |
| Total | 2,376 | 355 | 143 | 5,251 | 364 | |
| Population | 4,590,081 | - | 145,198 | 8,151,331 | 1,106,838 | |
| Rate | 13.86 | 37.90 | 51.65 | 9.21 | 9.03 | |
| Percentage | 26.77 | 56.06 | 52.45 | 14.30 | 27.47 | |
| 2014–2015 | Number of CA cases | 674 | 174 | 64 | 737 | 95 |
| Total | 2,260 | 367 | 121 | 5,004 | 440 | |
| Population | 4,646,462 | - | 145,915 | 8,210,533 | 1,122,653 | |
| Rate | 14.51 | 33.00 | 43.86 | 8.98 | 8.46 | |
| Percentage | 29.82 | 47.41 | 52.89 | 14.73 | 21.59 | |
| 2015–2016 | Number of CA cases | 866 | 115 | 57 | 909 | 84 |
| Total | 2,893 | 349 | 94 | 4,529 | 372 | |
| Population | 4,694,699 | - | 146,791 | 8,254,912 | 1,133,165 | |
| Rate | 18.45 | 21.90 | 38.83 | 11.01 | 7.41 | |
| % | 29.93 | 32.95 | 60.64 | 20.07 | 22.58 | |
| 2016–2017 | Number of CA cases | 846 | - | 61 | 880 | - |
| Total | 2,423 | - | 109 | 3,856 | - | |
| Population | 4,757,658 | - | 149,472 | 8,321,888 | - | |
| Rate | 17.78 | - | 40.81 | 10.57 | - | |
| Percentage | 34.92 | - | 55.96 | 22.82 | - | |
