ARCHIVED - Cervical Cancer Screening in Canada: 1998 Surveillance Report
4. Cervical Cancer Screening Activities in Canada
4.1 Participation, by Age Group and Province (provincial data and self-reported survey data)
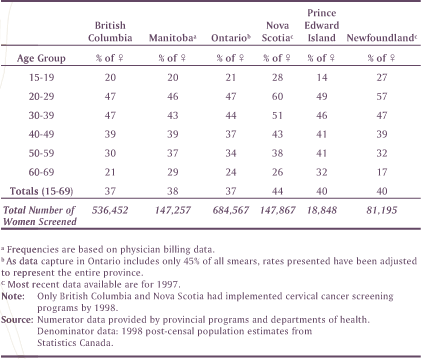
The best national data currently available from certain provinces in Canada are shown in Table 2 (details are provided in Appendix E). One year participation rates do not vary greatly among provinces, ranging from 37% in British Columbia and Ontario to 44% in Nova Scotia. These participation rates vary, however, by age group: the lowest rate is among women in the 15-19 age group and the highest rate among women aged 20-39.
Table 2: One-Year Pap Test Rates, by Age Group and Province, 1998

Figure 6: Proportion of Women Screened Within the Last 3 Years, Self Report, NPHS 1998/99

Figure 6 shows Canadian women's self reports of Pap tests, by province, reported in the 1998-1999 National Population Health Survey (NPHS). Overall, 79% of Canadian women aged 20-69 reported having had a Pap test within the previous 3 years (detailed data shown in Appendix E). This percentage varied only slightly among provinces, ranging from 77% in British Columbia to 85% in Manitoba. Three-year self reports did vary considerably by age group, ranging from a low of 60% among women aged 60-69 to a high of 86% among women aged 30-39. Population estimates of screening practices can be influenced by a variety of factors, such as self-reporting biases. Socially desirable responses tend to be reported more often in surveys. Studies have shown that women tend to over-report screeningFootnote 33.
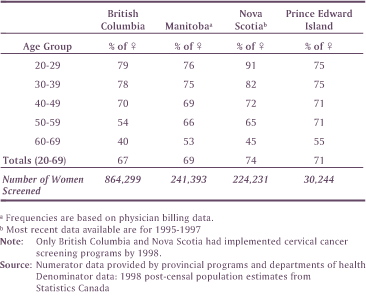
Table 3 presents the 3-year participation rate of women in the four provinces that collected data between 1996 and 1998 (details are provided in Appendix E). Among the women in the 20-69 year age group participation rates were similar in each province, ranging from 67% to 74%. However, rates varied according to age group, from a peak of 91% among women aged 20-29 in Nova Scotia to a low of 40% to 45% in British Columbia and Nova Scotia among women aged 60-69. A comparison of Table 3 with Figure 6 shows that in their self reports women may somewhat overestimate the occurrence or recency of their Pap tests. (Such differences between self-reported and administrative data occur for various reasons, including the desire to give a socially acceptable answer, the higher participation in health surveys of women who are also more likely to engage in healthpromoting behaviour, the telescoping of the time frame such that events are remembered as occurring more recently than was actually the case, or the fact that not all administrative events may have been included as a result of block funding or migrationFootnote 34.)
For a similar time period, the 3-year participation rate in Canada (about 70%) was similar to the rate for the NHS Cervical Screening Programme in the United KingdomFootnote 35. However, the target age group in that country is 25-64. The National Cervical Screening Program in Australia reported a 2-year participation rate of 63.9% in its target age group, of 20-69Footnote 36.
Table 3: Three-Year Pap Test Rates, by Age Group and Province, 1996-1998

4.2 Specimen Adequacy
Cervical cancer screening programs classify smears on the basis of their perceived adequacy for interpretation: satisfactory for interpretation, satisfactory but limited for interpretation, and unsatisfactory. The "satisfactory but limited for interpretation" category is used when the specimen provides useful information, but interpretation may be compromised. Limiting factors may include lack of pertinent clinical patient information (age and date of last menstrual period, as minimum; additional information as appropriate), partially obscuring blood, inflammation, thick areas, poor fixation, air-drying artifact, contaminant, and absence of an endocervical/ transformation zone component. The "unsatisfactory"category is used when the smear quality is inadequate for an interpretation.
Three provinces reported on specimen adequacy for smears taken in 1998 (Table 4). The percentage of unsatisfactory smears varied from 0.3% to 3.8%, and the percentage of satisfactory but limited smears from 16.3% to 25.5%. Overall, the British Columbia program reported the lowest level of satisfactory smears (70.8%), indicating that a higher threshold for "satisfactory" may be in use.
Table 4: Specimen Adequacy, by Province, 1998

The level of unsatisfactory smears was similar between age groups < 50 and 50+ within each of the three provincial programs. However, the level of "satisfactory but limited" smears was noticeably higher in the younger age group for British Columbia and Prince Edward Island programs. The age disparity may be an artifact of physiological changes with age, or an adjustment in the reporting threshold to accommodate expected physiological changes with age.
4.3 Cytology Results
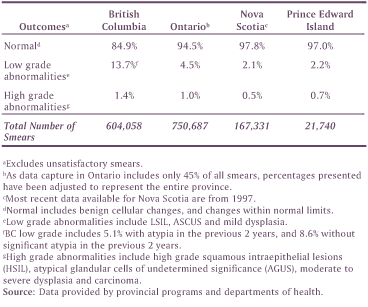
The results of all cervical smears interpreted in one reference year by four provincial programs are shown in Table 5. Unsatisfactory smears were excluded. Because recommendations for repeat smears may differ among provincial programs and there is no mechanism in place to prevent over-screening, the extent to which multiple smears from the same patients may affect the resulting distributions is unknown, but should not be discounted.
The percentage of high grade or more severe findings varied, from 0.5% in Nova Scotia to 1.4% in British Columbia. This likely reflects differences in reporting thresholds. The greatest difference among provincial programs is in their reporting of low grade abnormalities (including atypical squamous cells of undetermined significance [ASCUS] and LSIL). Nova Scotia and Prince Edward Island reported low grade abnormalities at a rate of 2.1% and 2.2% respectively; Ontario reported a rate of 4.5%; and British Columbia reported the highest rate of 13.7%. There are likely differences in reporting thresholds, as mentioned in Section 4.2. Regional variations in the follow-up of low grade abnormalities, which ranges from repeat Pap test at 6 month intervals for up to 2 years to immediate colposcopic examinations, further contribute to the differences.
Table 5: Cytology Outcomes by Province, 1998
