
Employment and Social Development Canada’s 2024-25 Departmental results report
On this page
- At a glance
- From the Minister
- Service excellence highlights
- Results - what we achieved
- Core responsibility 1: Social development
- Core responsibility 2: Pensions and benefits
- Core responsibility 3: Learning, skills development and employment
- Core responsibility 4: Working conditions and workplace relations
- Core responsibility 5: Information delivery and services for other government departments
- Internal services
- Overall risks and mitigation strategies
- Spending and human resources
- Supplementary information tables
- Federal tax expenditures
- Corporate information
- Definitions
Alternate formats
Large print, braille, MP3 (audio), e-text and DAISY formats are available on demand by ordering online or calling 1 800 O-Canada (1-800-622-6232). If you use a teletypewriter (TTY), call 1-800-926-9105.
List of tables
- Table 1.1
- Table 1.2
- Table 1.3
- Table 1.4
- Table 1.5
- Table 2.1
- Table 2.2
- Table 2.3
- Table 2.4
- Table 3.1
- Table 3.2
- Table 3.3
- Table 3.4
- Table 3.5
- Table 3.6
- Table 3.7
- Table 4.1
- Table 4.2
- Table 4.3
- Table 4.4
- Table 4.5
- Table 5.1
- Table 5.2
- Table 5.3
- Table 6.1
- Table 6.2
- Table 7.1
- Table 7.2
- Table 7.3
- Table 7.4
- Table 7.5
- Table 7.6
- Table 7.7
- Table 7.8
- Table 7.9
- Table 7.10
- Table 7.11
At a glance
This departmental results report details Employment and Social Development Canada's actual accomplishments against the plans, priorities and expected results outlined in its 2024-25 Departmental Plan.
Key priorities
Employment and Social Development Canada is focused on making life more affordable for Canadians, growing a resilient and green economy, and making Canada more inclusive. We're also focused on service delivery excellence as we continue to meet the needs of Canadians in both official languages. We identified these key priorities for 2024-25:
- Making child care more affordable by reducing fees for regulated child care to an average of $10-a-day and creating 250,000 new regulated child care spaces by March 2026.
- Ensuring Indigenous children have access to a culturally appropriate Indigenous Early Learning and Child Care system that meets the needs of Indigenous families wherever they live by collaborating with First Nations, Inuit and Métis Nation governments and organizations.
- Fighting anti-Black racism and improving social and economic outcomes for Black communities in Canada by supporting initiatives that help organizations with these aims.
- Supporting the development of green jobs which will contribute to Canada's path to a net-zero emissions and climate resilient future. This will be done by launching a new sustainable jobs training funding stream that will fund projects led by unions to provide green skills training for trades workers.
- Assisting Canadian employers facing labour shortages through the Temporary Foreign Worker Program, allowing temporary hiring when Canadians and permanent residents are not available
- Introducing a new 15-week shareable Employment Insurance adoption benefit as announced in the 2023 Fall Economic Statement. The benefit is expected to provide Canadian families with additional time and flexibility as they welcome a new child in their home through adoption or surrogacy.
- Continuing to provide dispute resolution and dispute prevention assistance to unions and employers under the jurisdiction of the Canada Labour Code.
- Continuing to meet with representatives from provinces and territories to discuss issues of mutual interest including occupational health and safety as well as labour standards
- Continuing to address employee misclassification in the federally regulated road transportation sector by actively engaging with industry, conducting education sessions and undertaking enforcement actions under the Canada Labour Code.
- Continuing to explore ways to amend the Canada Labour Code to improve job protections for federally regulated gig workers by strengthening prohibitions against employee misclassification.
- Amended regulations to support the Pay Equity Commissioner's ability to address non-compliance with the Pay Equity Act and Pay Equity Regulations.
- Working to advance the Disability Inclusion Action Plan to reduce poverty and support the financial security of working-age persons with disabilities. This will include the development of the Canada Disability Benefit to provide direct monthly payments to eligible individuals.
- Placing Canadians at the core of how we design and deliver services, with emphasis on delivering services where and when Canadians need them. We will do this while making continuous improvements to service delivery. This will include the migration of Old Age Security (OAS) to the new common benefits platform as part of the Benefits Delivery Modernization (BDM), one of the largest IT modernization initiatives in the GC.
- Benefits Delivery Modernization (BDM) is the largest IT transformation initiative ever undertaken by the Government of Canada with the goal of modernizing the technology that administers Old Age Security (OAS), Employment Insurance (EI) and Canada Pension Plan (CPP).
- BDM is being implemented through three overlapping tranches that will see the Old Age Security, Employment Insurance and the Canada Pension Plan Programs onboarded to a common benefits delivery platform.
- The Benefits Delivery Modernization (BDM) Programme is introducing modern applications and incorporating leading-edge technologies to enable the delivery of Old Age Security (OAS) benefits initially, followed by Employment Insurance (EI) and then Canada Pension Plan (CPP). BDM is on track to modernize OAS, EI, and CPP over three phases, with an expected completion date of 2030-31.
- Based on other transformational initiatives in the public sector, it is estimated that BDM could potentially support improvement in ESDC efficiencies in the range of 20-30%.
To achieve our goals, we continued to improve our service delivery technology so Canadians can access our benefits and programs in an easy and secure manner. We also continued to develop products to improve user experience so Canadians can have reliable access to our services for life events, regardless of where they live.
Highlights for Employment and Social Development Canada in 2024-25
- Total gross actual spending (including internal services): $194.5 billion
- Total full-time equivalent staff (including internal services): 38,219
For complete information on Employment and Social Development Canada's total spending and human resources, read the Spending and human resources section of its full departmental results report.
Summary of results
The following provides a summary of the results the department achieved in 2024-25 under its main areas of activity, called "core responsibilities."
Core responsibility 1: Social development
Actual gross spending: $8,018,859,343
Actual net spending: $8,018,859,343
Actual full-time equivalent staff: 658
We continued working with provinces and territories to expand access to affordable, high-quality, flexible, and inclusive early learning and child care. This will help to reduce fees for regulated child care towards an average of $10-a-day and to create 250,000 new regulated child care spaces by March 2026.
The government completed the regulatory process for the Canada Disability Benefit, a new monthly benefit for low-income working-age persons with disabilities. This benefit is a commitment and cornerstone of Canada's Disability Inclusion Action Plan (DIAP), which is a blueprint for change to make Canada more inclusive for persons with disabilities.
We worked closely with provinces, territories, and Indigenous partners to begin implementing the National School Food Program and outlines a set of guiding principles, clear objectives, and a long-term vision. This is supported by a federal investment of $1 billion over five years.
The Supporting Black Canadian Communities Initiative (SBCCI) continued to help increase social inclusion, reduce systemic barriers, and strengthen social cohesion within Canada by advancing targeted measures for Black communities. Through its Capacity Building stream, the SBCCI has partnered with four Black-led organizations across the country to build foundational capacity in smaller Black-led and Black-serving, Black-focused (B3) community-based not-for-profit organizations.
For more information on Employment and Social Development Canada's Social development read the 'Results - what we achieved" section of its departmental results report.
Core responsibility 2: Pensions and benefits
Actual gross spending: $147,165,165,946
Actual net spending: $81,688,146,091
Actual full-time equivalent staff: 8,446
The Canada Pension Plan (CPP) enhancement was completed in January 2025. The changes will boost the maximum CPP retirement pension by more than 50% for today's youngest workers, and raise the amounts provided by the CPP's disability pension and survivor's pension.
We improved the Canada Pension Plan - Disability program by expanding our quality assurance efforts to include studies on applications related to terminal illnesses and grave medical conditions, as well as annual reviews of both initial and reconsideration decisions. We also launched a pilot project to test improvements to return-to-work supports for its beneficiaries who attempt to work.
We also successfully migrated the Old Age Security legacy system to the new Benefits Delivery Modernization platform. The new system provides a better experience, streamlining how Canadians apply for benefits as well as update their personal information and life events.
For more information on Employment and Social Development Canada's Pensions and benefits read the 'Results - what we achieved" section of its departmental results report.
Core responsibility 3: Learning, skills development and employment
Actual gross spending: $34,552,944,563
Actual net spending: $7,905,833,330
Actual full-time equivalent staff: 16,457
In 2024-2025, we increased Canada Student Grants by 40%, providing up to $4,200 for full-time students and $2,520 for part-time students. We also increased the interest-free Canada Student Loan limit from $210 to $300 per week, supporting about 297,000 students.
We launched the Sustainable Jobs Training Fund to support workers in gaining the skills needed for employment in the low-carbon economy.
Through the bilateral Labour Market Development Agreements and the Workforce Development Agreements, we helped reduce employment inequalities by providing Canadians with much-needed skills training and employment assistance.
In summer and fall 2024, we implemented measures to address rising unemployment and decreasing job vacancies, aiming to reduce reliance on the Temporary Foreign Worker (TFW) Program. These changes led to a 50% reduction in LMIA application received and encouraged employers to seek more domestic workers.
The temporary one-year EI measure offering up to four additional weeks of regular benefits to eligible seasonal workers in 13 EI regions ended as scheduled on September 7, 2024. However, a separate temporary measure-providing up to five additional weeks of regular benefits for seasonal workers in the same regions-was extended through Budget 2024 and will remain in place until October 24, 2026.
For more information on Employment and Social Development Canada's Learning, skills development and employment read the Results - what we achieved section of its departmental results report.
Core responsibility 4: Working conditions and workplace relations
Actual gross spending: $206,974,970
Actual net spending: $205,888,660
Actual full-time equivalent staff: 822
In 2024, new legislation amending the Canada Labour Code was passed to improve leave for federally regulated private sector employees experiencing pregnancy loss.
We updated the Occupational Health and Safety Regulations to enhance worker protection and respond to societal changes. More specifically, initiatives allow employers to include all-gender toilets in their efforts to meet requirements for providing washroom facilities.
We took action against employers in the road transportation industry who are misclassifying employees by strengthening the rules on misclassification in the Canada Labour Code.
For more information on Employment and Social Development Canada's Working conditions and workplace relations read the Results - what we achieved section of its departmental results report.
Core responsibility 5: Information delivery and services for other government departments
Actual gross spending: $603,214,600
Actual net spending: $603,214,600
Actual full-time equivalent staff: 5,462
We reviewed the language designation of all Service Canada offices to better support the Official Language Minority Communities across Canada. This was done as part of the Official Languages Regulations Reapplication Exercise, which requires federal institutions to review the language designation of their offices every 10 years.
As part of our commitment to more effectively reach people facing linguistic barriers, we piloted international and Indigenous language interpretation services on 1 800 O-Canada. We learned there is a daily demand for interpretation for many languages. As a result, we will continue offering this service.
We also expanded our Community Outreach and Liaison Service (COLS), which helps us reach populations facing barriers to accessing services and benefits (e.g. geographical, cultural or other), by meeting them where they live or spend time. Last year, we reached 21,900 community organizations that supported vulnerable populations, including 737 organizations in Indigenous communities.
In collaboration with Immigration, Refugees and Citizenship Canada (IRCC), we completed the Passport Program Modernization Initiative (PPMI) in August 2024. This initiative introduced technology that helps with automatic passport renewals as well as streamlined processes.
On behalf of Health Canada, we led the design, build, and successful implementation of the Canadian Dental Care Plan (CDCP) service delivery model at Service Canada for application intake and eligibility verification.
For more information on Employment and Social Development Canada's Information delivery and services for other government departments read the Results - what we achieved section of its departmental results report.
From the Minister
Building a fairer, stronger Canada
The 2024-2025 Departmental Results Report for Employment and Social Development Canada (ESDC) highlights the Department's key role in supporting Canadians, strengthening communities, and helping people thrive - no matter where they are or where they come from.
Over the past year, ESDC has continued to play a central role in empowering Canadians' success in a rapidly changing economy. From helping young people as they plan their futures, to building more inclusive workplaces, to welcoming internationally trained professionals into the labour market - our work is about making sure nobody is left behind.
Investing in inclusion and opportunity
Everyone deserves a fair and equal chance to succeed. Through the Disability Inclusion Action Plan and the new Canada Disability Benefit, we are taking steps toward greater equity for persons with disabilities. Families across the country are benefiting from more affordable and inclusive child care, allowing parents to have a choice and saving families hundreds of dollars. Indigenous-led early learning, and national school food initiatives also ensure that every child gets the strong start they deserve. ESDC continues to strengthen Black communities and address systemic barriers to full participation. Because when all communities succeed, Canada also succeeds.
Driving progress
The progress made reflects the dedication and commitment of Canada's public service. Their contribution ensures that ESDC continues to deliver programs and services that support Canadians every day.
Together, we are building the strongest economy in the G7 - one where everyone can contribute, share in our collective success, and move forward with confidence and opportunity.
The Honourable Patty Hajdu
Minister of Jobs and Families and Minister responsible for the Federal Economic Development Agency for Northern Ontario
Service excellence highlights
The department was dedicated to providing Canadians with high quality, timely, and accessible services. We improved services for Canadians and other clients in 3 main areas:
1. Modernizing our information technology (IT)
Transition to Cúram
On March 17, 2025, we moved all 7.4 million Old Age Security (OAS) recipients to the new Common Benefit Delivery platform (Cúram). Since that move, payments have been made accurately and on-time. OAS clients can also now upload documents instead of mailing or hand delivering to a Service Canada office, as well as update their personal information and life events, and track application status.
The successful transition of OAS to the Cúram platform was a major benchmark in modernizing benefit delivery, and sets the stage for:
- Employment Insurance (EI) to begin transitioning cohort by cohort in 2025-2026
- Canada Pension Plan (CPP) to follow in 2026-2027
Once complete, Canadians will benefit from a single point of access for all three programs, resulting in more streamlined service delivery and an improved client experience.
AI integration and service enhancements
We established the technology and governance needed to test AI solutions to improve client services. These efforts are helping people to make applying and receiving benefits, faster, and more efficient-while ensuring the protection of personal information.
Specifically, we:
- Set up AI governance to ensure solutions are safe and reliable
- Launched internal AI tools to help employees deliver better service
- Assist-Me (ESDC's first generative AI-powered chatbot) tool in OAS on Curam, provides accurate, real-time answers to over 90% of staff enquiries, helping agents deliver services effectively and focus on meaningful support; and
- Tested a new system that allows clients to update their information, such as their address, just once for all their benefits
Last year, we also released an early version of the Employment Insurance Benefits Estimator. This digital tool allows clients to estimate their EI benefits before applying by answering a few questions anonymously. We continued to refine the estimator based on direct client feedback and system data.
Accessibility and contact centre improvements
To improve service quality, accessibility, and responsiveness for vulnerable clients, we enhanced accessibility and responsiveness across key service channels, by:
- Upgrading Employer Contact Centre (ECC), Employment Insurance (EI) and teletypewriter (TTY) services to improve client support;
- Introducing a modernized TTY solution in the Canadian Dental Care Plan (CDCP) call centre, enabling real-time responses for TTY users; and
- Launching dedicated toll-free numbers for Video Relay Service (VRS) providers, offering prioritized access for clients with speech and hearing impairments.
We also began work to replace the aging 1 800 O-Canada contact centre platform. The new system (expected to be implemented by 2027) will:
- Be fully supported and scalable; and
- Offer new capabilities options that can be leveraged without additional procurement to modernize and improve client service delivery in the future as required
Digital access and security
We continued to work with federal and provincial partners to help Canadians access federal services online using their provincial digital credentials, and to feel confident doing so.
We helped clients securely access their online accounts by maintaining two key tools: Simplified Digital Identity Validation (extending the contract) and Multifactor Authentication (enhancements).
Canada.ca Enhancements
We continued to improve accessibility on Canada.ca, ensuring it meets Web Content Accessibility Guidelines 2.1 standards. We focused on using plain language, optimizing search, and managing content to comply with accessibility guidelines and the Canada.ca Content Style Guide. We also introduced innovative solutions to automate wait times for Service Canada and Passport offices, making it easier for Canadians to use our services.
2. Improving services for Canadians
Client-Centered Service Design
Client experience remained central to how we design and deliver services. To make our content easier to understand and online navigation more efficient, we:
- Worked with users to co-design and improve services in line with Government of Canada Digital Standards;
- Launched two life event hubs using journey labs approaches, including "What to do when someone dies" and "Welcoming a child" to improve services for Canadians;
- Made testing with real clients a fundamental part of our service design process for initiatives like the Canada Disability Benefit and the Canadian Dental Care Benefit;
- Continued to incorporate client feedback to ensure products such as forms, letters, and web content were clear and easy to use; and
- Applied human-centered design to remove service barriers.
Last year, we began collaborating with community organizations, such as the March of Dimes, to gather feedback from persons with disabilities on the usability of our client-facing products. We engaged diverse audiences to ensure our products are user-friendly and accessible.
Feedback and Performance Monitoring
We strengthened feedback mechanisms to better understand client needs and service barriers:
- The Office for Client Satisfaction (OCS) received 5,959 submissions, offering insights into service challenges and emerging issues;
- The Client Experience (CX) Survey continued to measure ease, effectiveness, emotion, and satisfaction across programs;
- Feedback questionnaires were offered across multiple service channels, including Service Canada Centres, 1 800 O-Canada, MSCA, Canada.ca, and eServiceCanada. This feedback was used to identify insights such as the impact of specific barriers to vulnerable groups. Two such examples included the impact of Plexiglas for hard of hearing clients and the need to provide the digitally vulnerable with more Citizen Access Workstation Services (CAWS) support. Implementation is underway for both recommendations.
Digital Insights and Web Usability
Last year, 59 departments used our analytics tool to gather insights from 1.348 billion visits to Canada.ca, and over 600,000 visitors responded to our Canada.ca Task Success Survey. This data helped departments better understand visitors' use of the website and measure how well it is meeting client needs.
Digitizing death registration
We partnered with several provinces to digitize the death registration process making it faster to inform vital statistics organizations. These efforts help reduce overpayments and the need for recoveries and investigations. To date:
- Ontario and Saskatchewan have finished building their systems and are working with users to start sharing information electronically;
- Nova Scotia and New Brunswick plan to finish this work by the end of 2025; and
- Manitoba and PEI plan to complete this work by fall 2026.
3. Removing barriers
Outreach and Client Support
We worked with the Canada Revenue Agency (CRA) and Statistics Canada to help hard-to-reach clients access government benefit programs and services. This coordinated outreach promoted a smoother client service experience, especially for those who require a high level of support, through a warm transfer (directly transferring the request to the correct telephone service) partnership between the CRA's Client Assistance Referral and Enquiry Service (CARES) and Service Canada's Outreach Support Centre (OSC).
Through the Service Referral Initiative (SRI), we continued to work with community organizations to identify at-risk and vulnerable individuals who may be eligible for federal services and benefits and referred them directly to a Service Canada representative. In 2024-2025, Service Canada:
- Onboarded 392 organizations, bringing the total to 837 with access to SRI support;
- Received 1,830 referral requests; and
- Received 92 warm transfers from the United Way's 211-telephone service.
Grants and Contributions
The Grant and Contributions Notification Service continued to promote transparency and provide Canadians with funding updates. Last year, the service sent automated updates to over 24,000 subscribers to promote nine calls for proposals opportunities. We also launched a social media campaign across multiple platforms, including Facebook and Instagram, to encourage registration for this service.
We added new search filters to our Grants and Contribution funding webpage to help users find opportunities that match their needs. On average, 6,700 users visited this page each month.
We also made efforts to increase use of our Grants and Contributions Online Services (GCOS). These included:
- Doing client feedback surveys;
- Improving processes, web content and instructions for users;
- Promoting GCOS at regular calls for proposal information and engagement sessions; and
- Social media initiatives including "how to" and testimonial videos.
As a result, GCOS saw new users increase by over 30% and applications increase by 18% from the previous fiscal year. This increase in digital use led to faster processing times and a better user experience.
Removing Barriers to Program Access (RBPA)
As part of RBPA, we completed a multi-year research initiative to improve access for various groups, including seniors, persons with disabilities, and youth. The research indicated that organizations' ability to access funding is impacted by several factors, including:
- Organizational capacity - organizations with limited or unstable financial and human resources cannot devote a significant amount of time and resources into seeking funding;
- Communication challenges - meaning a lack of responses and poor back-and-forth communication between organizations and the program; and
- Complexity of programs / funding applications: increased complexity was a barrier to receiving funding.
As a result of this research, we simplified application guidelines and procedures, revised eligibility criteria, and improved communications, leading to better help for many organizations.
Youth Digital Gateway (YDG)
The Youth Digital Gateway (YDG) project concluded on March 31, 2025. It finished on time, on budget, and achieved planned objectives.
Co-designed with youth and stakeholders, the platform improves access to Government of Canada resources for employment, education, and skill development. It makes it easier to find programs and services, facilitates employer engagement, and fosters collaboration among youth-serving organizations (especially benefitting the most disadvantaged youth).
Features include:
- Geo-location of support services;
- Integration with 211.ca;
- Youth-friendly, standardized content; and,
- An Organization Platform to foster collaboration among funded groups.
The platform increased engagement, especially among organizations supporting youth facing employment barriers, by updating its content and design. This also promoted digital inclusion and improved the public's view of youth employment programs.
Service Canada Regional Service Delivery
Through partnerships with the provinces, territories, municipalities, and communities, our regional Service Canada offices delivered an array of essential services from hundreds of locations across the country. These offices continued reaching out and responding to clients' changing needs. Here are a few highlights from 2024-2025:
Western Canada and Territories Region
Improving passport production
A third Passport Production Centre opened in Surrey, BC, on October 30, 2024. This increased processing capacity, ensured service standards, and improved access for Canadians in remote and northern areas. Employees processed 262,995 passports and printed 345,531 passports, and employees in the call centre answered 33,166 calls by the end of the fiscal year.
Working with Indigenous partners
We participated in engagement sessions with Indigenous Skills and Employment Training (ISET) agreement holders, bringing together government, industry and Indigenous partners to collaborate on economic development and program delivery.
We supported forums, conferences, and network meetings, where we shared information on ISET program flexibilities, addressed emergency needs, supported client and daycare response plans, and identified strategic planning supports.
We also updated the ISET flexibilities guide-particularly regarding tariffs-and continue to support regular discussions to improve program delivery and emergency response.
Through these regular communications, we were able to:
- Enhance program holders' understanding of the terms and conditions of the ISET program;
- Increase capacity in case and data management through individualized training sessions; and,
- Provide a resource to support increased capacity in financial and results reporting.
These efforts improved employment outcomes for Indigenous peoples and communities.
Ontario Region
Providing outreach services
The Community Outreach and Liaison Team (COLS) helped asylum seekers by working with different government partners. These outreach services provided timely information about SIN services and the Job Bank.
Strengthened relationship with Indigenous Peoples
We made over 60 on-site visits to support and strengthen relationships and services with Indigenous clients and agreement holders. We met with Indigenous Service Delivery Partners through 55 visits to remote and urban First Nation, Inuit, and Metis communities across Ontario. Additionally, we joined 6 Indigenous conferences and events to build connections and understanding.
We supported reconciliation by hosting three engagement sessions with Indigenous Skills and Employment Training (ISET) Program Agreement Holders to address barriers to government services. We hosted two co-developed ISET Meetings and one Skills and Partnership Fund (SPF) Network Meeting to strengthen collaboration with Indigenous Peoples.
Support for employers
We worked with Ontario's Ministry of Labour, Immigration, Training and Skills Department (MLITSD) to support Canadian businesses affected by the U.S. tariff measures on Canadian goods. We coordinated joint outreach services to impacted employers, informed them about training options while receiving Employment Insurance Work-Sharing benefits, and coordinated support for affected workers.
We also explored ways to strengthen existing collaborative efforts to provide timely support to employers and employees affected by business closures and layoffs. Two key initiatives were:
- Joint Rapid Response Action Plan (JRRAP), which offers quick support to workers and employers affected by significant layoffs or closures, tailored to the specific labour market and socio-economic conditions. It involves coordination among federal and provincial governments, employers, unions, and community partners; and
- Rapid Re-employment and Training Service (RRTS) which is an initiative by the MLITSD to support workers who have been laid off, particularly large-scale layoffs.
Client focused
We upgraded six offices for accessibility and inclusivity based on the piloted enhancements introduced at the Toronto-North York Service Canada Centre (a flagship site where we test innovative, client-centric service design for potential expansion). These offices offer larger, more accessible spaces and a broader range of services. Features include:
- Accessible infrastructure: height-adjustable desks, fully accessible washrooms, door actuators, and mobility-friendly lunchrooms.
- Navigation and communication aids: tactile flooring, Bluetooth wayfinder beacons (select sites), and interpretation services (e.g., video remote sign language, telephone translation).
- Client support tools: accessible workstations, signature guides for vision impairments, and mobile workstations for queue assistance.
Improving bilingual service
In 2024-2025, we developed a targeted strategy for bilingual entry-level hiring. We engaged 162 external partners-including schools, language centres, and Francophone groups-to support bilingual recruitment and meet official language (OL) requirements.
We consulted with Official Languages (OL) Minority Communities as part of the OL Reapplication Exercise. Based on feedback, the Scarborough Passport office will be designated as bilingual to better serve the local community. This decision considered community size, office accessibility, and location, and supports the maintenance of bilingual services in Service Canada Centres.
Quebec Region
Access to services for homeless and Indigenous clients
In collaboration with the Commission de développement des ressources humaines des Premières Nations du Québec, we organized 14 mobile clinics in Montréal, Chicoutimi and Val-d'Or. These clinics brought together 13 departments and agencies to provide essential services to more than 860 Indigenous and homeless citizens, eliminating the need for travel and streamlining administrative processes.
Support for newcomers
We launched a targeted strategy to facilitate access to services for asylum seekers, focusing on two main areas:
- establishing partnerships with community organizations to expedite the issuance of Social Insurance Numbers (SIN); and
- strengthening coordination between public and community services to support rapid labour market integration.
SIN issuance for newcomers and asylum seekers is accelerated through partnerships with community organizations. We organized mobile clinics in these organizations to quickly issue the SIN as soon as newcomers arrive. We also offer information sessions on available services, including the Job Bank Plus, a platform where asylum seekers can find job offers, training and advice. Our team helps them register on this platform, which increases their visibility and employment opportunities.
Seniors' Transition to Old Age Security
We helped vulnerable seniors transition from provincial social assistance to Old Age Security benefits. This work facilitates access to the services and benefits to which they are entitled, improving their quality of life and social inclusion. In 2024-2025, the service was extended to all of Quebec. Using a personalized approach, Service Canada officers have helped more than 587 seniors, often facing language or literacy barriers, complete their Old Age Security application.
Atlantic Region
Regional Collaboration
In 2024-2025, we strengthened regional collaboration and shared resources within our organization to better support complex temporary foreign worker applications. This allowed us to handle more cases with active Labour Market Impact Assessment (LMIA) suspensions and health and safety concerns, resolve issues faster and improve worker protection.
Improving client service
Over the past year, specially trained Pensions Call Centre officers completed over 12,000 work items and significantly improving client service. This approach made better use of resources and solved more issues on the first try.
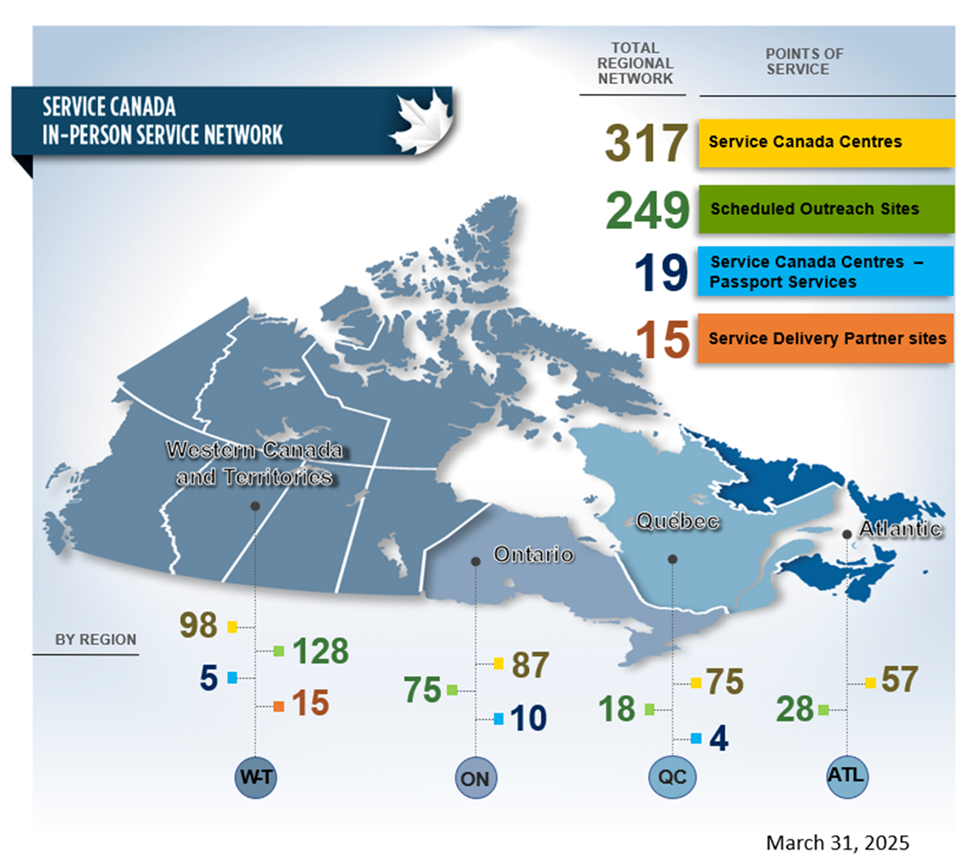
Text description of figure 1
- Service Canada Centres:
- Western Canada and Territories: 98
- Ontario: 87
- Québec: 75
- Atlantic: 57
- Total: 317
- Scheduled Outreach Sites:
- Western Canada and Territories: 128
- Ontario: 75
- Québec: 18
- Atlantic: 28
- Total: 249
- Service Canada Centres - Passport Services :
- Western Canada and Territories: 5
- Ontario: 10
- Québec: 4
- Total: 19
- Service Delivery Partner Sites:
- Western Canada and Territories: 15
- Total: 15
Results – what we achieved
Core responsibilities and internal services:
- Core responsibility 1: Social development
- Core responsibility 2: Pensions and benefits
- Core responsibility 3: Learning, skills development and employment
- Core responsibility 4: Working conditions and workplace relations
- Core responsibility 5: Information delivery and services for other government departments
- Internal services
Core responsibility 1: Social development
In this section
- Description
- Quality of life impacts
- Progress on results
- Details on results
- Resources required to achieve results
- Related government priorities
- Program inventory
Description
Increase inclusion and opportunities for Canadians to participate in their communities.
Quality of life impacts
Programs under this core responsibility contribute to several Quality of Life domains and indicators, including:
- Domain - Society (Indicators - Accessible environments, Indigenous languages, Positive perceptions of diversity, Sense of belonging to the local community, Volunteering) through activities that help remove barriers and provide racialized communities, people with disabilities, and other vulnerable groups, such as the elderly and families with children, opportunities to participate in their communities
- Domain - Prosperity (Indicators - Access to early learning and child care, Financial well-being, Protection from income shocks) through activities that increase the availability of affordable child care and support Indigenous groups to provide child care, and reduce poverty
- Domain - Good Governance (Indicator - Confidence in institutions), through activities that focus on the Sustainable Development framework, innovative projects and research that strengthen the programs of the department and the Government of Canada
Progress on results
This section details the department's performance against its targets for each departmental result under Core responsibility 1: Social development.
| Departmental Result Indicator | Target | Date to achieve target | Actual Result |
|---|---|---|---|
| Newly developed partnerships as a percentage of all partnerships developed by recipient organizations to address a range of social issues such as the social inclusion of persons with disabilities, children and families and other vulnerable populations | At least 45% | March 2025 | 2022-23: 61% 2023-24: 72.5% 2024-25: 89% |
| Departmental Result Indicator | Target | Date to achieve target | Actual Results |
|---|---|---|---|
| Number of community spaces and workplaces that are more accessible due to Enabling Accessibility Fund funding | At least 2871 | March 2025 | 2022-23: 1,048 2023-24: 437 2024-25: 425 |
| Departmental Result Indicator | Target | Date to achieve target | Actual Results |
|---|---|---|---|
| Average child care fees for regulated early learning and child care spaces | At most $10-a-day2 | March 2026 | 2022-23: As of March 31, 2023, seven provinces and territories were delivering regulated ELCC at an average of $10-a-day or less. 2023-24: As of March 31, 2023, seven provinces and territories were delivering regulated ELCC at an average of $10-a-day or less. 2024-25: As of March 31, 2023, eight provinces and territories were delivering regulated ELCC at an average of $10-a-day or less. |
| Departmental Result Indicator | Target | Date to achieve target | Actual Results |
|---|---|---|---|
| Number of targets that are being met for the published service standards of Social Development programs | 3 out of 3 | March 2025 | 2022-23: 3 out of 3 2023-24: 2 out of 34 2024-25: 2 out of 3 |
- Notes:
- The target has decreased due to Budget 2021 funding sunsetting in 2022-23. As such, the program only has its base funding of $20.65 million (grants and contributions), which limits the number of projects the program is able to fund.
- As part of the Canada-wide ELCC system, all provinces and territories signed agreements and committed to reduce fees for regulated child care to an average of $10-a-day by March 2026. The governments of Canada and Quebec signed an asymmetrical agreement given Quebec’s well established and preexisting child care system.
- Service standards are published on Transparency - Canada.ca.
- Service Standards were met in most Grants and Contributions programs. Two exceptions were the New Horizons for Seniors (NHSP) and the Social Development Partnerships Program (SDPP) programs where flexibility for clients in some administrative procedures meant the Notification of Funding Decisions Service Standard target was not met.
The Results section of the Infographic for Employment and Social Development Canada on GC Infobase page provides additional information on results and performance related to its program inventory.
Details on results
The following section describes the results for Social development in 2024-25 compared with the planned results set out in Employment and Social Development Canada's departmental plan for the year.
Affordability of early learning and child care (ELCC) is increased
Results achieved
By March 31, 2025, eight provinces and territories (Quebec, Yukon, Nunavut, Newfoundland and Labrador, PEI, Manitoba, Saskatchewan, and the Northwest Territories) offered regulated child care at an average of $10-a-day or less. All others had reduced parent fees by at least 50%. We continued working with provinces and territories to expand access to affordable, high-quality, flexible, and inclusive early learning and child care.
Workforce
In November 2024, federal, provincial and territorial ministers reviewed a draft strategy to strengthen the early learning and child care (ELCC) workforce. They discussed a path forward for working together on common goals to stabilize and support the early learning and child care workforce. By March 31, 2025, eleven provinces and territories had wage grids, top-ups or scales in place for Early Childhood Educators (ECEs). Across Canada, employment among ECEs and Assistants grew by about 2% in the past fiscal year, reaching 263,800 workers.
The National Advisory Council on Early Learning and Child Care continued to convene regularly to provide expert advice to the Government of Canada. The Council engaged with representatives from organizations who provide direct assistance to families from underserved communities, and submitted a What We Heard Report summarizing the main themes from these discussions. The Council also prepared a discussion paper on Expansion of ELCC Spaces in Canada, which highlighted challenges and proposed solutions.
ELCC Innovation Program
Fifteen innovations projects were completed in 2024-25, with the 3 remaining projects expected for completion by March 31, 2026. These projects test new approaches to improve quality, accessibility, affordability, inclusivity, and flexibility-especially for families with unique needs, including Indigenous, low-income, and families from Francophone and Anglophone minority communities.
Official Languages Action Plan
The Training and Capacity Building Initiative for ECEs in Francophone Official Language Minority Communities (OLMCs), led by the Association des collèges et universités de la francophonie canadienne (ACUFC) and funded through the 2018-2023 Action Plan for Official Languages, concluded on July 10, 2024. This initiative increased access to training and professional development by supporting 43 projects delivered by 27 organizations across all provinces and territories, except for Quebec.
Under the 2023-2028 Action Plan for Official Languages, $64.2 million was allocated for two initiatives in Francophone minority communities:
- $14.2 million in renewed funding for ECE training, strengthening skills and promoting the profession while supporting access to quality and inclusive child care programs and services; and
- $50 million to establish a national network of early childhood stakeholders (NECS) that will support the coordination and implementation of specific initiatives for Francophone minority communities across Canada.
Solicited calls were launched for each initiative and funding agreements were put in place with ACUFC and Commission nationale des parents francophones.
ELCC Data and Research
We also continued to support data and research initiatives specific to ELCC, including:
- Collaborating with Statistics Canada on multiple national surveys of the ELCC landscape with data from the third edition of the Canadian Survey on the Provision of Child Care Services (CSPCCS) was released on March 19, 2025;
- 10 research reports on ELCC an IELCC commissioned from Statistics Canada;
- Publications of ELCC and IELCC data and research on the Information Hub;
- Providing grant funding to the United Nations Educational, Scientific and Cultural Organization (UNESCO) to advance work on its early childhood care and education (ECCE) agenda, including publishing the first Global Report on ECCE; and
- Collaborating with Québec and New Brunswick to support an Organization for Economic Co-operation and Development (OECD) survey of the ELCC workforce (Teaching and Learning International Survey - Starting Strong). Initial results are expected in December 2025.
Advancing First Nations ELCC Priorities
In partnership with Indigenous Services Canada (ISC), the Public Health Agency of Canada (PHAC), and Crown-Indigenous Relations and Northern Affairs Canada (CIRNAC), we strengthened over 65 relationships with Indigenous partners to advance ELCC priorities in governance, programs and services, and infrastructure. Highlights include:
- A September 2024 Tripartite Memorandum of Understanding between the First Nations Leadership Council, Canada, and BC committing to work together on initiatives as determined by First Nations; and
- Continued implementation of major infrastructure funding from Budget 2021 to build new Indigenous ELCC centres or replace sites that have outlived their useful life. Also continued to advance funding from Budget 2021 to support urgent repairs and renovations at existing Indigenous ELCC sites; and as of March 31, 2025, over 1,500 projects have received support.
Barriers to accessibility for persons with disabilities are removed
Results achieved
Over the past fiscal year, we made significant strides in implementing the Accessible Canada Act (ACA), focusing on removing barriers and promoting inclusion through data, regulations, and community engagement. We continued to embody the principle of "Nothing Without Us" through engagement with the disability community on key activities.
Standards and Regulations
In Fall 2024, we published proposed draft amendments to the Accessible Canada Regulations which set out potential requirements for digital accessibility (or information and communication technologies, a priority area under the Accessible Canada Act), for consultation in Canada Gazette Part I. Phase 1 would focus on designing digital content (new web pages, new mobile applications and new digital documents) to be accessible from the start and building robust digital accessibility capacity in Canada.
Engagement and Funding
In May 2024, we hosted the third Canadian Congress on Disability Inclusion (CCDI), which brought together over 3,600 participants from across Canada and beyond. Attendees included persons with disabilities, disability organizations, public and private sector representatives, academics, thought leaders, and innovators. The event fostered dialogue, collaboration, and knowledge-sharing on advancing disability inclusion nationwide.
We supported five organizations in producing accessible print materials to reduce barriers for Canadians with print disabilities, helping to ensure equitable access to reading and information.
Through the Disability Benefit Navigation Program, we provided $1 million in funding to eight organizations to deliver interim navigation services, helping persons with disabilities better understand and access the Canada Disability Benefit and related supports.
Enabling Accessibility Fund
We improved safety and accessibility in communities and workplaces by funding a range of projectsFootnote 1, including:
- 9 mid-sized projects (approx. $19.7 million);
- 159 youth-led projects (approx. $1.5 million); and
- 255 small projects (approx. $23 million).
These investments supported the construction and enhancement of accessible spaces and services across the country.
Data, Research, and Measurement
- We continued to implement the Federal Data and Measurement Strategy for Accessibility (2022-2027). We launched the Strategy in 2022 and it covers a 5-year period through 2026-2027;
- We completed and published the third cycle of Public Opinion Research on Accessibility in March 2025. This research focused on the general public's level of awareness of the ACA and explored their experiences with barriers to accessibility, across six of the seven priority areas, as well as related attitudinal barriers. It was done to understand the impact of the ACA and other Government of Canada initiatives have on persons with disabilities over time.
- We released Phase 2 of the Performance Indicator Framework for Accessibility Data (PIF) in January 2025. These indicators were developed with federal partners, the disability community and data and academic experts in accessibility;
- We partnered with Statistics Canada to align data sources with performance indicators and publish results on the Accessibility Statistics data hub;
- We also collaborated with Statistics Canada on the Survey Series on Accessibility, three short surveys that provided new data on barriers to accessibility in the priority areas of employment and information communication technologies, and transportation; and
- With Statistics Canada, we published these four reports on barriers to accessibility based on data derived from 2022 Canadian Survey on Disability:
Seniors Advisory Committee (SAC) and International Engagement
In Ontario, the Seniors Advisory Committee identified service delivery gaps affecting older adults and vulnerable clients. As a result of their input, four new ramp signs were installed at the Ontario Regional Headquarters to better serve clients with mobility impairments.
Canada led its delegation to Geneva to present updates to the UN Committee on the Rights of Persons with Disabilities, highlighting progress made since its last appearance in 2017 and the submission of its 2022 report.
ESDC played a key role in supporting engagement with the disability community and National Indigenous Organizations. Following the session, the Committee issued a set of recommendations, which are currently under review in collaboration with federal, provincial, and territorial partners.
Poverty is reduced
Results achieved
Over the past fiscal year, we advanced efforts to reduce poverty through data monitoring, policy development, and collaboration:
Monitoring Poverty Trends and Market Basket Measure (MBM) Review
We tracked a slight rise in poverty rates, largely driven by the rising cost of living. In response, we analyzed how programs like the Canada Child Benefit and the Canada Disability Benefit could help mitigate impacts.
We collaborated with Statistics Canada to consolidate stakeholder feedback and released the What We Heard Report: Engagement activities for the Third Comprehensive Review of the Market Basket Measure (MBM) on October 29, 2024. Together, we also analyzed proposals for updating the MBM methodology, and expect to finalize a new methodology by the end of 2025.
Indigenous Engagement and National Advisory Council on Poverty (NACP)
We hosted regular bilateral discussions with National Indigenous Organizations to advance the co-development of poverty and well-being indicators that reflect the distinct experiences of First Nations, Inuit, and Métis. A set of indicators was finalized and officially endorsed by the Assembly of First Nations in December 2024.
We supported the Council's operations and coordinated its engagement activities. At the same time, we contributed to the drafting, publishing, and tabling of the NACP's annual report in Parliament.
National School Food Policy
Over the past year, we made meaningful progress in advancing a national school meal program. We supported the release of the National School Food Policy, which outlines a set of guiding principles, clear objectives, and a long-term vision. In parallel, we worked closely with provinces, territories, and Indigenous partners to begin implementing the National School Food Program, supported by a federal investment of $1 billion over five years.
Canada Disability Benefit (CDB)
Over the past year, the Government completed the regulatory process for the Canada Disability Benefit, marking a major milestone in advancing income support for persons with disabilities.
Developments included:
- Consulting with provinces and territories to assess how the benefit may interact with existing income-tested programs. We strongly encouraged jurisdictions not to claw back the benefit from their own supports for persons with disabilities; and
- Engaging with Modern Treaty and Self-Government partners, National Indigenous Organizations, and Nunavut Tunngavik Incorporated (NTI), in alignment with the Nunavut Agreement, to ensure inclusive and culturally appropriate implementation.
Capacity to address social issues is enhanced
Results achieved
Social Finance Fund (SFF)
As of December 31, 2024, investments from the Social Finance Fund (SFF) began reaching Social Purpose Organizations (SPOs), helping them address social and environmental challenges.
SFF wholesalers have committed over $170 million through 40 investments in 34 different social finance intermediaries and one direct investment in a SPO. These intermediaries, in turn, supported over 80 SPOs and various social finance projects, expanding access to social finance opportunities across the country.
Early data suggests at least 32% of investments at the intermediary level contributed to advancing social equity, of which 16% specifically supported gender equality.
More complete impact data, including on investments advancing social equity and/or gender equality, will be available in 2026 because of these tools.
Supporting Black Communities
We continued to invest in and support Black-led, Black-focused, and Black-serving (B3) organizations. Of note, last year:
- the Foundation for Black Communities (FFBC) funded 161 organizations totalling $9.5M to improve social and economic outcomes for Black communities;
- in addition, the FFBC published a 2024 Annual Report highlighting key activities and accomplishments.
Supporting Black Canadian Communities Initiative (SBCCI)
Last year, the SBCCI, through its Capacity Building stream, partnered with four organizations across the country to build foundational capacity in smaller B3 community-based not-for-profit organizations. We provided $15M to support 424 projects that helped build organizations' capacity to serve their communities. Funding was used for learning, equipment, and to make minor renovations to work and community spaces.
Through its Emerging Priorities stream, the SBCCI allocated $1 million to support two projects reflecting Black voices in policy and programming. This included the 2025 National Black Canadians Summit (NBCS) which welcomed over 1,500 participants, including 500 youth delegates to discuss and develop solutions for improving the social and economic outcomes of Black Canadians.
In August 2024, the Government announced $7.25 million over three years under the SBCCI's Systems Change stream to support Caribbean African Canadian Social Services (CAFCAN) in establishing the Canadian Institute for People of Afrikan Ancestry (formerly the National Institute for People of African Descent). In 2024-2025, $3 million was provided to launch the institute, whose mission is to inform and influence policy and program development at all levels of government.
We continued to advance rights, wellbeing and social inclusion of Black communities in Canada as part of our commitment towards the United Nations International Decade for People of African Descent. In April 2024, we participated in the third session of the UN Permanent Forum on People of African Descent, co-sponsoring a resolution to launch the Second International Decade (2025-2034). This reflects a whole-of-government approach to addressing systemic barriers affecting Black communities.
Social Development Partnerships Program - Disability (SDPP-D)
Through a two-year investment announced in Budget 2023, the SDPP-D funded approximately $8.8M in grants and contributions to help address the unique needs and ongoing barriers faced by persons with disabilities by investing in capacity building and the community-level work of Canada's disability organizations.
Resources required to achieve results
Table 1.5 provides a summary of the planned and actual spending and full-time equivalents required to achieve results.
| Resource | Planned | Actual |
|---|---|---|
| Gross spending | $7,930,989,184 | $8,018,859,343 |
| Net spending | $7,930,989,184 | $8,018,859,343 |
| Full-time equivalents | 529 | 658 |
Please refer to ESDC's Financial Framework for a complete description of the departmental financial profile, including an explanation of gross planned spending.
The Finances section of the Infographic for Employment and Social Development Canada on GC Infobase and the People section of the Infographic for Employment and Social Development Canada on GC Infobase provide complete financial and human resources information related to its program inventory.
Related government priorities
This section highlights government priorities that are being addressed through this core responsibility.
Gender-based Analysis Plus (GBA Plus)
Last year, we continued to monitor poverty trends across different population groups, with a focus on age cohorts (children, working-age adults, and seniors), geographic regions, family structures, and key demographic characteristics. This analysis recognizes that social and economic outcomes are shaped by intersecting identity factors such as gender, race, disability, and Indigeneity.
For example, single-parent families led by women had a poverty rate of 26.5%, compared to 18% for those led by men. This disparity reflects the cumulative impacts of gender-based labour-market inequalities, such as wage gaps, occupational segregation and limited access to flexible and secure jobs. Additionally, women-led-one-parent families often have greater caregiving responsibilities and challenges in accessing affordable high-quality childcare - factors that constrain economic mobility and perpetuate cycles of poverty. This level of understanding helps ensure that our poverty reduction efforts are responsive to the realities of Canadians.
Work continued to establish a Canada-wide Early Learning and Child Care (ELCC) system with provinces and territories that will benefit all Canadians. In the long term, it is projected to boost Canada's gross domestic product through increased labor market participation, particularly among women with young children. ELCC enables growth in the labour force participation rate of core-aged women with children under the age of six (79.3% as of March 2025), and it benefits families of lower socio-economic status, single parents, and underrepresented groups. Labour force participation of core-aged women with children under the age of six was 75.9% in 2019.
With First Nations, Inuit, and Métis Nation partners, we worked on developing a distinctions-based results framework for Indigenous Early Learning and Child Care (IELCC). We also explored approaches to expanding GBA Plus data collection, which will help us better understand how different factors might impact access to, experience of, and outcomes of this program. Any resulting distinctions-based, disaggregated data will empower Indigenous leaders to collect, manage, and share data for informed decision-making and to advance Indigenous-led priorities in ELCC.
Through the Accessible Canada Fund, we supported 18 projects which raise awareness of accessibility and inclusion in communities and workplaces. They also build partnerships between the disability community and various sectors. These projects engaged persons with disabilities and diverse groups, including Official language minority communities, 2SLGBTQIA+ communities, Indigenous peoples, and other minority groups. The projects reached thousands of Canadians through various outreach efforts like:
- Webinars on accessibility and employment;
- Multi-sector conferences addressing accessibility barriers;
- Disability-led training to challenge ableism; and
- Social media campaigns to enhance awareness and knowledge about accessibility and inclusion.
Our Social Development Partnerships Program - disability component (SDPP-D) asks organizations receiving national operating funding to train their staff on GBA Plus and to apply it to their activities and plans. Organizations report annually on their implementation of GBA Plus policies, including changes to hiring practices, mentorship programs, and staff training.
The Supporting Black Canadian Communities Initiative, in cooperation with the National Funders, collected data from recipients of the third call for proposals. The data collected was analyzed and the findings are being used to better-serve diverse Black communities across Canada. Some takeaways:
- The top mandated group served was all Black communities in Canada, followed by all African people, then newcomers and people with low-income;
- 94% of funded organizations were in an urban centre, roughly matching up to the distribution of the Black population, which is 98% urban; and
- 30 out of the 944 funded organizations served populations in Northern Canada, which is higher than the actual representation in Northern populations.
United Nations 2030 Agenda for Sustainable Development and the Sustainable Development Goals
End poverty in all its forms everywhere (SDG 1) - The Department will be launching the new Canada Disability Benefit, which aims to improve financial security for working-age Canadians with disabilities starting in July 2025.
Quality Education (SDG 4) - As of March 2024, the latest reporting period, provinces and territories reported creating nearly 95,000 new, affordable, and high-quality early learning and child care spaces. Reporting for the 2024-25 fiscal year is due to ESDC in October 2025.
Federal investments in Indigenous early learning and child care (IELCC) continued to be informed by flexible, Indigenous-led approaches guided by the co-developed IELCC Framework which reflects the unique cultures and needs of First Nations, Inuit, and Métis children across Canada.
Decent work and economic growth (SDG 8) and Industry, innovation and infrastructure (SDG 9) - In Fall 2024, proposed amendments to the Accessible Canada Regulations, which outline digital accessibility requirements, were published in the Canada Gazette Part I. These proposed rules require organizations to make new web pages, new mobile applications and new digital documents accessible for persons with disabilities. We held eight technical briefings for stakeholders from both public and private sectors.
Moreover, we engaged with various stakeholders, including with persons with disabilities, between September 2024 and January 2025, on the draft Accessible Canada Roadmap, which outlines a national vision for a barrier-free Canada by 2040. These engagements provided our department with feedback that will help inform the final Roadmap.
Additionally, in collaboration with Statistics Canada, we published initial performance indicator data in the areas of employment, information, communication and technology (ICT). The initial data on barriers to accessibility are available on the Accessibility Statistics data hub.
Partnerships for the goals (SDG 17) - We continued to lead Canada's implementation of the 2030 Agenda and its SDGs. Our work led to Canada releasing the report: Taking Action Together - Canada's 2024 Annual Report on the 2030 Agenda and the Sustainable Development Goals and delivering a national statement at the United Nations' High-Level Political Forum (HLPF) in July 2024. The annual report featured a whole-of-government and whole-of-society perspective.
More information on Employment and Social Development Canada's contributions to Canada's Federal Implementation Plan on the 2030 Agenda and the Federal Sustainable Development Strategy can be found in our Departmental Sustainable Development Strategy.
Program inventory
Social development is supported by the following programs:
- Accessible Canada Initiative
- Black-led Philanthropic Endowment Fund
- Canadian Benefit for Parents of Young Victims of Crime
- Early Learning and Child Care
- Enabling Accessibility Fund
- Indigenous Early Learning Child Care Transformation Initiative
- New Horizons for Seniors Program
- Social Development Partnerships Program
- Social Innovation and Social Finance Strategy
- Strategic Engagement and Research Program
- Sustainable Development Goals Funding Program
Additional information related to the program inventory for Social development is available on the Results page on GC InfoBase.
Core responsibility 2: Pensions and benefits
In this section:
- Description
- Quality of life impacts
- Progress on results
- Details on results
- Resources required to achieve results
- Related government priorities
- Program inventory
Description
Assist Canadians in maintaining income for retirement, and provide financial benefits to survivors, people with disabilities and their families.
Quality of life impacts
Programs under this core responsibility contribute to the following Quality of Life domain and indicators:
- Domain - Prosperity (indicators - Poverty, Household Income, Financial Wellbeing) through activities that provide Canadians with income for retirement, and financial benefits to people with disabilities, survivors of pension contributors and their families
Progress on results
This section details the department's performance against its targets for each departmental result under Core responsibility 2: Pensions and benefits.
| Departmental Result Indicator | Target | Date to achieve target | Actual Result |
|---|---|---|---|
| Percentage of seniors living in poverty | At most 7.3%1 | December 2030 | 2022-23: 5.6% (2021)2 2023-24: 6.0% (2022) 2024-25: 5.0% (2023) |
| Percentage of seniors receiving the Old Age Security Pension at age 65 and over in relation to the estimated total number of eligible seniors aged 65 and over (OAS pension take-up rate) | At least 94% | March 2025 | 2022-23: 96.7% (2020)3 2023-24: 96.5% (2021) 2024-25: 95.8% (2022) |
| Percentage of seniors receiving the Old Age Security pension at age 70 and over in relation to the estimated total number of eligible seniors aged 70 and over (OAS pension take-up rate 70+) | At least 99% | March 2025 | 2022-23: 99.0% (2020) 2023-24: 99.0% (2021) 2024-25: 98.8% (2022)4 |
| Percentage of seniors receiving the Guaranteed Income Supplement in relation to the estimated total number of eligible seniors (GIS take-up rate) | At least 90% | March 2025 | 2022-23: 91.3% (2020)5 2023-24: 89.6% (2021)6 2024-25: 90.9% (2022) |
| Percentage of Canada Pension Plan contributors aged 70+ receiving retirement benefits | At least 99% | March 2025 | 2022-23: 99% (2021) 2023-24: 98% (2022) 2024-25: 99% (2023) |
| Departmental Result Indicator | Target | Date to achieve target | Actual Results |
|---|---|---|---|
| Percentage of Canada Pension Plan contributors who have contributory eligibility for Canada Pension Plan Disability benefits and therefore have access to financial support in the event of a severe and prolonged disability | At least 68% | March 2025 | 2022-23: 65% (2021) 2023-24: 65% (2022) 2024-25: 63% (2023) |
| Percentage of Canadians approved for the Disability Tax Credit who have a Registered Disability Savings Plan to encourage private savings7 | At least 36% | December 2024 | 2022-23: 36% (2022) 2023-24: 35% (2023) 2024-25: 34% (2024) |
| Percentage of Registered Disability Savings Plan beneficiaries that have been issued a grant and/or a bond to assist them and their families to save for their long-term financial security8 | At least 74% | December 2024 | 2022-23: 76% (2022) 2023-24: 75% (2023) 2024-25: 76% (2024) |
| Departmental Result Indicator | Target | Date to achieve target | Actual Results |
|---|---|---|---|
| Number of targets that are being met for the published service standards of Pensions and Benefits programs | 10 out of 10 | March 2025 | 2022-23: 4 out of 10 2023-24: 4 out of 10 2024-25: 4 out of 1010 |
| Percentage of Canada Pension Plan Retirement Benefits paid within the first month of entitlement | At least 90% | March 2025 | 2022-23: 94.3% 2023-24: 94.3% 2024-25: 96.8% |
| Percentage of decisions on applications for a Canada Pension Plan disability benefit within 120 calendar days | At least 80% | March 2025 | 2022-23: 78.7% 2023-24: 53.2%11 2024-25: 49.3%11 |
| Percentage of Old Age Security basic benefits paid within the first month of entitlement | At least 90% | March 2025 | 2022-23: 87.6% 2023-24: 86.6%12 2024-25: 87.5%12 |
- Notes:
- The target has been updated from 6.1% (in the 2023-24 Departmental Plan) to 7.3%, which reflects Canada's current official poverty line, as provided by Statistics Canada, following the update of the Market Basket Measure to 2018 data, from 2008.
- The year in parentheses is the most recent for which tax -data is available.
- Since 2013, seniors can delay receiving their OAS pension until age 70 for higher monthly benefits. This affects the OAS pension take-up rate. For this reason, the Department also measures OAS pension take-up among eligible seniors aged 70 and over.
- There is not sufficient information or data to identify the direct cause of the 0.2% reduction, however, we are exploring various factors (e.g. increase in pension deferral for seniors 65+, administrative delays, etc.) that could have contributed to the decrease as part of a deeper dive on take-up for pensions programs.
- For the three years of GIS take-up results presented in this table, the calculation of this indicator was updated to leverage additional data available in Statistics Canada's Longitudinal Administrative Databank. This update allows the calculation to more closely reflect income sources and credits used in the determination of GIS benefit entitlement.
- Results are impacted by COVID 19 pandemic-related disruptions in seniors' income. Also, since June 2020, the expanded GIS earnings exemption has made more low-income Canadian seniors who work eligible for the GIS. Through targeted outreach activities, the Department reaches out to seniors who could be eligible for the GIS and invites them to apply for the benefit.
- The target and results are reported by calendar year, as eligibility criteria and entitlements are based on the calendar year. Indicators refer to beneficiaries aged 0 to 49 years.
- The small decline in RDSP take up rate is attributable to a higher growth rate for DTC than RDSP over the reference period.
- Service standards are published on Transparency - Canada.ca.
- The indicator measures whether the service standards are met for the following 10 indicators: Canada Pension Plan (CPP) retirement benefits are paid within the first month of entitlement; CPP payments are accurate; CPP calls are answered by an agent within 10 minutes; Canada Pension Plan Disability (CPPD) benefit application decisions are made within 120 calendar days of receiving a complete application; A decision for CPPD benefit applicants with a terminal illness is made within 5 business days of receiving a complete terminal illness application; A decision for CPPD benefit applicants with a grave condition is made within 30 calendar days of receiving a complete application; A decision on a CPPD benefit reconsideration request is made within 120 calendar days of receiving the reconsideration request; Old Age Security (OAS) basic benefits are paid within the first month of entitlement; OAS payments are accurate; and OAS calls are answered by an agent within 10 minutes.
Service Canada strives to improve overall results where service standards are not met. The OAS and CPPD programs experienced increases in inventories caused by changing demographics and increased complexity, which impacted speed of service results. In response: We implemented strategies to reduce the volume of older work in the inventory in preparation for the transition to the new common benefit delivery platform (Cúram) and to improve service delivery results. The CPPD program implemented short-term measures to increase capacity, streamline processes, and enhance operational efficiency through process automations. To improve service levels, the Pensions Call Centre increased capacity to better meet call demand, anticipating improvement in performance throughout fiscal year 2024-25 as officers gain experience and proficiency. - Recent growth in CPPD inventories were caused by processing capacity challenges and an increase in complex cases. Applications due to mental health and cognitive disabilities are on an upward trend, now representing 34% of CPPD applications. The CPPD Action Plan has been implemented with the goal of increasing capacity, containing inventory and simplifying processes. Service Canada implemented workload and workforce strategies to begin addressing these inventory pressures.
- Last year, OAS application inventories were higher than our capacity to process in a timely manner. This was primarily due to: technological challenges, increased workload complexity due to changing demographics regarding clients' residence and working histories, and workforce capacity. Service delivery results improved in 2024-25 as compared to 2023-24.
The Results section of the Infographic for Employment and Social Development Canada on GC Infobase page provides additional information on results and performance related to its program inventory.
Details on results
The following section describes the results for Pensions and benefits in 2024-25 compared with the planned results set out in Employment and Social Development Canada's departmental plan for the year.
Seniors have income support for retirement
Results achieved
Old Age Security
The OAS program provides a minimum income to seniors and contributes to their income replacement in retirement. Last year, OAS provided $80 billion in benefits to 7.4 million people. This included:
- $60.6 billion in OAS pension benefits;
- $18.9 billion in Guaranteed Income Supplement (GIS) benefits paid to 2.5 million low-income seniors; and
- $632 million in Allowance benefits paid to 68,664 near-seniors.
On March 17, 2025, the OAS legacy system was successfully migrated to the new Cúram platform, which now supports 7.4M clients and over 6,600 staff. The new system makes it easier for Canadians to apply for and manage benefits. Prior to release, both system and business readiness were thoroughly evaluated to ensure a smooth transition. This work included:
- Conducting three Business Pilot cycles to validate operational capabilities, identify improvements, and increase confidence in the system;
- Testing the system which yielded 99.9% accuracy rate across data migration, payment accuracy, and data matching;
- Training over 5,300 employees; and
- Developing contingency plans to ensure business continuity in case of emergency.
The new platform improves service delivery, reduces wait times, and ensures faster, more accurate payments. Clients can now apply online, upload documents, update personal information, and track application status. In the 10 weeks following implementation, online applications reduced processing times and saved 2,907 staff hours. The first payment run from Cúram was issued on April 28, 2025.
Canada Pension Plan
January 2025 marked the end of the Canada Pension Plan's (CPP) 7-year enhancement phase-in. Together, the base and enhancement portions of the CPP retirement pension will replace one-third (33.33%) of the earnings of Canadian workers, up from one-quarter (25%). The level of earning covered by the Plan was also increased by 14%. Together, these changes will boost the maximum CPP retirement pension by more than 50% for today's youngest workers, in addition to raising the amounts provided by the CPP's disability pension and survivor's pension.
- As part of the 2022-2024 Triennial Review, amendments were made to the CPP that do not affect contribution rates: Creating new benefits for dependent children of disabled or deceased contributors attending school part-time. They consist of a monthly flat rate benefit of $150.89;
- Adding a top-up to the death benefit for CPP contributors who die before claiming a retirement or disability pension and leave behind no spouse or common-law partner. The value of the top-up is $2,500, added to the existing death benefit of $2,500 (total $5,000);
- Extending eligibility for the Disabled Contributor's Child's Benefit (DCCB) when the parent reaches age 65. This ensures that children remain eligible for the DCCB when their parent transitions from a disability to a retirement pension at age 65; and
- Extending the CPP incapacity provisions to protect the DCCB. The amendment ensures that when someone receives retroactive CPP disability payment as a result of incapacity, the same extension applies to any children's benefits requested at the same time.
Persons with disabilities and their families have financial support
Results achieved
Canada Pension Plan - Disability program and Pilot Project
In 2024-2025, we ensured that Canadians with severe and prolonged disabilities, and their families, continued to receive financial support through the Canada Pension Plan - Disability (CPPD) program.
To strengthen program integrity and responsiveness, we expanded the quality assurance program to include:
- Directed studies on applications involving terminal illnesses and grave medical conditions; and
- Annual reviews of both initial and reconsideration decisions.
Findings from these studies and reviews continue to inform ongoing improvements to CPPD, helping ensure timely and fair access to benefits for those who need them most.
In April 2024, we launched a pilot project to improve return-to-work supports for beneficiaries to assess their ability to work. Part of Canada's Disability Inclusion Action Plan, it tests personalized help from Navigators, who provide benefit counselling, check-ins, goal setting, and referrals for vocational rehabilitation. The pilot also include a longer 12-month work trial and enhanced vocational rehabilitation services.
During the first year of the pilot, 71% of invited CPPD beneficiaries chose to participate and preliminary results indicate promising outcomes for supporting beneficiaries in returning to work and improving their financial stability.
- As of March 2025, most participants were returning to work for the first time, with 60% having received CPPD benefits for less than five years;
- 40% of participants earned more income and 25% had an increase in work activities compared to a control group that did not receive these additional supports; and
- 76% of pilot participants on the 3-month work trial with a navigator maintained gainful employment and no longer received CPPD benefits, compared to 53% without a navigator. Cases and decisions were also processed faster than in the control group.
Canada Disability Savings programs
In collaboration with the Canada Revenue Agency (CRA), we did targeted outreach to increase awareness and uptake of the Registered Disability Savings Plan (RDSP):
- Targeted Mail Campaign: Over 31,000 promotional letters were sent to Disability Tax Credit-approved individuals aged 45-49 who had not yet opened an RDSP. In the four months that followed, the average number of new monthly RDSPs doubled.
- In-Person and Virtual Outreach: We participated in six in-person events promoting the Disability Tax Credit, RDSP, and associated grants and bonds-half of which focused on youth with disabilities transitioning out of high school. Four teleconferences were held to help recipients learn more about the Canada Disability Savings Program (CDSP). Additionally, we delivered 73 outreach webinars to a total of 2,330 attendees, most of which were organized in close collaboration with community organizations.
- Educational Materials: Approximately 4,000 copies of an infographic explaining how to open an RDSP and apply for the grant and bond, were distributed to community organizations and CRA outreach teams to support their efforts in encouraging RDSP uptake.
Resources required to achieve results
Table 2.4 provides a summary of the planned and actual spending and full-time equivalents required to achieve results.
| Resource | Planned | Actual |
|---|---|---|
| Gross spending | $148,006,897,563 | $147,165,165,946 |
| Net spending | $82,359,460,288 | $81,688,146,091 |
| Full-time equivalents | 7,522 | 8,446 |
Please refer to ESDC's Financial Framework for a complete description of the departmental financial profile, including an explanation of gross planned spending.
The Finances section of the Infographic for Employment and Social Development Canada on GC Infobase and the People section of the Infographic for Employment and Social Development Canada on GC Infobase provide complete financial and human resources information related to its program inventory.
Related government priorities
This section highlights government priorities that are being addressed through this core responsibility.
Gender-based Analysis Plus
The 2022-2024 Triennial Review made modest amendments to the Canada Pension Plan (CPP) that benefit some marginalized individuals. For example, new benefits for part-time students and extended eligibility rules for the Disabled Contributor's Child's Benefit improve financial support for children whose parents are disabled or deceased. Additionally, a new top-up to the death benefit offers more financial coverage for contributors without a spouse or common-law partner.
United Nations 2030 Agenda for Sustainable Development and the Sustainable Development Goals (SDGs)
End poverty in all its forms everywhere (SDG 1) - To ensure they retain their value over time, Old Age Security (OAS) benefits are reviewed four times per year (January, April, July and October) against the Consumer Price Index (CPI).
In fiscal year 2024-2025, OAS program benefits increased by 2% cumulatively:
- 0% in April 2024.
- 0.7% in July 2024.
- 1.3% in October 2024.
- 0% in January 2025.
Achieve gender equality and empower all women and girls (SDG 5) - In 2024-2025, more women than men (58% vs. 42%) benefitted from the GIS, and predominantly more women than men (85% vs. 15%) benefitted from the Allowances.
In addition, more women than men (56% vs. 44%) were OAS pensioners aged 75 and over, and were receiving a higher pension amount as a result of the permanent increase to the OAS pension for seniors aged 75 and over, which started in July 2022.
More information on Employment and Social Development Canada's contributions to Canada's Federal Implementation Plan on the 2030 Agenda and the Federal Sustainable Development Strategy can be found in our Departmental Sustainable Development Strategy.
Program inventory
Pensions and benefits are supported by the following programs:
- Canada Disability Savings Program
- Canada Pension Plan
- Old Age Security
Additional information related to the program inventory for Social development is available on the Results page on GC InfoBase.
Core responsibility 3: Learning, skills development and employment
In this section:
- Description
- Quality of life impacts
- Progress on results
- Details on results
- Resources required to achieve results
- Related government priorities
- Program inventory
Description
Help Canadians access post-secondary education, obtain the skills and training needed to participate in a changing labour market, and provide supports to those who are temporarily unemployed.
Quality of life impacts
Programs under this core responsibility contribute to several Quality of Life domains and indicators, including:
- Domain - Prosperity (Indicators - Postsecondary attainment, Youth not in employment, education or training [NEET], Child, student and adult skills, Protection from income shocks, Employment, Financial well-being, Labour underutilization) through programs that help Canadians access post-secondary education and assist Indigenous people, youth, and other groups obtain the training they need to participate in the labour market or return to school. In addition, programs provide support to individuals who are temporarily unemployed and to employers with labour needs
- Domain - Society (Indicators - Knowledge of official languages, Sense of belonging to local community and Volunteering), through programs that help Canadians in official language minority communities obtain the skills and training they need to find employment in their communities
Progress on results
This section details the department's performance against its targets for each departmental result under Core responsibility 3: Learning, skills development and employment.
| Departmental Result Indicator | Target | Date to achieve target | Actual Result |
|---|---|---|---|
| Employment or returns to school following provincially or territorially delivered skills training and/or employment services supported by Government of Canada funding transfers | Not available1 | March 2025 | 2022-23: 373,654 (2021-22)2 2023-24: 334,605 (2022-23)2 2024-25: 341,084 (2023-24)2 |
| Number of Canadians receiving provincially or territorially delivered skills training and/or employment services supported by Government of Canada funding transfers | Not available1 | March 2025 | 2022-23: 671,349 (2021-22)2 2023-24: 716,005 (2022-23)2 2024-25: 797,513 (2023-24)2 |
| Employment or returns to school following training/supports through federally administered programs | 139,0943 | March 2025 | 2022-23: 132,975 2023-24: 102,594 2024-25: 53,7464 |
| Number of Canadians receiving training and/or employment supports through federally administered programs | 316,551 | March 2025 | 2022-23: 269,607 2023-24: 408,611 2024-25: 355,8735 |
| Percentage change in Canadians aged 25 to 64 enrolled in university or college | Between a 1.5% decrease and a 1.5% increase (2024) | March 2025 | 2022-23: 2.6% decrease (2022) 2023-24: 2.2% increase (2023) 2024-25: 7.2% increase (2024) |
| Percentage of Canadians between the ages of 18 and 24 that are enrolled in university or college | At least 44.8% (2024) | March 2025 | 2022-23: 44.5% (2022) 2023-24: 44.3% (2023) 2024-25: 44.8% (2024) |
| Departmental Result Indicator | Target | Date to achieve target | Actual Results |
|---|---|---|---|
| Difference in the employment rate between Indigenous peoples (First Nations status and non-status, Inuit and Métis) and non-Indigenous peoples6 | At most 12.4 percentage points | March 2027 | 2022-23: 14.1 percentage points (Census 2021) 2023-24: 14.1 percentage points (Census 2021) 2024-25: 14.1 percentage points (Census 2021) |
| Difference in the employment rate between persons with disabilities and persons without disabilities6 | At most 14.0 percentage points | March 2028 | 2022-23: 16.0 percentage points (2022 Canadian Survey of Disability) 2023-24: 16.0 percentage points (2022 Canadian Survey of Disability) 2024-25: 16.0 percentage points (2022 Canadian Survey of Disability) |
| Difference in the employment rate between women and men6 | At most 5.6 percentage points | March 2027 | 2022-23: 6.1 percentage points (Census 2021)7 2023-24: 6.1 percentage points (Census 2021)7 2024-25: 6.1 percentage points (Census 2021)7 |
| Difference in the employment rate gap between visible minority group members and the non-visible minority population6 | At most 3.7 percentage points | March 2027 | 2022-23: 4.6 percentage points (Census 2021) 2023-24: 4.6 percentage points (Census 2021) 2024-25: 4.6 percentage points (Census 2021) |
| Departmental Result Indicator | Target | Date to achieve target | Actual Results |
|---|---|---|---|
| Beneficiary to Unemployed Contributor ratio (B/UC ratio) | 64.3% | March 2025 | 2022-23: Not available (2021-2022)8 2023-24: 73.4% (2022-2023) 2024-25: 60.4% (2023-24)8 |
| Departmental Result Indicator | Target | Date to achieve target | Actual Results |
|---|---|---|---|
| Percentage of low- and middle-income Canadian young adults participating in Post-Secondary Education | At least 52.0% (2021) | March 2025 | 2022-23: 51.5% (2019) 2023-24: 51.9% (2020) 2024-25: 50.9% (2021)9 |
| Percentage of children under 18 who were eligible for the Canada Learning Bond and/or the additional amount of the Canada Education Savings Grant and were provided with any of those benefits in the current year | At least 30% (2021) | December 2024 | 2022-23: 32.2% (2020) 2023-24: 31.6% (2021) 2024-25: 31.7% (2022)10 |
| Departmental Result Indicator | Target | Date to achieve target | Actual Results |
|---|---|---|---|
| The percentage of loans in repayment that are paid each year | At least 12% | March 2025 | 2022-23: 15.8% (2021-22) 2023-24: 15.1% (2022 to 2023) 2024-25: 13.1% (2023-24)11 |
| Departmental Result Indicator | Target | Date to achieve target | Actual Results |
|---|---|---|---|
| Number of targets that are being met for the published service standards of Learning, Skills Development and Employment programs13 | 25 out of 25 | March 2025 | 2022-23: 19 out of 23 2023-24: 20 out of 25 2024-25: 19 out of 25 |
| Percentage of Employment Insurance benefit payments or non-benefit notifications issued within 28 days of filing | At least 80% | March 2025 | 2022-23: 76.2% 2023-24: 86.4% 2024-25: 87.4% |
| Percentage of Employment Insurance requests for reconsideration reviewed within 30 days of filing | At least 80% | March 2025 | 2022-23: 33.8% 2023-24: 53.1% 2024-25: 25.3%14 |
| Percentage of Social Insurance Numbers applied for through the Newborn Registration Service issued within 10 business days | 100% | March 2025 | 2022-23: 100% 2023-24: 100% 2024-25: 100% |
| Percentage of registrations to My Service Canada Account through Trusted Digital Identities in participating provinces/territories | At least 5% | March 2025 | 2022-23: 7.75% 2023-24: 6.99% 2024-25: 7.15% |
- Notes:
- Though provincially and territorially (P/T) delivered programs set their own annual targets, results are reported annually.
- The results are for both Labour Market Development Agreements (LMDAs) and Workforce Development Agreements (WDAs). As there is a one-year lag in data availability, the results reflect previous year's result.
- The 139,094 target erroneously included 40,000 participants from the Student Work Placement Program; therefore, the target should have been set at 99,094.
- This result includes the actual number of participants who found employment or returned to school following their participation in various federally funded programs. It consists of results from the following programs: Community Workforce Development Program (CWDP) 48; Indigenous Skills and Employment Training Program (ISET) 26,002; Skills for Success (SFS) 1,602; while not included in the initial target, the Skills and Partnership Fund reported a result of 1,255; and the result for the Youth Employment and Skills Strategy (YESS) is 24,839, (which represents ESDC-delivered Youth Employment and Skills Strategy Program (YESSP) 5,511 and Canada Summer Jobs (CSJ) 19,328. The result appears significantly lower than the target for the following two reasons: 1) the results for the OFPWD were not available at the time of publication and will be reported in the next DRR, and 2) more notably, the result for CSJ is based on data collected from a voluntary survey of all the youth served (72,779 youth) where the survey response rate was of 30%. Of those who responded, 86.5% indicated being employed or having returned to school. If we apply this percentage to all participants, we could infer that an estimate of over 62,900 youth would have been employed or returned to school following participation in CSJ.
- This result includes the actual number of participants that took training or received employment supports through the following federally delivered programs: Canadian Apprenticeship Strategy (CAS) 77,447; Community Workforce Development Program (CWDP) 422; Future Skills (FS) 46,053 participants from innovation projects; Indigenous Skills and Employment Training Program (ISET) 48,570; Opportunities Fund for Persons with Disabilities (OF-PwD) )(results were not available at the time of publication and will be reported in the next DRR); Sectoral Workforce Solutions Programs (SWSP) 13,982; Skills for Success (SFS) 35,614; Student Work Placement Program (SWPP) 51,320 opportunities (21,775 work placements and 29,545 Innovative Work-Integrated Learning Initiative); Youth Employment and Skills Strategy (YESS) 82,465, (which represents ESDC-delivered Youth Employment and Skills Strategy Program (YESSP) 9,686 and Canada Summer Jobs (CSJ) 72,779). Note there was a mistake in the departmental plan for the YESS targets. The target for the YESSP component erroneously included total targets for partner departments set at 23,806 instead of just ESDC's contribution. This oversight incorrectly presented the total target for YESS at 93,806. The correct targets should have been for ESDC set at 75,240 for YESS and 5,240 for YESSP, and 70,000 for CSJ.
- Many factors can affect employment rates within specific groups, and these factors may affect groups differently. The programs we offer represent one of various factors that can influence changes to the employment rate gaps.
- Due to the temporary changes to the EI Program that were put in place in response to the COVID-19 pandemic, results for fiscal years 2021-22 cannot be reported.
- In previous years', access to EI regular benefits was measured by the B/UC ratio. This ratio was based on 2 data sources: average number of beneficiaries of EI regular benefits reported in Statistics Canada's monthly EI Statistics (B) and the number of unemployed contributors (UC) obtained from the EICS. Starting with the 2023-24 MAR, the B/UC rate (not ratio) is reported as a measure of access to EI regular benefits. The rate's numerator and denominator are both obtained from the EICS. As a result of this change in methodology, the result for fiscal year 2023-2024 is not comparable to those of previous years, nor to the target which was established under the previous methodology.
- The target was not met likely due to pandemic-related disruptions in post-secondary attendance among low- and middle-income youth, though other contributing factors may have also played a role.
- This indicator is produced using CESP administrative data linked to the Longitudinal Administrative Databank (LAD) on Statistics Canada's Education and Labour Market Longitudinal Platform (ELMLP). Based on data availability, we used 2020 results for fiscal year 2022-23, 2021 results for fiscal year 2023-24 and 2022 results for fiscal year 2024-25.
- There is a one-year lag in reporting for this indicator due to data availability.
- Service standards are published on Transparency - Canada.ca
- We are gradually recovering from a historic sudden increase in requests for reconsideration that occurred in 2021-22. The low speed of service result is due to the 1.9 million Employment Insurance Emergency Response Benefit overpayments that were sent to clients starting in November 2021. The request for reconsideration inventory has aged and 95% of the requests are 31 days or older. As a result, when the majority of requests for reconsideration are processed past the 30-day target, speed of service results is low.
- Request for Reconsideration (RFR), speed of service declined in fiscal year 2024-25 because the overall RFR inventory continued to grow (from 89,276 on April 1, 2024, to 95,535 on March 31, 2025) due to prioritization of work to put clients into pay, which created additional RFRs during the Inventory Stabilization Strategy. Training of additional capacity and upskilling to reduce the RFR inventory began in April 2025. Strategies are being developed (such as triaging and prioritization) to increase efficiency in processing these files. As inventories begin to decline, speed of service will remain low for a period due to the age of the inventory. Speed of service will improve significantly as inventories reach a sustainable level and are processed within 30 days.
The Results section of the Infographic for Employment and Social Development Canada on GC Infobase page provides additional information on results and performance related to its program inventory.
Details on results
The following section describes the results for Learning, skills development and employment in 2024-25 compared with the planned results set out in Employment and Social Development Canada's departmental plan for the year.
Students, including those from low- and middle-income families, are provided with federally funded supports to help them participate in post-secondary education (PSE)
Results achieved
Under the Canada Education Savings Program (CESP), we worked with community partners and stakeholders to promote the Canada Learning Bond (CLB) and help families access education savings benefits. Outreach efforts focused on two key updates:
- New automatic enrolment for eligible children; and
- Plans to expand eligibility for adult beneficiaries, increasing the age limit from 20 to 30, as announced in Budget 2024.
CESP-led information sessions and online resources helped families navigate the process of opening a Registered Education Savings Plan (RESP) and applying for Government of Canada education savings benefits.
To further support youth facing barriers to education, we funded the Supports for Student Learning Program (SSLP). In 2024-2025, the program supported approximately 154,000 students, equipping them with the skills and confidence needed to succeed in school and the labour market. Through the Student and Afterschool Supports stream, 147,734 learners were supported in completing high school and transitioning to post-secondary education.
Additionally, through the Global Skills Opportunity stream, 6,147 Canadian post-secondary students received assistance to study or work abroad. This pilot initiative helped students gain valuable international experience and enhanced their employability in a global economy.
Student borrowers are able to repay their federal student debt
Results achieved
Budget 2024 committed to enhancing student financial assistance for the 2024-25 academic year.
Student Grants and Loans
Last year, we strengthened financial support for post-secondary students through the Canada Student Financial Assistance (CSFA) Program:
- Canada Student Grants were increased by 40%, with eligible students receiving:
- Up to $4,200 for full-time studies; and
- Up to $2,520 for part-time studies.
- Grants for Students with Disabilities increased from $2,000 to $2,800, and full-time students with dependents could receive up to $280 per dependent, per month of study. These measures are expected to benefit approximately 587,000 students.
- The interest-free Canada Student Loan limit increased from $210 to $300 per week, supporting around 297,000 students.
- To better reflect actual housing costs faced by students, the program modernized shelter allowances used in financial need assessments-an update expected to support approximately 79,000 students annually.
- We permanently eliminated the credit screening requirement for mature students applying for Canada Student Grants and Loans for the first time. This is expected to enable up to 1,000 additional students per year to access federal student aid.
Detailed results for the 2024-2025 academic year will be published in the CSFA Program Annual Report and Statistical Review, scheduled for release in Summer 2026.
Student Loan Forgiveness
As of November 2024, we expanded the reach of the Canada Student Loan (CSL) Forgiveness benefit to improve access to health care and social services in rural communities. The definition of a rural or remote community was updated to include areas with populations of 30,000 or fewer, increasing access to healthcare in these regions.
Budget 2024 announced plans to further expand this forgiveness benefit to 10 more healthcare and social services professionals in rural and remote areas. This includes:
- Dentists
- dental hygienists
- early childhood educators
- pharmacists
- midwives
- teachers
- social workers
- personal support workers
- physiotherapists
- psychologists
Canadians access education, training and lifelong learning supports to gain the skills and work experience they need
Results achieved
Future Skills Centre (FSC)
In 2024-2025, we continued to fund the Future Skills Centre (FSC) as an independent innovation and applied research centre. Their work focused on helping Canadians learn new skills for jobs that are in high demand. FSC shared success stories and best practices from their research and innovation projects. Their goal was to provide reliable, evidence based information to workers, employers, and decision makers. Through their innovation projects, over 46,000 individuals received training or employment supports.
FSC maintained 109 partnerships with the private sector, public sector, and non-profit organizations. Of these:
- 4 focused on improving labour market outcomes for Indigenous Peoples; and
- 94 supported other groups underrepresented in the labour market, such as youth, persons with disabilities, newcomers, refugees, Black communities, and those living in rural or remote areas.
Insights from research and innovation were shared through 1,681 engagement activities which addressed various skills development challenges.
With FSC, ESDC hosted five Policy Roundtables for senior leaders from federal, provincial, and territorial governments to discuss pressing workforce development issues impacting Canadians and government priorities, such as:
- artificial intelligence (AI) and digital adoption
- newcomer integration
- skilled trades
- youth employment
- workforce transition to a net-zero economy
In addition, FSC advanced its Data Practitioner Initiative which aims to build data capacity among funded organizations to better design and evaluate training interventions. In Fall 2024, Blueprint ADE completed the final evaluation report for this initiative which was published in February 2025.
Labour and Workforce Development
We invested $2.9 billion in training and employment assistance for individuals and employers through the Labour Market Development Agreements (LMDAs) and the Workforce Development Agreements (WDAs) with provinces and territories.
These investments helped Canadians:
- Get the support they need to prepare for and find good jobs;
- Get additional skills to advance in their careers, including through apprenticeships; and
- Maintain their employment for those at risk of job loss.
The investments also supported employers by funding training for Canadians in high growth sectors.
Through the LMDAs and WDAs with the provinces and territories, we provided 1.3 million training and employment services to approximately 800,000 Canadians.
Addressing Workforce Needs
Under the Sectoral Workforce Solutions Program, we supported 33 multi-year projects to help key sectors of the economy address current and emerging workforce needs. Specifically:
- 21 in the tourism sector;
- 1 in the health sector;
- 1 in the information and communication technology sector;
- 1 focused on the development of labour market information and tools; and
- 9 to help remove barriers and support employment opportunities for persons with disabilities across multiple sectors.
Through these projects, the department funded training and reskilling activities to 13,982 Canadians including 6,592 from equity deserving groups as well as Indigenous Peoples.
Sustainable Jobs Training Fund
In 2024-2025, we launched the Sustainable Jobs Training Fund to help workers gain the skills needed for employment in the low-carbon economy. The fund targets sectors such as:
- Low-carbon energy and carbon management
- Green buildings and retrofits
- Electric vehicle maintenance and charging infrastructure
Following a call for proposals (CFP) , successful projects were announced in February 2025, representing a total investment of $75 million. These projects aim to support up to 15,000 workers and will run until March 31, 2028.
Community Workforce Development Program
In 2024-2025, the Community Workforce Development Program continued to test innovative, place-based approaches to community economic development through four Indigenous-led projects. Over 420 participants received training or employment supports. These projects reached 64 rural and remote communities across the country.
Foreign Credential Recognition Program (FCRP)
In 2024-2025, the Foreign Credential Recognition Program (FCRP) continued to support internationally trained professionals by funding projects with provinces, territories, regulatory bodies, and other organizations. These efforts helped individuals integrate into the Canadian labour market more quickly and effectively.
Thousands of people also benefited indirectly from systems improvement projects that made credential recognition processes faster and more efficient.
We provided direct support to over 5,200 internationally trained professionals, including:
- Over 600 individuals who received nearly $5.3 million in loans to cover credential recognition-related expenses; and
- 4,600 individuals who gained Canadian work experience through employment supports such as work placements, wage subsidies, training, mentoring and coaching, to help these professionals gain Canadian work experience in their field of study to fully utilize their skills and talent.
Budget 2024 provided an additional $50 million over two years starting in 2024-2025 for this program, with a focus on the residential construction and health care sectors.
In 2024-2025, the FCRP funded five new multi-year projects for a total of $23,357,275:
- 1 in the residential construction sector that will support up to 1,500 internationally-trained tradespersons; and
- 4 in the healthcare sector that will support up to 2,000 internationally-educated health professionals.
In late 2024-2025, 16 new projects worth approximately $52 million were approved:
- 8 will focus on the residential construction sector and support up to 2,000 participants;
- 7 will focus on the healthcare sector and support up to 1,200 participants; and
- 1 project covers both categories and will support up to 1,000 participants in construction and 460 in the healthcare sector.
Supporting Workers
Members of the Union-Led Advisory Table (ULAT) met monthly consulted widely and shared recommendations. They heard from 12 labour market experts and published their final report in February 2025.
This report includes 14 general recommendations and 39 specific areas for action to help workers navigate the changing labour market. Table members shared these recommendations with their networks, as well as with the Department. We, in turn, shared it with other federal partners including Finance Canada, the Privy Council Office, and Industry, Science and Economic Development.
The recommendations were also discussed with a broad cross-section of labour market stakeholders at the 2024 Workforce Summit in October 2024. ULAT recommendations are being considered in ESDC policy and program design discussions.
Increase employment opportunities for youth
Results achieved
In 2024-2025, we led the Youth Employment and Skills Strategy (YESS) in partnership with 11 other federal departments, agencies, and Crown corporations. YESS helps youth-particularly those facing barriers-gain the skills, work experience, and supports needed to successfully transition into the labour market.
Last year, the YESS Program (YESSP) served 24,735 youth, including 9,686 directly supported by our department. A new series of projects was launched to support youth in their employment journeys, resulting in:
- Over 240 projects that will help, over four years, more than 23,600 youth facing multiple barriers develop skills and gain work experience needed to secure good jobs; and
- Six new projects focusing on cross-sector partnerships to develop and test innovative solutions to systemic challenges in youth employment.
YESS also includes the Canada Summer Jobs (CSJ) program, which is solely delivered by our department. In 2024-2025, CSJ:
- surpassed its target, creating 72,779 job opportunities for youth across Canada;
- supported youth facing barriers; and
- contributed to sectors such as housing construction and sustainable jobs.
We also delivered on our commitment to display CSJ job opportunities on our Youth targeted page and mobile app. During fiscal year 2024-2025, Job Bank displayed 56,829 CSJ job postings and 94,274 vacancies from 26,405 Canadian employers during the 2024 campaign, garnering over 733,355 views.
In 2024-2025, the Student Work Placement Program (SWPP) supported the creation of work integrated learning (WIL) opportunities for students of all ages enrolled at Canadian post-secondary education institutions. This was done in partnership with 24 funding recipients, including sector-based associations and national organizations that represent key industries across Canada. The SWPP delivered over 50,000 WIL opportunities, surpassing the target of 40,000 opportunities. These opportunities supported students in fields such as information technology (including AI), environmental sustainability, agriculture, manufacture, and transportation.
In 2024-2025, through Canada Service Corps (CSC), we delivered 2,861 volunteer service opportunities, including:
- 1,981 youth-led projects; and
- 880 service placement projects.
Support apprenticeship training and access to skilled trades
Results achieved
Through the Canadian Apprenticeship Strategy, we supported the participation of 34,185 individuals in skills training activities, including apprentices, employers, and tradespeople. The strategy provides a framework for federal apprenticeship initiatives that support a skilled, inclusive, certified, and productive trades workforce. It includes measures such as:
- the Union Training and Innovation Program;
- the Skilled Trades Awareness and Readiness Program; and
- the Women in the Skilled Trades Program.
In 2024-2025, 62,304 Apprenticeship Grants were issued to apprentices. The apprenticeship grants program ended on March 31, 2025.
Projects funded under CAS' new Sustainable Jobs Stream delivered as part of the Union Training and Innovation Program are expected to begin in summer 2025, with results expected by summer 2026. Delays in finalizing the program design and implementation impacted the launch which took place in June 2024.
We supported the development of standards and exams to help labour mobility, align apprenticeship training, and ensure uniform certification tools for the trades. In 2024-2025, we finalized eight interprovincial standards and 11 exams for three trades. Due to an increase in exam development and Red Seal Program activities, some exams were not completed last year as anticipated. These will instead be finalized in 2025-2026.
Canadians participate in an inclusive and efficient labour market
Results achieved
Disability Inclusion
The Disability Inclusion Business Council continued to support the Canadian Business Disability Network in its mission to help businesses and employers adopt best practices for disability inclusion. The Council, which operates independently from the Government of Canada, released its final report on disability inclusion in Canadian workplaces in November 2024.
Indigenous Skills and Employment Training (ISET)
Through the ISET Program, we provided funding to Indigenous service delivery organizations and governments, empowering them to offer essential training in support of their communities.
Last year, we funded 119 Indigenous service delivery organizations who supported more than 54,500 Indigenous participants, including over 48,500 new participants. As a result, 18,717 individuals secured employment, and 7,285 returned to school to pursue further training and development opportunities.
We also worked with Indigenous partners to co-develop the evaluation of this program, which is anticipated to be completed in 2025-2026. This collaboration will provide a holistic perspective on how the program impacts Indigenous participants and communities.
The ISET program underscores our dedication to advancing reconciliation and contributes to the Government of Canada's Action Plan on the United Nations Declaration on the Rights of Indigenous Peoples (UNDRIP) by fostering self-determination in skills training and employment.
We also continued efforts to collaborate with Indigenous governments and partners to uphold inherent and treaty rights. Bilateral engagement was strengthened with national Indigenous partners, representing First Nations, Inuit, and Métis governments and rights holders. Funded through flexible Engagement Protocol Agreements, these partners continued to support collaborative engagement through:
- Broad strategies like the 2030 Agenda and the Sustainable Development Goals, which included many common priorities with Indigenous governments and rights holders;
- Indigenous-led programs like the Indigenous Early Learning and Child Care Program. These programs explored performance measurement and indicators, including matters related to evaluation;
- The design of Indigenous streams of the new National School Food Program, which was led by First Nations, Inuit and Metis governments;
- Canada's Disability Inclusion Action Plan, including the implementation and evolution of the Accessible Canada Act and regulations under the Canada Disability Benefit; and
- Federal Labour protections, particularly the modernization of the Employment Equity Act and the implementation of the Pay Equity Act.
Enabling Fund for Official Language Minority Communities Program
Through the Enabling Fund for Official Language Minority Communities Program, we completed a call for proposals to fund official language minority community organizations to provide employment assistance services to their community members. We began negotiations with the aim of launching projects as soon as possible.
We also worked closely with provinces and territories to integrate these new services with provincial and territorial skills and employment programming.
Temporary Foreign Worker Program (TFW Program)
The Canadian labour market can be volatile, requiring us to quickly adjust policy to support employers and strengthen the Canadian economy. Last year, in response to rising unemployment rates and declining job vacancy rates in several sectors, we introduced measures to enhance program integrity while prioritizing the hiring of Canadian workers. These measures included:
- Refusing to process Labour Market Impact Assessment (LMIA) applications for low-wage positions where the workplace is located in a Census Metropolitan Area with an unemployment rate of 6% or more (exceptions in construction, healthcare and food manufacturing);
- Limiting low-wage temporary foreign workers to 10% of an employer's workforce at a specific location (exceptions in construction, healthcare and food manufacturing);
- Reducing the maximum duration for the period of employment for temporary foreign workers hired in low-wage positions from two years to one year; and
- Raising the threshold for what constitutes a high-wage job by 20%, thereby retaining labour market and worker protection measures imposed on low-wage LMIAs for a greater number of applications.
These measures have reduced TFW Program usage, prompting employers to hire more domestic workers. More specifically, we've seen a 50% reduction in LMIA applications received since these measures were introduced.
In early 2024, we continued supporting employers facing critical labour shortages under the TFW Program Workforce Solutions Road Map. However, as labour market conditions changed, these were replaced by a set of new measures aimed at decreasing employers' reliance on the TFW Program, particularly for positions that require entry-level skills and that offer on-the-job training.
To address sector specific challenges, we put in place exemptions from these new measures for key sectors facing labour shortages, including healthcare, food manufacturing, and construction. This allowed the TFW Program to continue to support Canadian employers, as well as Government of Canada priorities related to healthcare, food security, and housing.
The TFW Program remains committed to a continuous review of its policies to ensure they address labour shortages without displacing Canadian workers or negatively affecting working conditions.
Additionally, we continue to work with stakeholders to deliver on our commitment to develop a new Agriculture and Fish Processing Stream. In spring and summer 2024, we hosted 13 engagement sessions on the proposed new stream and sought feedback. Partners and stakeholders engaged included Seasonal Agricultural Worker Program (SAWP) participating nations, Provincial/Territorial Governments, Industry, and Migrant Worker Support Organizations
TFW Program Consultations
In 2024-2025, we sought stakeholders' input on six discussion papers related to the proposed new Agriculture and Fish Processing stream:
- Employer-Provided Accommodations
- Occupational Scope
- Stream-Specific Work Permits
- Transportation Requirements
- Wages and Deductions
- Healthcare Provisions
We received over 200 written submissions by the end of the fiscal year (and more afterwards). We are analyzing this feedback to inform how we develop and design the proposed new stream. Key themes from the feedback are also being considered in shaping future policy decisions, ensuring the process remains transparent and inclusive.
TFW Program Employer Compliance
We strengthened the employer compliance regime to support the health and safety of temporary foreign workers and held employers accountable for the treatment of temporary foreign workers in Canada:
- Focused inspections on high-risk areas;
- Finalized 1,435 inspections. Of the cases that rendered a compliance decision, 30.8% found employers to be compliant, 58.8% found employers to be compliant with justification, and the remaining 10.4% found employers non-compliant. This led to 36 bans, which prevent these employers from using the Program either temporarily or permanently, 18 employers receiving a warning, and a total of $4.88M in administrative monetary penalties being issued, more than double the penalties from the same period in 2023-2024 at $2.07M;
- Maintained the Service Canada confidential worker protection tip line, online reporting form, and Consulate Liaison Service to provide tools to the public to report potential situations of worker mistreatment and program misuse;
- Escalated any observed health and safety risks to temporary foreign workers to the appropriate authorities;
- Suspended the processing of Labour Market Impact Assessment (LMIA) applications when we had reason to suspect non-compliance. All LMIA decisions and compliance actions follow procedural fairness principles including written notice to employers, an opportunity to respond, and clear rationale for decision; and
- Provided information sessions to key stakeholders. This ensured greater awareness of employer obligations under the program and the rights of temporary foreign workers while they are in Canada.
TFW Program Applications
Over the past year, we continued to modernize our operations to quickly process more LMIA applications. In the 2024-2025 fiscal year, the Program received 135,006 LMIA applications, a 12.5% decrease compared to 2023-2024. To strengthen program integrity, we expanded the use of enhanced assessments for higher-risk employers and sectors, and stopped accepting attestations from accountants and lawyers as proof of business legitimacy. Despite the increased rigor in assessments, the Program processed a total of 137,158 LMIAs, which was 0.2% more than in the previous fiscal year.
Throughout this period, we maintained service levels for the Program's priority streams, including Global Talent, Primary Agriculture, and the Seasonal Agricultural Worker Program.
To support communications with employers, we continued to publish monthly average processing times and improved our public web content to provide clearer information on factors influencing service delivery.
Canadians receive financial support during employment transitions such as job loss, illness, or maternity/parental leave
Results achieved
On June 20, 2024, legislative amendments introducing a new, 15-week shareable EI adoption benefit received royal assent. Implementation efforts are underway, including regulatory updates to the Employment Insurance Act and the Canada Labour Code.
The department also advanced its broader EI modernization efforts, aiming to build a simpler, more responsive, and financially sustainable program. This work is informed by consultations with employer and labour groups, ongoing engagement, and research such as the EI Monitoring and Assessment Report.
In response to emerging challenges in 2024-2025, temporary EI and Work-Sharing measures were introduced to support workers and employers affected by:
- Wildfires in Jasper, Alberta, and Bunibonibee Cree Nation, Manitoba; and
- Foreign tariffs impacting Canadian businesses and workers.
The temporary one-year Employment Insurance (EI) measure offering up to four additional weeks of regular benefits to eligible seasonal workers in 13 EI regions ended as scheduled on September 7, 2024. However, workers who established claims before that date remain eligible for the extended support until their claims conclude.
A separate temporary measure-providing up to five additional weeks of regular benefits for seasonal workers in the same regions-was extended through Budget 2024 and will remain in place until October 24, 2026.
Resources required to achieve results
Table 3.7 provides a summary of the planned and actual spending and full-time equivalents required to achieve results.
| Resource | Planned | Actual |
|---|---|---|
| Gross spending | $33,754,261,064 | $34,552,944,563 |
| Net spending | $7,230,578,580 | $7,905,833,330 |
| Full-time equivalents | 15,054 | 16,457 |
Please refer to ESDC's Financial Framework for a complete description of the departmental financial profile, including an explanation of gross planned spending.
The Finances section of the Infographic for Employment and Social Development Canada on GC Infobase and the People section of the Infographic for Employment and Social Development Canada on GC Infobase provide complete financial and human resources information related to its program inventory.
Related government priorities
This section highlights government priorities that are being addressed through this core responsibility.
Gender-based Analysis Plus
We reviewed several sources of data (including from the Canada Student Financial Assistance (CSFA) Program and the Census of Population) to better understand the representation of various student groups, such as those who are:
- Indigenous;
- Members of Black and other racialized communities; and
- Immigrants within post-secondary education and the CSFA Program.
This analysis helped us assess how student financial assistance impacts different populations, which informed policy and addressed potential gaps in the program.
In 2024-2025, we worked with Immigration, Refugees and Citizenship Canada (IRCC) to update our Information Sharing Agreement (ISA) between the departments. The updated ISA is set to be signed in fall 2025, with data sharing to begin shortly after. A key improvement in the ISA is the inclusion of gender-specific data from IRCC's work permit records. This, along with existing social indicators such as age and nationality, will allow the TFW Program will strengthen its policy analysis, research, and evaluation-ensuring continued responsiveness to Canada's increasingly diverse labour market.
United Nations 2030 Agenda for Sustainable Development and the Sustainable Development Goals
Quality Education (SDG 4) - In 2024-2025, we did 21 mail-outs, distributing over 805,000 letters to connect with primary caregivers of children and youth eligible for the Canada Learning Bond (CLB).
We collaborated with the Canada Revenue Agency (CRA) to include CLB inserts in mailings to 1.06M households providing Notices of Entitlement for the Canada Child Benefit. We also conducted user-testing on the format and content of these letters. This aimed to enhance accessibility and readability in advance of measures announced in Budget 2024 to automatically enroll CLB eligible children.
Outreach events were held with local organizations and involving the CRA. These events provided information about education savings benefits and other government supports and resources for low-income Canadians.
As part of the Canada Student Financial Assistance (CSFA) Program, we provided non-repayable grants and interest-free loans to help students pay for their post-secondary education. Detailed reports and statistics for the 2024-2025 academic year will be made available in Summer 2026.
The Supports for Student Learning Program (SSLP) provided learning supports and opportunities to a total of 153,881 learners, focussed on equity-denied learners:
- 29,896 Indigenous learners (3,545 Métis learners; 15,349 First Nations learners; 4,354 Inuit learners and 3,046 Unaffiliated/Urban Indigenous learners);
- 6,389 Black and Racialized learners;
- 11,829 learners with a disability;
- 27,404 learners from low-income households;
- 4,269 2SLGBTQ+ learners;
- 1,775 learners experiencing/at risk of homelessness;
- 294 learners in/aging out of care;
- 2,660 newcomer learners;
- 21,413 learners from rural, remote, and Northern communities;
- 504 youth not in employment, education or training (NEET); and
- 4,469 youth that are the first to attend post-secondary education.
Achieve gender equality and empower all women and girls (SDG 5) - We will continue to provide Employment Insurance maternity, parental and caregiving benefits to support women in their recovery from pregnancy and childbirth. We will also continue to encourage increased gender parity within caregiving roles. This includes caring for children or caring for family members (adults and children) who are critically ill or injured, have a significant risk of death within the next 26 weeks, or require end-of-life care.
The most recent data indicates 173,200 new maternity claims were established in 2023-2024. Women made over two-thirds of parental benefit claims (69.5% or 169,465), while the share of claims made by men continued to increase, reaching 30.5% (74,540).
In fiscal year 2023-2024, which is the most recent results data available, there were:
- 6,417 claims made for the compassionate care benefit.
- 14,135 claims made for the family caregiver benefits for adults.
- 4,422 claims made for the family caregiver benefits for children.
Women represented 68.7%, 64.8% and 72.8% of these claims, respectively, while men represented 31.3%, 35.2% and 27.2%. Compared to the previous fiscal year, claims by men increased by:
- 0.7 percentage point (p.p.) for compassionate care benefits.
- 1.1 p.p. family caregiver benefits for adults.
- 2.5 p.p. family caregiver benefit for children, respectively.
The Canadian Apprenticeship Strategy's Women in the Skilled Trades Initiative funds projects to recruit, retain, and help women apprentices succeed in 39 eligible Red Seal trades found predominantly in the construction and manufacturing sectors.
In 2024-25, 21 projects operated through the Canadian Apprenticeship Strategy's Women in the Skilled Trades Initiative enabled 5,128 women to access training and supports (valued at $41.6M over four years). Projects support key priorities such as reconciliation and increasing the participation of equity-denied groups in the skilled trades, including women (for example, Flat Bay Band Inc.'s project titled K'Taqmkuk: Women In Trades Initiative).
Decent work and economic growth (SDG 8) - The Apprenticeship Service, a component of the Canadian Apprenticeship Strategy, helps apprentices get the hands-on experience they need for a career in the skilled trades. Under the Apprenticeship Service, small and medium-sized employers can get a financial incentive for each first-year apprentice hired in 1 of 39 eligible Red Seals trades found predominately in the construction and manufacturing sectors. They can get an additional incentive when the apprentice hired is from an equity-denied group (specifically, women, persons with disabilities, Indigenous peoples, and members of 2SLGBTQI+ communities, racialized communities, and newcomers). In addition, the Apprenticeship Service provides other supports to employers that will make it easier for them to hire first-year apprentices, such as help on navigating the apprenticeship system and welcoming workplace training.
The initiative contributes to Goal 8 of the FSDS by encouraging small and medium-sized employers to hire first-year apprentices in Red Seal trades.
Although the Apprenticeship Service program ended in March 2024, final results were unavailable for the 2023-24 DRR and are reported here: 8,261 employers accessed supports to hire 10,338 apprentices. Out of those employers, 5,265 accessed supports to hire 5,812 apprentices from equity-denied groups.
For the Sustainable Jobs Stream, results are not yet available since project activities are expected to start in summer 2025 with results by summer 2026. Delays in finalizing the program design and implementation details impacted the launch of the Union Training and Innovation Program Sustainable Jobs Stream to June 2024.
The Temporary Foreign Worker Program has significantly expanded its efforts to protect temporary foreign workers and address potential program misuse. Key changes include:
- Stricter oversight in high-risk areas when processing Labor Market Impact Assessments (LMIAs);
- Focused inspections on high-risk areas;
- Increased penalties for employers who refuse to meet with inspectors and who do not attend inspections, and for employers who are not actively engaged in their business operations;
- Removed the option for employers to use attestations from accountants or lawyers to prove their business legitimacy, instead requiring more direct forms of proof to show that job offers are genuine; and
- Increased the use of ministerial instructions to suspend positive LMIAs in cases of suspected program misuse, preventing employers from hiring additional temporary foreign workers.
The Program has also implemented key wage measures:
- Starting January 1, 2024, employers of temporary foreign workers must annually review wages to ensure they meet prevailing wage rates for their occupation and region throughout the temporary foreign workers' period of employment. This will prevent wage suppression for Canadian workers.
- Starting November 8, 2024, the wage threshold for categorizing Low-Wage and High-Wage Streams in the TFW Program was increased by 20%. This means that a greater number of jobs are subject to the stricter rules applicable to low-wage positions, including additional employer requirements related to housing, transportation, and recruitment of workers already in Canada.
Reduced inequalities (SDG 10) - Through our Labour Market Agreements, we helped Canadians get the skills and support they need to find jobs and reduce employment gaps.
In particular, our Workforce Development Agreements (WDAs) provided support to individuals who face more barriers to employment, including persons with disabilities, Indigenous Peoples, and recent immigrants. These agreements are Canada's largest investment in the labour market for persons with disabilities.
The most recent data from 2023-2024 reported that together, the WDAs and Labour Market Development Agreements provided training and employment services to:
- Over 48,000 Indigenous Peoples;
- 221,000 persons with disabilities; and
- Nearly 200,000 newcomers to Canada.
In 2024-2025, the Youth Employment and Skills Strategy supported over 82,465 youth (aged 15 to 30 years). This included 9,686 youth supported through ESDC's Youth Employment and Skills Strategy Program (YESSP), and 72,779 through Canada Summer Jobs.
The Youth Employment and Skills Strategy Program (YESSP) focuses on helping youth who face barriers to finding work, including those with disabilities, Indigenous youth, racialized youth, and youth not in school or working.
For example, about 20% of participants were Indigenous youth, 47% were racialized youth, and 17% were youth with disabilities.
More information on Employment and Social Development Canada's contributions to Canada's Federal Implementation Plan on the 2030 Agenda and the Federal Sustainable Development Strategy can be found in our Departmental Sustainable Development Strategy.
Program inventory
Learning, skills development and employment is supported by the following programs:
- Canada Apprenticeship Strategy
- Canada Education Savings Program
- Canada Emergency Response Benefit
- Canada Recovery Benefits
- Canada Service Corps
- Canada Student Financial Assistance Program and Canada Apprentice Loans
- Canada Worker Lockdown Benefit
- Community Workforce Development Program
- Employment Insurance
- Enabling Fund for Official Language Minority Communities
- Foreign Credential Recognition Program
- Future Skills
- Indigenous Skills and Employment Training (ISET) Program
- Job Bank
- Labour Market Development Agreements
- Opportunities Fund for Persons with Disabilities
- Sectoral Workforce Solutions Program
- Skilled Trades and Apprenticeship (Red Seal Program)
- Skills and Partnership Fund
- Skills for Success
- Student Work Placement Program
- Supports for Student Learning
- Temporary Foreign Worker Program
- Workforce Development Agreements
- Youth Employment and Skills Strategy
Additional information related to the program inventory for Social development is available on the Results page on GC InfoBase.
Core responsibility 4: Working conditions and workplace relationsCore responsibility 4: Working conditions and workplace relations
In this section:
- Description
- Quality of life impacts
- Progress on results
- Details on results
- Resources required to achieve results
- Related government priorities
- Program inventory
Description
Promotes safe, healthy, fair and inclusive work conditions and cooperative workplace relations.
Quality of life impacts
Programs under this core responsibility contribute to several Quality of Life domains and indicators, including:
- Domain - Health (Indicator - Functional health status), through programs aimed at ensuring safe and healthy work conditions
- Domain - Good Governance (Indicators - Canada's place in the world, Cyberbullying, Resolution of serious legal problems, Access to fair and equal justice, Elimination of Discrimination and unfair treatment, and Representation in senior leadership positions), through programs promoting fair and equitable treatment of workers, supporting labour standards enforcement, addressing discrimination and harassment in the workplace, and ensuring fair work standards in other areas of the world
- Domain - Prosperity (Indicator - Protection from income shock), through programs designed to safeguard workers in cases of workplace injuries or when affected by workplace bankruptcy, protecting them from sudden income loss
Progress on results
This section details the department's performance against its targets for each departmental result under Core responsibility 4: Working conditions and workplace relations.
| Departmental Result Indicator | Target | Date to achieve target | Actual Result |
|---|---|---|---|
| Number of health and safety violations identified under the Canada Labour Code (Part II) per 1,000 federally regulated employees | At most 9 | March 2025 | 2022-23: 10.4 2023-24: 9.2 2024-25: 7.7 |
| Departmental Result Indicator | Target | Date to achieve target | Actual Results |
|---|---|---|---|
| Percentage of Legislated Employment Equity Program employers whose representation equals or surpasses Canadian labour market availability for 2+ designated groups or who demonstrated progress towards representation since the previous reporting period | At least 65% | September 2024 | 2022-23: 78% 2023-24: 77% 2024-25: 81% |
| Three-year average number of founded violations identified under Part III of the Canada Labour Code per 1,000 federally regulated employees | At most 3 | March 2025 | 2022-23: 2.2 (2020-23)1 2023-24: 1.8 (2021-24)1 2024-25: 1.5 |
| Departmental Result Indicator | Target | Date to achieve target | Actual Results |
|---|---|---|---|
| Percentage of labour disputes settled under the Canada Labour Code (Part 1) without work stoppages, where parties were assisted by Labour Program officers | At least 95% | March 2025 | 2022-23: 96% 2023-24: 96% 2024-25: 97% |
| Departmental Result Indicator | Target | Date to achieve target | Actual Results |
|---|---|---|---|
| Number of targets that are being met for the published service standards of Working Conditions and Workplace Relations programs | 4 out of 4 | March 2025 | 2022-23: 2 out of 4 2023-24: 2 out of 4 2024-25: 3 out of 43 |
| Percentage of occupational health and safety cases each fiscal year that are finalized within 120 days (excluding prosecutions, appeals, and technical surveys) | At least 80% | March 2025 | 2022-23: 72% 2023-24: 74% 2024-25: 83% |
| Percentage of unjust dismissal complaints that are finalized within 180 days | At least 75% | March 2025 | 2022-23: 65%3 2023-24: 50%3 2024-25: 45%3 |
| Percentage of conciliators assigned under the Canada Labour Code within 15 calendar days of receiving requests that are compliant with Canada Industrial Relations Regulations | 100% | March 2025 | 2022-23: 100% 2023-24: 100% 2024-25: 100% |
| Percentage of initial Wage Earner Protection Program payments and non-payment notifications issued within 35 calendar days | At least 80% | March 2025 | 2022-23: 99% 2023-24: 86.6% 2024-25: 89.9% |
- Notes:
- Two data sources were used to compile these results: Labour Application 2000 for data collected prior to June 2022, and the Integrated Labour System for data from June 2022 onward.
- Service standards are published on Transparency - Canada.ca.
- This service standard has been challenging to meet due to a combination of factors. Legislative and regulatory changes have increased both the volume and complexity of complaints, while operational capacity has remained relatively stable due to limited or no new funding to support these initiatives. As a result, many files are not assigned to an officer until well after the 180-day mark-often more than a year after intake-making it impossible to meet the target despite best efforts.
The Results section of the Infographic for Employment and Social Development Canada on GC Infobase page provides additional information on results and performance related to its program inventory.
Details on results
The following section describes the results for Working conditions and workplace relations in 2024-25 compared with the planned results set out in Employment and Social Development Canada's departmental plan for the year.
Workplaces are safe and healthy
Results achieved
We made two notable changes to the Occupational Health and Safety Regulations that will improve outcomes for workers and address changes in the society:
- Regulatory work continues to address the thermal stress and other hazardous substances in the workplace. We are considering input from employers and employees before finalizing the regulations. These amendments will lower the level of radon exposure and will clarify protections against thermal stress; and
- We successfully updated provisions to the sanitation regulations under Part II of the Canada Labour Code (the Code) to recognize all-gender toilets, and modernize language to be gender-inclusive. The update to the regulations came into force on December 1, 2024, and now use terms such as "gender" instead of "sex" and neutral pronouns. They also allow employers to count toilets that are not gender or sex specific in their total toilet count. This eliminated the disincentive for employers to provide all-gender toilet rooms by ensuring that those toilets are counted towards the total number of toilets required in the workplace.
We continued to engage with federal, provincial, and territorial occupational health and safety partners to address shared priorities. Highlights of recent meetings and data sharing initiatives include:
- The Canadian Association of Administrators of Labour Legislation - Occupational Safety and Health (CAALL-OSH) focused on harmonizing OSH standards to support labour mobility across jurisdictions;
- The Canadian Association of Administrators of Labour Legislation - Labour Standards (CAALL-LS) convened to discuss employment conditions and related labour standards;
- Federal-Provincial-Territorial Ministers Responsible for Labour explored concrete actions to raise awareness and improve the effectiveness of personal protective equipment (PPE);
- A multi-stakeholder group-including manufacturers, construction firms, labour representatives, and researchers-examined issues such as the lack of awareness around ill-fitting PPE and the limited availability of body-diverse sizing; and
- Finalized long term information sharing agreement with provincial OHS partner: WorkSafe BC. This established a framework for assessing and resolving federal and provincial OHS issues of mutual interest, enabling both parties to carry out their responsibilities in a coordinated manner.
Work conditions are fair and inclusive
Results achieved
Legislative and Regulatory Advancements
Gig Worker Protections: On June 20, 2024, amendments to the Code came into force to enhance job protections for federally regulated gig workers. These changes establish a presumption of employee status unless proven otherwise, reinforce the prohibition on misclassification under Part III (Labour Standards), and extend similar provisions to Part I (Industrial Relations) and Part II (Occupational Health and Safety).
Misclassification Enforcement: We took action against employers in the road transportation industry who are misclassifying employees by strengthening the rules on misclassification in the Code. New rights regarding misclassification were also introduced to sections of the Code on labour relations and occupational health and safety. Nearly 790 outreach and inspection activities were conducted, resulting in over 500 payment orders totaling nearly $3.4 million in unpaid wages in the road transportation sector.
Pregnancy Loss Leave: In 2024, legislation amending the Code to provide enhanced leave for employees in the federally regulated private sector experiencing pregnancy loss received Royal Assent. Starting December 12, 2025, affected employees will be entitled to three days of leave, or up to eight weeks in the case of a stillbirth. The first three days will be paid for those with at least three months of continuous employment.
Pay Equity: To strengthen enforcement of the Pay Equity Act and Regulations, new amendments came into force, enhancing the Pay Equity Commissioner's ability to address non-compliance. These changes authorize the use of administrative monetary penalties to promote compliance in a non-punitive way. The Government also consulted a wide range of stakeholders-including equity groups, unions, and employers-on implementing the Pay Equity Task Force recommendations and modernizing the Employment Equity Act.
Policy and Engagement
Federal Contractors Program: Following extensive policy research aimed at improving the Federal Contractors Program, we concluded that requiring federal contractors to pay employees the federal minimum wage is not feasible without involving significant trade agreement and constitutional legal risks.
Government Employees Compensation Act
In 2024-2025, we worked to address key service delivery challenges in the administration of federal workers' compensation. A report called "Roadmap to the Future of the Federal Workers' Compensation System" was submitted in June 2024, along with an action plan with a view to modernize the federal workers' compensation regime. Measures were identified for a more efficient processing of work-related injury or illness claims made under the Government Employees Compensation Act.
International Labour Engagement: Canada participated in the June 2024 International Labour Conference, contributing to:
- The development of a new international labour standard on biological hazards in the working environment;
- Overseeing the implementation of international standards in other countries; and
- The consultation with provinces, territories and representatives of workers and employers in preparation for a first discussion on a potential international labour standard on decent work in the platform economy.
International Collaboration and Development
We submitted annual reports to the International Labour Organization (ILO) regarding its compliance with conventions that Canada has ratified, in close collaboration with provinces and territories. This year, focus of the reporting was on implementation of conventions related to forced labour, child labour, minimum age and employment policy.
As part of Canada's Indo-Pacific Strategy, we funded six projects in Southeast Asia to strengthen compliance with fundamental labour rights among workers, employers, and governments. Four of these are new initiatives launched in the Asia-Pacific region, complementing existing ILO projects in Indonesia, Cambodia, Thailand, and Lao People's Democratic Republic. Focused on ASEAN member countries, these projects aim to protect labour and human rights in export sectors and help level the playing field for Canadian workers and employers in a growing global trade environment.
Labour relations are cooperative
Results achieved
In an effort to reduce cases of employers using replacement workers during a strike or lockout, we contributed to Bill C-58, An Act to amend the Canada Labour Code and the Canada Industrial Relations Board Regulations, 2012. The amendment improves the maintenance of activities process and bans the use of replacement workers in federally regulated workplaces during a strike or lockout.
Lastly, we continued to deliver the Wage Earner Protection Program (WEPP) to provide financial support to workers for wages owed to them when their employer files for bankruptcy, enters receivership, or in other qualifying circumstances. WEPP provided payments to over 12,500 recipients for a total payment of $70.11 Million. The Program continued to collaborate with internal and external stakeholders to ensure that eligible workers received their WEPP payments and to enhance the program's overall efficiency.
Resources required to achieve results
Table 4.5 provides a summary of the planned and actual spending and full-time equivalents required to achieve results.
| Resource | Planned | Actual |
|---|---|---|
| Gross spending | $198,483,987 | $206,974,970 |
| Net spending | $197,583,987 | $205,888,660 |
| Full-time equivalents | 856 | 822 |
Please refer to ESDC's Financial Framework for a complete description of the departmental financial profile, including an explanation of gross planned spending.
The Finances section of the Infographic for Employment and Social Development Canada on GC Infobase and the People section of the Infographic for Employment and Social Development Canada on GC Infobase provide complete financial and human resources information related to its program inventory.
Related government priorities
This section highlights government priorities that are being addressed through this core responsibility.
Gender-based Analysis Plus
The Regulations Amending Certain Regulations Made Under the Canada Labour Code (Sanitation) came into force on December 1, 2024. The regulations now use terms such as gender instead of sex and neutral pronouns. They also allow employers to count toilets that are not gender or sex specific in their total toilet count. This will eliminate the disincentive for employers to provide all-gender toilet rooms by ensuring that the toilets in those are counted towards the total number of toilets required in the workplace.
The Workplace Equity program continued to collect the annual employment equity data of federally regulated private-sector employers. In 2024, the data collected under the Employment Equity Act included information on different groups based on gender, such as Indigenous men and women, men and women with disabilities, and visible minority men and women. This data highlights differences in representation, pay, and job types, helping employers understand the challenges these groups face in achieving equitable employment. Employers can use this information to take steps to remove these barriers, as required by the Act. The data is also available to the public on the Equivision website enabling employees to advocate for specific actions from their employers.
United Nations 2030 Agenda for Sustainable Development and the Sustainable Development Goals
Promote inclusive and sustainable economic growth, employment and decent work for all (SDG 8) -Our dedicated team on employee misclassification ensures safe and fair workplaces for those in the road transportation industry where federal labour standards are in place. This industry provides employment to migrants and newcomers to Canada who might not be aware of their rights under Canadian labour laws and standards. More specifically, we balanced compliance and enforcement measures with educating and counselling employers on the misclassification of employees. For cases of continued non-compliance by employers, fines were issued, with some resulting in publishing employer names on the Government of Canada's website.
We continued to provide policy and technical expertise to other departments and engage with stakeholders on labour exploitation issues. Through the Labour Program, we worked closely with Global Affairs Canada (GAC), the Canada Border Services Agency (CBSA), and other departments to address forced labour and other forms of exploitation in global supply chains. This included continued federal activities to operationalise the import ban on goods made using forced labour. We also maintained engagement with the ILO, the G7, the CUSMA Labour Council, and international labour officials from other countries.
Canada remained committed to supporting Mexico in fulfilling its labour obligations under the Canada-United States-Mexico Agreement (CUSMA). To this end, Canada funded six labour-related projects in Mexico to support Mexico's labour reform and ensure compliance with its CUSMA's labour commitments. A key focus of these initiatives is the promotion of freedom of association, collective bargaining, and respect for fundamental labour rights. By fostering fair labour practices, these projects help create a level playing field for Canadian workers and businesses, benefiting both Mexico and Canada.
More information on Employment and Social Development Canada's contributions to Canada's Federal Implementation Plan on the 2030 Agenda and the Federal Sustainable Development Strategy can be found in our Departmental Sustainable Development Strategy.
Program inventory
Working conditions and workplace relations is supported by the following programs:
- Federal Workers' Compensation
- International Labour Affairs
- Labour Relations
- Labour Standards
- Occupational Health and Safety
- Wage Earner Protection Program
- Workplace Equity
Additional information related to the program inventory for Social development is available on the Results page on GC InfoBase.
Core responsibility 5: Information delivery and services for other government departments
In this section:
- Description
- Quality of life impacts
- Progress on results
- Details on results
- Resources required to achieve results
- Related government priorities
- Program inventory
Description
Provide information to the public on the programs of the Government of Canada and the department and provide services on behalf of other government departments.
Quality of life impacts
Programs under this core responsibility contribute to several Quality of Life domains and indicators including:
- Domain - Good Governance (Indicators - Confidence in institutions, Misinformation/trust in media) through activities that provide information to the public on services offered by various levels of government
- Domain - Society (Indicators - Indigenous languages, Knowledge of official languages) through programs that involve collaborating with Indigenous organizations, as well as provinces and territories, to deliver services and information to the public in the official language of their choice
Progress on results
This section details the department's performance against its targets for each departmental result under Core responsibility 5: Information delivery and services for other government departments.
| Departmental Result Indicator | Target | Date to achieve target | Actual Result |
|---|---|---|---|
| 1 800 O-Canada information completeness, relevancy and accuracy assessment | At least 85% | March 2025 | 2022-23: 86% 2023-24: 86% 2024-25: 85% |
| Percentage of clients served in person who received assistance within 25 minutes | At least 80% | March 2025 | 2022-23: 78%2 2023-24: 70%2 2024-25: 75%2 |
| Number of program services that meet their service standard targets | 4 out of 43 | March 2025 | 2022-23: 3 of 5 2023-24: 4 out of 54 2024-25: 2 out of 45 |
| Departmental Result Indicator | Target | Date to achieve target | Actual Results |
|---|---|---|---|
| Percentage of travel documents and other passport services processed within standards | At least 90% | March 2025 | 2022-23: 70%5 2023-24: 92% 2024-25: 78%6 |
- Notes:
- Service standards are published on Transparency - Canada.ca.
- The In-Person network experienced an increase in client volumes and an increase in volume in common service request types, such as Passport Services, Employment Insurance, and Old Age Security. This growth reflects the heightened demand for services, particularly in urban centres. Despite these challenges, the In-Person network has improved transaction times and has seen notable improvement from the previous fiscal year's results.
- In past years there were 5 service standards for this target. Two of the Passport Service standards have been combined and there are now only 4.
- The last quarter of fiscal year 2023-24 saw an increase in Passport application volumes beyond what was forecasted. As a result, the service standards for this service channel were slightly impacted and only two of the three service standards related to passport were met.
- Only 20% of the normally anticipated passport volume was received during the first 2 years of the pandemic. This means that 3 million fewer Canadians renewed or applied for a passport during the pandemic. However, as travel restrictions and health and safety measures eased, applications received by mail nearly doubled. In addition, a significant segment of all applications received were for new passports, which take longer to process than renewals. This high application volume led to a build-up of inventory that exceeded the capacity to process applications within service standards.
- As a result of higher than forecasted intake volumes, and more frequent system and network outages at the end of fiscal year 2023-24, fiscal year 2024-25 started with a very high and aged inventory level. These conditions carried into the first half of the fiscal year, with intake remaining above forecast by about 11%. Although weekly service standards rebounded later in the year, Service Canada was unable to fully return to annual service levels before the end of the fiscal year.
The Results section of the Infographic for Employment and Social Development Canada on GC Infobase page provides additional information on results and performance related to its program inventory.
Details on results
The following section describes the results for Information delivery and services for other government departments in 2024-25 compared with the planned results set out in Employment and Social Development Canada's departmental plan for the year.
Clients receive high quality, timely and accurate government information and services that meet their needs
Results achieved
Removing language barriers
We continued to make progress on the department's 3-year Accessibility Plan to remove barriers for clients. We offered the following services to support clients facing language barriers:
- Expanded Video Remote Interpretation (VRI) to the Community Outreach and Liaison Services (COLS) network, by deploying 70 tablets to provide this service to clients;
- Specialized assistance through the Telephone Interpretation Services (TIS) and TTY;
- Introduced dedicated Toll-Free Numbers for Video Relay Service (VRS) providers to reach the call centre, offering a prioritized service for clients with speech and hearing impairments; and the In-person network continued to provide Multilingual Services (MLS) in Indigenous languages in certain locations to improve access to programs and services; and
- Provided counter loop devices at service counters to help people with hearing impairments.
We also completed the language designation review of all Service Canada offices so that we can meet the evolving needs of the Official Language Minority Communities across Canada. As a result, 62 points of service were identified to be designated bilingual in the coming year(s), and we began preparations to provide equal service in both official languages at these offices.
Reaching Canadians online and in person
Last year, we continued to offer high-quality services to Canadians through our in-person network of 600 service points. With 97% of the population living within 50 km of a Service Canada Centre, over 9.2 million clients were served in person. A list of Government of Canada services is published on Canada.ca/services.
Online requests through eServiceCanada are answered within two business days, with 404,000 completed last year.
We also expanded our Community Outreach and Liaison Service (COLS), to better reach people who face barriers to accessing services and benefits (e.g. geographical, cultural or other) by meeting them where they live or spend time.
Last year, we reached 21,900 community organizations that supported vulnerable populations, including 737 organizations in Indigenous communities. Additional outreach included:
- 5,402 clinics where individuals received direct assistance applying for programs and benefits;
- 5,534 information sessions with clients and community organizations; and
- 20,512 calls received through the Outreach Support Centre, of which 2,943 were from 382 indigenous communities.
To increase awareness of its outreach services, Service Canada expanded its COLS page on Canada.ca by launching the Find a Service Canada Outreach Activity Near You page, enabling clients to locate outreach events that may be closer to home.
Open-source tools for Government of Canada
We made it easier and less expensive for departments to deliver improved and more consistent services to Canadians. By using open-source tools and collaboration, the Canadian Digital Service (CDS) provided public servants with tools needed to improve their services, including GC Notify and GC Forms.
GC Notify was significantly improved to help departments more easily create and manage messaging services, enhance service delivery, and send more reliable notifications to Canadians about government processes. Highlights include:
- New features added to improve support in Indigenous languages and languages that read right to left, create custom email logos and improve accessibility;
- Departments report time savings by avoiding procurement processes and using reusable, Government of Canada-compliant templates; and
- Notification volume increased by 28%, with a total of 72 million emails and texts sent in 2024-2025.
With respect to GC Forms, this procurement-free, simple and user-friendly online form builder and publisher tool is provided at no cost for Government of Canada departments and agencies. It supported both applications, submissions and other service transactions from members of the public and public servants. Last year, the tool processed over 440,000 submissions. This was a 500% year over year increase.
And lastly, we launched the Service and Digital Toolkit which offers practical guidance to teams in the Government of Canada based on real experiences from our Canadian Digital Service (CDS) and our Government of Canada partners.
Telephone general enquiries program
1 800 O-Canada continued to provide trusted, secure, reliable and convenient information on all Government of Canada programs and services. Agents responded to 1,858,726 calls last year. Of these:
- 81% were answered within 18 seconds;
- We obtained a rating of 85% for completeness, relevancy and accuracy of information; and
- It served as a convenient resource for Canadians to find modified service options during the Postal service disruption in the fall 2024.
Through our Customized Information Services (CIS) we continued to help partners communicate with Canadians through agile and easy to implement call centre solutions. In fact, we responded to 518,337 calls and 52,943 emails on behalf of departments across the Government of Canada.
As part of the Reaching all Canadians initiative, a pilot project on 1 800 O-Canada tested international and Indigenous language interpretation services. Through this pilot, we learned that there is a daily demand for interpretation service for many languages, with Spanish, Punjabi and Arabic being the top three. Over the course of a year, this would result in an average of more than 1,700 requests. As a result, this service will continue to be offered moving forward.
Government of Canada digital presence
As the Government of Canada's digital presence, Canada.ca supported over 80 departments and agencies to deliver up-to-date digital content to the public. Last year:
- Canada.ca connected visitors to government information and services over 855 million times;
- Over 660,000 pages were managed via the Canada.ca platform, and support was provided to publishers across the Government of Canada;
- Over 456,300 posts were published to official social media accounts through the Government of Canada Social Media Management Service; and
- Over 6,400 news products (news releases, media advisories, speeches, statements) were published via the Government of Canada digital newsroom.
At the same time, new services were developed to optimize client experience and provided tailored service information.
Service Canada's Community Outreach and Liaison Service launched the "Find a Service Canada Outreach Activity Near You" page. This new page enables clients and organizations to locate outreach events in their area, for informational and transactional services. This option provides clients with faster service and reduces wait times at Service Canada Centres. Since the January 2025 launch, over 86 events have been posted.
Canadians can obtain a passport within Canada in a timely manner
Results achieved
In collaboration with IRCC, we completed the Passport Program Modernization Initiative (PPMI) in August 2024. This initiative deployed a new intake and processing system to all passport offices, Service Canada Centres and Passport Production Centres. This initiative introduced technology that helps with automatic passport renewals as well as streamlined processes.
We deployed the ePassport Next Generation (ePNG) project so that Canadians can benefit from a secure passport design and improved overall security.
We opened a third Passport Production Centre in Western Canada and Territories Region to ensure business continuity and service delivery resilience. We also expanded 10-business day passport service to Iqaluit and Yellowknife, reinforcing vital presence of passport services in northern, rural and remote communities.
Service delivery partnerships program
Results achieved
We continued to work closely with federal, provincial, and territorial organizations through the Service Delivery Partnerships (SDP) Program. Last year, we:
- Managed 95 partnerships with 44 distinct partners;
- Developed 11 new partnerships; and
- Renewed 27 existing partnerships.
For detailed information on these partnerships, refer to the SDP disclosure page which lists partner organizations, partnership objectives, and agreement timelines.
On behalf of Health Canada, we led the design, build, and implementation of the Canadian Dental Care Plan (CDCP) service delivery model at Service Canada for application intake and eligibility verification. We focused on client experience from the outset and achieved record-high self-service rates, minimized friction, and empowered Canadians to access services independently. The model provides tools for accessing CDCP information, intaking applications, and processing eligibility for Canadians. Last year:
- Over 2.4 million CDCP applications were completed with approximately 77% of applicants deemed eligible;
- Approximately 85% of eligible clients completed their application through the self-serve online portal without assistance from an Officer or through the Interactive Voice Response (IVR); and
- For those who required assistance, the cumulative average call wait time was less than 40 seconds. We also met the service level of answering calls within ten minutes approximately 97% of the time.
Under the Canada-Ukraine Transitional Assistance initiative, we provided information and offered support to applicants. We distributed just under $794.8M to approximately 297,000 persons fleeing Ukraine.
Last year, we also continued to work with IRCC to offer in-Canada biometrics collection at select Service Canada Centres. We completed 386,117 biometric collections to support IRCC applications from both permanent and temporary residents.
Resources required to achieve results
Table 5.3 provides a summary of the planned and actual spending and full-time equivalents required to achieve results.
| Resource | Planned | Actual |
|---|---|---|
| Gross spending | $599,204,881 | $603,214,600 |
| Net spending | $599,204,881 | $603,214,600 |
| Full-time equivalents | 4,932 | 5,462 |
Please refer to ESDC's Financial Framework for a complete description of the departmental financial profile, including an explanation of gross planned spending.
The Finances section of the Infographic for Employment and Social Development Canada on GC Infobase and the People section of the Infographic for Employment and Social Development Canada on GC Infobase provide complete financial and human resources information related to its program inventory.
Related government priorities
This section highlights government priorities that are being addressed through this core responsibility.
Gender-based Analysis Plus
Through targeted outreach and support initiatives, such as the Service Referral Initiative and the Outreach Support Centre, we continued to remove barriers so all Canadians can easily access government services.
We focused on groups facing the greatest challenges, including Indigenous people, newcomers, persons with disabilities, seniors, and others at risk. This work included:
- Deploying 70 tablets to the Community Outreach and Liaison Service (COLS) network to provide Video Remote Interpretation (VRI) service to clients;
- Expanding 10-business day passport service to the Iqaluit and Yellowknife Service Canada Centres, improving access to passport services in northern communities; and
- Concerted efforts to ensure gender-equitable and fair access through Service Canada access strategies, which consider how different vulnerable communities obtain service through Service Canada delivery channels.
United Nations 2030 Agenda for Sustainable Development and the Sustainable Development Goals
End poverty in all its forms everywhere (SDG 1) - We partnered with community organizations to identify and refer hard-to-reach individuals to Service Canada representatives who could help them apply for benefits. Of the 837 organizations with access to Service Referral Initiative (SRI) support, 392 were on-boarded this past year. The Department aims to increase participation of community organizations in the Service Referral Initiative by 10% by the end of 2025.
More information on Employment and Social Development Canada's contributions to Canada's Federal Implementation Plan on the 2030 Agenda and the Federal Sustainable Development Strategy can be found in our Departmental Sustainable Development Strategy.
Program inventory
Information delivery and services for other government departments is supported by the following programs:
- Citizen Service Network
- Canadian Digital Service
- Government of Canada Internet Presence
- Government of Canada Telephone General Enquiries Services
- Passport
- Service Delivery Partnerships
Additional information related to the program inventory for Social development is available on the Results page on GC InfoBase.
Internal services
In this section:
- Description
- Progress on results
- Resources required to achieve results
- Contracts awarded to Indigenous business
Description
Internal services refer to the activities and resources that support a department in its work to meet its corporate obligations and deliver its programs. The 10 categories of internal services are:
- Management and Oversight Services
- Communications Services
- Legal Services
- Human Resources Management
- Financial Management
- Information Management
- Information Technology
- Real Property
- Materiel
- Acquisitions
Progress on results
This section presents details on how the department performed to achieve results and meet targets for internal services.
Human Resources Management Services
ESDC continues to advance equity, diversity, inclusion (EDI) and reconciliation through targeted staffing, employee engagement, and inclusive workplace initiatives. A more diverse workforce means our organization better reflects the needs of all Canadians, including those with disabilities, and strengthens our ability to serves all communities with fairness, respect, and cultural understanding.
Multiple departmental EDI-related Employee Networks hosted over 94 events last year, celebrating diversity, fostering cultural competency, allyship, and awareness across the organization. These networks informed the 2025-2029 Diversity and Inclusion Action Plan (DIAP) and helped develop responses to studies affecting Black and Indigenous employees.
Last year, as part of our Indigenous representation and reconciliation efforts, 219 of our 7,676 new hires self-identified as Indigenous. We also led Indigenous-specific staffing processes, supported mentorship programs and launched tailored initiatives, including an IT Apprenticeship Program, the Indigenous Policy Analyst Inventory, Indigenous Student Talent Matching. These efforts helped address systemic barriers and enhanced Indigenous representation.
We also advanced our commitment to EDI and promoted an inclusive workplace by:
- Adopting policy initiatives like gender markers and chosen names;
- Integrating inclusion goals into executive performance agreements;
- Implementing mandatory Indigenous awareness training;
- Promoting the external inventory for persons with disabilities in the National Capital Region which improved access to federal jobs and expands representation of persons with disabilities; and
- Prioritizing training for key communities, leading to a 32% increase in participation in learning programs that support the hiring, retention, and advancement of Black people, Indigenous Peoples, and persons with disabilities.
To strengthen bilingual capacity, especially in designated regions, the department provided official language (OL) training to approximately 2,550 employees-500 more than the previous year. This included those impacted by the Bill C-13, an Act to Amend the Official Languages. We also launched a Second Official Language Training Network in October 2024 to enhance access and coordination of second language training opportunities and initiatives.
Financial Management
We continued to build trust by making sure that funds were used wisely and aligned with the department's goals. We provided financial services for several complicated initiatives and programs, supporting key policies for Canadians such as:
- Calculating the cost estimates related to tariff impacts on Employment Insurance (EI); and
- Transitioning Old Age Security (OAS) onto the Benefits Delivery Modernization (BDM) platform.
We made significant progress in investment and project management throughout the department. Notably, we have improved how we manage projects by:
- Re-launching the Project Management Information System (PMIS) Next Generation project to meet the department's growing demands for projects;
- Improved the Project Management Competency Development (PMCD) program to give managers the necessary experience and skills to effectively manage complex projects;
- Developed new standard operating procedures, tools, and additional advisory services to better equip and guide project teams toward success; and
- Took advantage of our governance process for major, minor, and small projects to improve decision-making for over 130 committee appearances.
Information Management
We continued to improve client information by streamlining, digitizing and securing it through our Information Strategy. For example, we launched the Pension Trusted Digital Repository (PTDR), a secure system for managing pension files. This helps our agents to access client information faster and more efficiently.
Information Technology
We continued to upgrade our IT systems to make sure Canadians can access programs and services when they need them. For example, we launched Assist-Me, an easy-to-use AI chatbot that helps Old Age Security (OAS) clients get quicker answers and personalized support with applications, benefits and eligibility.
As part of modernizing the Passport Program, we introduced new tools to improve service. For example, Canadians can now track their passport application online using the GC Notify system.
We tested a new satellite connection at our Service Canada Centre in Campbell's Bay, Quebec. This is part of the Network Modernization Project, Low Earth Orbit (LEO) satellites can provide our Service Canada Centre offices in remote regions more reliable internet where wired services aren't available.
We improved the My Service Canada Account (MSCA) platform to make it easier and more secure for Canadians to access their benefits online:
- Launched a new step-by-step registration "wizard" to help Canadians registering for their MSCA; and
- Added a new dashboard that shows benefits and services in one place, making it easier for clients accessing our services to request support.
To strengthen cybersecurity, we continued to collaborate with key partners, including the Treasury Board Secretariat, Shared Services Canada, and Canadian Centre for Cyber Security. Some of this work included improving disaster recovery, training staff to handle cyber threats, protecting personal data, and developing an IT alert tool. These actions help us respond to risks quickly, keep services running smoothly, and reduce disruptions for Canadians.
We led the Government of Canada's IT Apprenticeship Program for Indigenous Peoples and used it to grow our workforce. In 2024-25, 47 apprentices were hired across departments, and 30 individuals completed their training. This initiative helped build a more inclusive and diverse digital workforce by supporting Indigenous talent.
We made progress in exploring Generative AI and Extended Reality to improve client services. Key actions included:
- Sharing resources with staff on AI Adoption Strategy, best practices, and prompt engineering;
- Establishing AI governance to guide responsible use of AI in the department; and
- Putting guardrails in place to prevent bias and mismanagement of information when using AI tools in the workplace.
We also advanced cloud adoption to improve data security, service efficiency, and access to programs for Canadians. We are working closely with Canadian Centre for Cyber Security, Treasury Board Secretariat, and Shared Services Canada to strengthen cloud security policies and centralize cloud services. This ensures staff have modern tools to help deliver faster, more reliable services to Canadians.
Real Property
Last year, the department supported 390 service delivery and internal operations locations across Canada. We completed real property projects to maintain in-person services to the public and continue workplace modernization.
We also contributed to the Government of Canada's Office Portfolio Reduction Plan, making progress on reducing our office footprint and avoid unnecessary rental costs.
Evaluation Services
We improved how we measure program impacts by using advanced methods like machine learning. This helped us better understand how different socio-economic groups are affected. These insights support evidence-based policy decisions and help build a more inclusive economy.
Last year, we supported policy decisions and program delivery by:
- Completing five planned evaluations with program teams;
- Starting 10 new evaluations and conducting three additional studies to inform the annual report; and
- Contributing to the 2023-2024 EI Monitoring and Assessment Report.
We also worked with Indigenous organizations and communities to finalize the evaluation of the Indigenous Skills and Employment Training Program. This collaborative approach respects the unique needs of First Nations, Inuit, Métis, and Urban/Non-affiliated Indigenous Peoples. It reflects our commitment to reconciliation and aligns with Canada's Action Plan on the UN Declaration on the Rights of Indigenous Peoples.
Research
In 2024-2025, we continued to foster innovation and make evidence-based decisions. Guided by our 2023-2025 Research Plan, we conducted over 200 research projects on topics like labour market trends, poverty, accessibility, and service delivery.
This research helped us better able to understand the challenges faced by Canadians-particularly those in vulnerable situations. In turn, we developed and improved policies and services to be more inclusive and responsive to Canadians' needs. For example, we:
- Analyzed data from the 2022 Canadian Survey on Disability to better understand the experiences of persons with disabilities;
- Researched poverty to support policy work aimed at the most vulnerable Canadians, including low-income families with children, and seniors;
- Studied global labour market conditions and skills gaps among students and recent immigrants to develop strategies for better labour market outcomes; and
- Conducted innovative research on service delivery that contributed to improving Canadians' access to programs.
Data Strategy
We continued to implement its enterprise-wide Data Strategy to promote innovative, effective, and responsible use of data and analytics. This work has deepened our understanding of Canadians' needs, enabled us to respond to socio-economic changes-such as the impact of AI on the job market-and supported data-driven analysis and decision-making to improve policy, programs and services.
To further strengthen data and AI capabilities, the department:
- Expanded the Data Foundations Platform, by loading more data and equipping staff with tools;
- Established secure analytics labs to enable reporting, AI, and machine learning in a safe environment;
- Implemented data-driven AI solutions and automation tools to boost productivity, reduce costs, and free up staff for more complex tasks;
- Provided data and AI learning resources to build departmental data and AI literacy;
- Established AI governance and an AI Register to ensure responsible and ethical AI use;
- Enhanced the Data Accountability Framework to clarify stewardship roles, and developed new templates and resources to help staff resolve data issues more efficiently;
- Analyzed employee demographics to identify systemic barriers and support equity initiatives, including the Call to Action on Anti-Racism, Equity, and Inclusion in the Federal Public Service;
- Strengthened collaboration with internal and external partners, including Statistics Canada, to improve client insights and policy impact; and
- Published over 1 million new records on the Government of Canada Open Government Portal.
Access to Information
The department continued to uphold the principles of openness and transparency as outlined in the Access to Information Act and Privacy Act. Efforts focused on improving how information requests are processed and how information is proactively shared with Canadians.
We tested and customized new technology to streamline the processing of access to information requests, alongside the development of new service standards to improve response times. We modernized tools, policies, and procedures to enhance the client experience, and identified service methods that could boost responsiveness.
Notably, the department improved its compliance with legislative deadlines:
- Access to Information Act: compliance increased from 88% to 90.2%.
- Privacy Act: compliance rose from 73.5% to 82.8%.
In addition, the department proactively disclosed high-demand information, such as policies related to the Temporary Foreign Worker Program, and ensured that all disclosures met legislative timeframes and accessibility standards.
To build long-term capacity, comprehensive training was provided to staff responsible for processing requests, reinforcing the department's commitment to open and transparent government.
Privacy
The department continued to uphold the privacy rights of Canadians by embedding privacy considerations into every stage of program and service development. A "privacy by design" approach was implemented across major initiatives, including the Benefits Delivery Modernization Program and the Canadian Dental Care Plan, both of which underwent rigorous and ongoing compliance and risk assessments.
To further support responsible data use, the department aligned its efforts with the Data Strategy, ensuring that all handling of personal information complies with federal privacy laws and policies.
A dedicated Privacy Management Unit maintained a strong privacy program by overseeing the responsible collection, use, storage, and disclosure of personal information.
Security
To protect the department's information, assets, and employees from risks both within and outside the organization, we focused our security efforts on the following actions:
- We launched an emergency management system that integrates business continuity, IT recovery, and emergency response planning. This system supports faster coordination during emergencies and helps plan, test, and monitor responses for building incidents, service disruptions, and crises-maintaining the continuity of public services and keeping employees and clients safe; and
- We improved our essential security awareness training with the use of clearer language and improved visuals. These efforts enable the protection of employees, the department's assets and the personal information of Canadians and other clients.
Resources required to achieve results
Table 6.1 provides a summary of the planned and actual spending and full-time equivalents required to achieve results.
| Resource | Planned | Actual |
|---|---|---|
| Gross spending | $1,167,648,689 | $1,304,593,561 |
| Net spending | $414,403,173 | $485,677,742 |
| Full-time equivalents | 5,517 | 6,374 |
Please refer to ESDC's Financial Framework for a complete description of the departmental financial profile, including an explanation of gross planned spending.
The Finances section of the Infographic for Employment and Social Development Canada on GC Infobase and the People section of the Infographic for Employment and Social Development Canada on GC Infobase provide complete financial and human resources information related to its program inventory.
Contracts awarded to Indigenous businesses
In 2024-25, we supported contracts with Indigenous businesses through various activities. These included:
- Updated guidance on the Procurement Strategy for Indigenous Businesses to promote awareness of the importance of considering Indigenous companies when preparing contracts.
- Provided resources and information on Indigenous Procurement within our training course and awareness sessions.
- Used Indigenous subcontracting within our largest program - Benefits Delivery Modernization (BDM).
Government of Canada departments are required to award at least 5% of the total value of contracts to Indigenous businesses every year.
Employment and Social Development Canada results for 2024-25:
As shown in Table 6.2, Employment and Social Development Canada awarded 6.91% of the total value of all contracts to Indigenous businesses for the fiscal year.
| Contracting performance indicators | 2024-25 Results |
|---|---|
| Total value of contracts awarded to Indigenous businesses² (A) | $ 44,005,213 |
| Total value of contracts awarded to Indigenous and non‑Indigenous businesses³ (B) | $ 636,851,503 |
| Value of exceptions approved by deputy head (C) | $ 0 |
| Proportion of contracts awarded to Indigenous businesses [A / (B−C) × 100] | 6.91 % |
|
|
In its 2025-26 Departmental Plan, Employment and Social Development Canada estimated that it would award 5% of the total value of its contracts to Indigenous businesses by the end of 2024-25.
Overall risks and mitigation strategies
To ensure Canadians receive high quality, timely, efficient and accessible delivery of government programs and services, the department considered key risks. If these risks occur, there could be a significant effect on the timeliness and quality of the programs and services the department delivered to the public. The next section briefly explains these risks and how the department plans to handle them.
Theme 1: Planning and Stewardship
To mitigate risks related to planning and stewardship we developed a joint financial and human resources plan. Our plan takes into account the 2023 Fall Economic Statement's emphasis on refocusing government spending. The plan will guide the department in balancing its budget and resourcing our most important services and activities. To mitigate risks, we:
- Increased governance and communication around spending;
- Developed action plans to manage risks related to planning and stewardship;
- Implemented new measures for workforce management, including staffing governance; and
- Pursued innovation through the Investment Fund and selected Artifical Intelligence initiatives.
Theme 2: Technical Debt Remediation
To mitigate risks related to outdated or underperforming technology, the department launched the Technical Debt Remediation Initiative. It focuses on improving network performance, updating outdated applications, and establishing Disaster Recovery solutions for critical systems. In parallel, several modernization efforts were advanced to strengthen infrastructure and ensure service continuity, including:
- Implementing the Network Modernization Project and Government of Canada Secure Infrastructure to upgrade and modernize networks.
- Establishing disaster recovery solutions for all mission-critical systems to ensure the timely restoration of programs and services for Canadians.
- Updating over 60 IT applications, upgrading operating systems and infrastructure to meet departmental computing needs and support continued delivery of digital services.
- Establishing governance oversight and transition plans to ensure uninterrupted delivery of programs and services throughout the modernization process.
- Deploying modern telephony services to support citizen service officers in assisting Canadian citizens.
Theme 3: Cybersecurity
To mitigate risks related to the rapidly-evolving and increasingly-complex cyber threat landscape, the Department is investing in identifying and addressing vulnerabilities early. While ensuring alignment with the whole-of-government approach to Cyber Threat Management, the Department adopted a comprehensive approach to safeguard systems and ensure secure, uninterrupted service for Canadians.
Key actions to prevent threats, mitigate risks, and reinforce the Department's ability to deliver services and benefits to Canadians include:
- Regular policy reviews and enforcement of procedural compliance;
- Enhanced identity management and improved vulnerability detection;
- Employee awareness and development on cybersecurity; and
- Operational improvements and collaboration with external industry experts for evaluations.
Theme 4: Workforce Management and Employee Wellness
To serve Canadians, the department needs a skilled, healthy and diverse workforce. To mitigate risks related to workforce capacity and employee well-being, the department continues to invest in building a skilled, healthy, and diverse workforce. For the sixth consecutive year, we were named one of Canada's Top 100 Employers for 2024-2025, which helps us attract and retain talent in a competitive job market.
Aligned with our Workplace Mental Health and Well-being Action Plan, we continued to promote mental health resources and foster a safe, supportive work environment. These efforts help mitigate the impact of high workloads and stressors, enabling employees to meet job demands effectively.
Theme 5: Business Transformation
To mitigate risks related to outdated service delivery models and evolving client expectations, we are undertaking several transformational projects to improve the client and employee experience for benefits and service delivery. To ensure these efforts are well-managed, people-centered, and sustainable, we have implemented the following actions:
- Invested in governance and oversight of projects/programs for transparency and accountability;
- Focused on strong change management to ensure continuity and reliability of services as improvements are implemented; and
- Engaged with stakeholders to yield more inclusive, accessible and user friendly services.
Theme 6: Service Excellence
To mitigate risks related to service disruptions and lower client satisfaction, we focused on enhancing the client experience and safeguarding service delivery. To maintain service excellence, we prioritized sound governance and decision-making by aligning workforce and workload capacity with operational needs. This included developing dashboards and monitoring tools to support data-driven decisions and investing in change management.
Our enterprise-wide Data Strategy remains a cornerstone of resilience and agility. Over the past year, we advanced key initiatives in governance, infrastructure, and innovation-improving data quality, accessibility, and analytics. These efforts enabled us to anticipate challenges, respond more quickly, and deliver services more reliably.
Spending and human resources
In this section:
Spending
This section presents an overview of the department's actual and planned expenditures from fiscal year 2022-23 to fiscal year 2027-28.
Actual spending for fiscal year 2024-25
For fiscal year 2024-25, the department's expenditures on programs and services total $194.5 billion. Of that amount, $186.4 billion (95.8%) benefit Canadians through statutory and voted transfer payments. These include Employment Insurance (EI), the Canada Pension Plan (CPP), Old Age Security (OAS), the Canada Student Financial Assistance Program and Canada Apprentice Loans, the Canada Education Savings Program, the Canada Disability Savings Program, the Early Learning and Child Care Program, and Workforce Development Agreements.
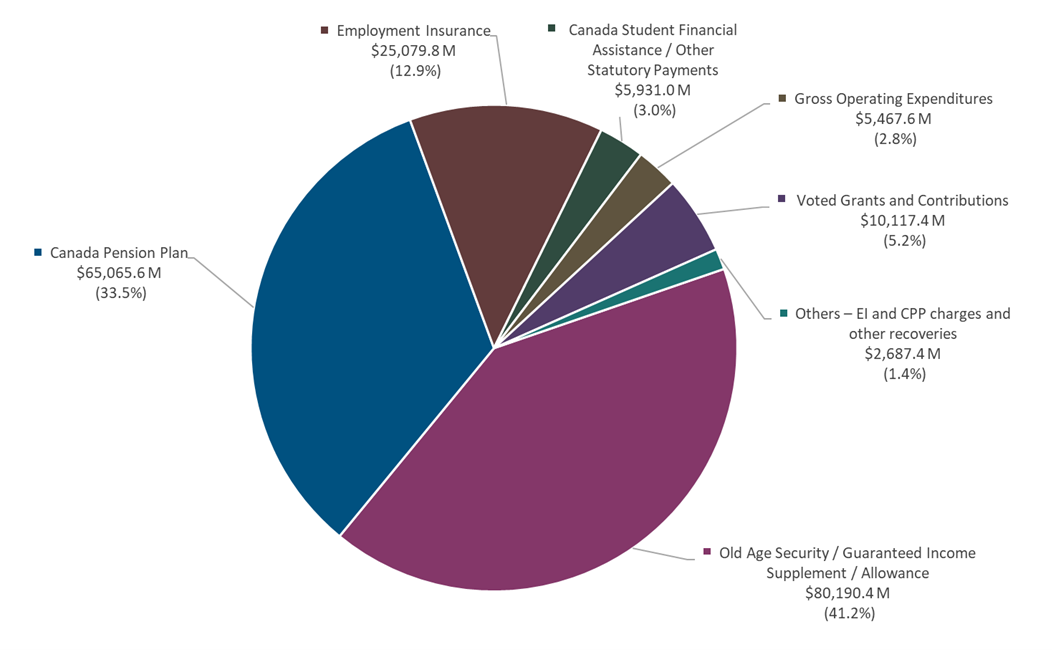
Text description of figure 2
- Consolidated total: $194,539.2 million
- Old Age Security; Guaranteed Income Supplement; Allowance: $80,190.4 million (41.2%)
- Canada Pension Plan: $65,065.6 million (33.5%)
- Employment Insurance: $25,079.8 million (12.9%)
- Voted Grants and Contributions: $10,117.4 million (5.2%)
- Canada Student Financial Assistance; Other statutory payments: $5,931.0 million (3.0%)
- Gross operating expenditures: $5,467.6 million (2.8%)
- Others - EI and CPP charges and other recoveries: $2,687.4 million (1.4%)
This figure was converted into text for accessibility reasons.
ESDC gross operating actual budgetary
- Net operating costs: $2,678.9 million [note: Net operating costs include $1,455.7 million in net voted operating expenditures, $502.2 million for delivery service to the public on behalf of partners under the Department of Employment and Social Development Act, $489.6 million in contributions to employee benefit plans, $122.7 million in pandemic-related benefits integrity and collection activities, $90.1 million in statutory administrative fees related to Canada Student Loans and Apprentice Loans, $16.1 million in net expenditures for Federal Workers' Compensation and $2.5 million for other items.]
- Add recoveries in relation to:
- Canada Pension Plan: $559.0 million
- Employment Insurance Operating Account: $2,228.6 million
- Government Employee Compensation Act: $1.1 million
- Sub-total recoveries: $2,788.7 million
- Total gross operating actual spending: $5,467.6 million
ESDC transfer payments - Actual spending
- Voted grants and contributions: $10,117.4 million
- Old Age Security / Guaranteed Income Supplement / Allowance
- Old Age Security: $60,648.1 million
- Guaranteed Income Supplement: $18,910.4 million
- Allowance: $631.9 million
- Old Age Security / Guaranteed Income Supplement / Allowance total: $80,190.4 million
- Canada Student Financial Assistance / Other statutory payments
- Canada Student Financial Assistance Program and Canada Apprenticeship Loans: $3,763.4 million
- Canada Education Savings Program: $1,394.5 million
- Canada Disability Savings Program: $862.6 million
- National School Food Program: $70.1 million
- Wage Earner Protection Program: $63.4 million
- Canada Worker Lockdown Benefit: $-2.6 million
- Universal Child Care: $-3.9 million
- Canada Recovery Sickness Benefit: $-6.1 million
- Canada Emergency Response Benefits: $-21.2 million
- Canada Recovery Caregiving Benefit: $-23.8 million
- Canada Recovery Benefit: $-175.4 million
- Other Specified Purpose Accounts - including Government Annuities Account and the Civil Service Insurance Fund: $10.0 million
- Canada Student Financial Assistance / Other statutory payments total: $5,931.0 million
- Canada Pension Plan benefits: $65,065.6 million
- Employment Insurance benefits
- Employment Insurance - Part I: $22,983.3 million
- Employment Insurance - Part II: $2,096.5 million
- Employment Insurance benefits total: $25,079.8 million
- Total transfer payments actual spending: $186,384.2 million
ESDC's Financial Framework
The department has a complex financial structure, with various funding mechanisms used to deliver its mandate. The department is funded by 4 main sources of funds:
- Appropriated funds from the Consolidated Revenue Fund
- The Employment Insurance (EI) Operating Account
- The Canada Pension Plan (CPP)
- Other government departments and Crown corporations
Expenditures related to the EI Operating Account and the CPP, as well as expenditures that are recovered from Crown corporations and other government departments for the administration of the Government Employee Compensation Act, are excluded from ESDC's Main and Supplementary Estimates and net spending because they are not voted by Parliament.
EI and CPP benefits and related administrative costs are charged against revenues earmarked in separate specified purpose accounts:
- The EI program provides financial support and other assistance to eligible workers and is entirely funded by contributions from employees and employers
- The CPP is an income security plan which is funded by the contributions of employees, employers, and self-employed persons and by the revenue earned on plan investments. It provides partial income protection in the case of the retirement, disability or death of a contributor to virtually all employed and self-employed persons in Canada, excluding Quebec, which operates its own comprehensive pension plan
Administrative costs incurred by the department in the delivery of programs related to EI and CPP are charged to their respective specified purpose accounts and reported as revenues netted against expenditures under the department.
The Department of Employment and Social Development Act was amended in June 2018 to broaden the department's mandate to include service delivery to the public with a view to improve services to Canadians. The department has the legislative authority to deliver services to the public for partners on a cost-recovery basis as well as to deliver select services for the Government of Canada, such as passport services and Canada Dental Care Plan.
These items are included in the department's gross spending to provide readers with the full cost of the resources managed by ESDC to deliver its mandate. In addition, spending by other departments and crown corporations for the administration of EI and CPP is also included in order to present a complete picture of costs associated with the department's programs and services.
The sources of funds, including specified purpose accounts, for each of the Department's core responsibilities are as follows:
Core Responsibility 1: Social Development
- Consolidated Revenue Fund
Core Responsibility 2: Pensions and Benefits
- Consolidated Revenue Fund
- CPP (in gross spending only for CPP benefits and related administrative costs)
Core Responsibility 3: Learning, Skills Development and Employment
- Consolidated Revenue Fund
- EI Operating Account (in gross spending only for EI benefits and related administrative costs)
Core Responsibility 4: Working Conditions and Workplace Relations
- Consolidated Revenue Fund
- Crown corporations and other departments (in gross spending only for the administration of the Government Employee Compensation Act)
Core Responsibility 5: Information Delivery and Services for Other Departments
- Consolidated Revenue Fund
- Revenues from partners using legislative cost-recovery authority to deliver programs and services on their behalf
Internal Services
- Consolidated Revenue Fund
- CPP (in gross spending only for CPP administrative costs)
- EI Operating Account (in gross spending only for EI administrative costs)
- Revenues from partners using legislative cost-recovery authority to deliver programs and services on their behalf
Analysis of actual spending
Table 7.1 reconciles how much money Employment and Social Development Canada spent in fiscal year 2024-25, from actual gross spending to actual net spending.
| Item | Actual gross spending for 2024-25 | Less: actual gross spending in specified purpose accounts for 2024-25 | Less: actual revenues netted against expenditures for 2024-25 |
Actual net spending for 2024-25 |
|---|---|---|---|---|
| Total actual spending | 194,539,172,084 | 92,842,858,557 | 2,788,693,761 | 98,907,619,766 |
Please refer to the ESDC's Financial Framework for a complete description of the departmental financial profile, including an explanation of gross planned spending.
The department is responsible for the direct delivery of programs such as the Old Age Security (OAS), the Canada Pension Plan (CPP), Employment Insurance (EI) and other statutory transfer payments. These programs can be affected by variances in the average number of beneficiaries and variances in the average benefit rates. This is the case for the Old Age Security pension and Guaranteed Income Supplement (OAS/GIS) and for the CPP. For EI, spending can be influenced by many factors such as the number of eligible individuals establishing claims for EI benefits. This number varies with the economy, the benefit rates and the implementation of new initiatives.
In the fiscal year 2024-25, OAS/GIS and CPP payments followed their usual trend. Compared to the previous fiscal year, OAS/GIS spending increased by $4.1 billion and the CPP benefits increased by $4.2 billion, due to the aging population and changes in average monthly benefits. EI Benefits also increased by $1.6 billion, mainly due to an increase in regular benefits attributable to a rise in unemployment and an increase in average weekly benefits.
Refocusing Government Spending
In Budget 2023, the government committed to reducing spending by $14.1 billion over five years, starting in 2023-24, and by $4.1 billion annually after that.
As part of meeting this commitment, Employment and Social Development Canada identified the following spending reductions:
- 2024-25: $40,464,000
- 2025-26: $69,950,000
- 2026-27 and after: $118,523,000
Reductions for fiscal year 2024-25 can be seen by department here: Refocusing Government Spending: Results for 2024-25, 2025-26, and 2026-27
Employment and Social Development Canada realized reductions through the following measures:
- Grants and Contribution Programs - We reduced spending within our grants and contributions programs in a way that minimized direct impacts to clients and maintained capacity building and core community supports.
- Travel and Professional Services - We reduced consulting, professional services, and travel spending across all program areas and the department. The department continued to use virtual meeting technology instead of travel where possible.
- Operating Expenses - We reduced operating expenses through a mix of targeted and percentage-based reductions. The department found savings internally through several activities, including making processes more digital.
The figures in this departmental results report reflect these reductions.
Budgetary performance summary
The following tables show information on spending for each of Employment and Social Development Canada's Core Responsibilities and for its internal services for the past three fiscal years. The first table shows the gross amounts, while the second table shows the net amounts. Please refer to the ESDC's Financial Framework for a complete description of the departmental financial profile, including an explanation of gross planned spending.
Table 7.2 shows the money that Employment and Social Development Canada spent in each of the past three years on its core responsibilities and on its internal services – Gross (dollars).
| Core responsibilities and internal services | 2024-25 planned spending1 | 2024-25 total authorities available for use | Actual spending over three years (authorities used) |
|---|---|---|---|
| Core Responsibility 1: Social Development | 7,930,989,184 | 8,046,550,189 | 2022‑23: 6,463,358,293 2023‑24: 6,884,431,661 2024‑25: 8,018,859,343 |
| Core Responsibility 2: Pensions and Benefits | 148,006,897,563 | 147,171,136,677 | 2022‑23: 127,532,814,815 2023‑24: 138,642,211,774 2024‑25: 147,165,165,946 |
| Core Responsibility 3: Learning, Skills Development and Employment | 33,754,261,064 | 35,022,371,594 | 2022‑23: 32,666,489,864 2023‑24: 33,930,132,694 2024‑25: 34,552,944,563 |
| Core Responsibility 4: Working Conditions and Workplace Relations | 198,483,987 | 207,640,122 | 2022‑23: 156,557,151 2023‑24: 198,251,624 2024‑25: 206,974,970 |
| Core Responsibility 5: Information Delivery and Services for Other Departments | 599,204,881 | 603,337,734 | 2022‑23: 460,979,539 2023‑24: 545,781,525 2024‑25: 603,214,600 |
| Subtotal | 190,489,836,679 | 191,051,036,316 | 2022‑23:167,280,199,662 2023‑24:180,200,809,278 2024‑25: 190,547,159,422 |
| Internal services | 1,167,648,689 | 1,327,019,102 | 2022‑23: 1,362,786,014 2023‑24: 1,399,457,961 2024‑25: 1,304,593,561 |
| Other Costs2 & 3 | 2,589,012,358 | 2,687,105,410 | 2022‑23: 2,321,914,283 2023‑24: 2,557,353,857 2024‑25: 2,687,419,101 |
| Total | 194,246,497,726 | 195,065,160,828 | 2022‑23:170,964,899,959 2023‑24:184,157,621,096 2024‑25: 194,539,172,084 |
- Notes:
- Planned spending for fiscal year 2024-25 is presented as per ESDC's 2024-25 Departmental Plan (with the exception of "Other Costs" and the "Total", see Note 3), since planned expenditures related to the EI Operating Account and the Canada Pension Plan, as well as planned expenditures that are recovered from Crown corporations and other government departments for the administration of the Government Employee Compensation Act, are excluded from the Main Estimates.
- Other costs include administrative costs of other government departments charged to the EI Operating Account and the Canada Pension Plan. It also includes EI doubtful accounts and recoveries from other government departments.
- The methodology to calculate "Other costs" has been modified in the Departmental Plan 2024-25 and in the Departmental Result Report 2023-24, to align with Financial Statements and Public accounts presentation. Comparatives from the fiscal year 2022-23 have been reclassified to conform to the current year's presentation.
Table 7.3 shows the money that Employment and Social Development Canada spent in each of the past three years on its core responsibilities and on its internal services – Net (dollars).
| Core responsibilities and internal services | 2024-25 Main Estimates | 2024-25 total authorities available for use | Actual spending over three years (authorities used) |
|---|---|---|---|
| Core Responsibility 1: Social Development | 7,930,989,184 | 8,046,550,189 | 2022‑23: 6,463,358,293 2023‑24: 6,884,431,661 2024‑25: 8,018,859,343 |
| Core Responsibility 2: Pensions and Benefits | 82,359,460,288 | 81,688,518,453 | 2022‑23: 71,252,425,079 2023‑24: 77,425,657,291 2024‑25: 81,688,146,091 |
| Core Responsibility 3: Learning, Skills Development and Employment | 7,230,578,580 | 8,005,442,008 | 2022‑23: 9,316,562,627 2023‑24: 8,856,955,550 2024‑25: 7,905,833,330 |
| Core Responsibility 4: Working Conditions and Workplace Relations | 197,583,987 | 206,240,122 | 2022‑23: 155,343,293 2023‑24: 197,022,291 2024‑25: 205,888,660 |
| Core Responsibility 5: Information Delivery and Services for Other Departments | 599,204,881 | 603,337,734 | 2022‑23: 460,979,539 2023‑24: 545,781,525 2024‑25: 603,214,600 |
| Subtotal | 98,317,816,920 | 98,550,088,506 | 2022‑23:87,648,668,831 2023‑24:93,909,848,318 2024‑25: 98,421,942,024 |
| Internal services | 414,403,173 | 489,903,286 | 2022‑23: 503,568,500 2023‑24: 533,532,396 2024‑25: 485,677,742 |
| Total | 98,732,220,093 | 99,039,991,792 | 2022‑23:88,152,237,331 2023‑24:94,443,380,714 2024‑25: 98,907,619,766 |
Analysis of the past three years of spending
The overall increase of $23.6 billion in gross spending from fiscal year 2022-23 to fiscal year 2024-25 can primarily be attributed to the increase in Old Age Security (OAS) and Canada Pension Plan (CPP) benefits, due to the growing number of beneficiaries resulting from the aging population and an increase in benefits.
Below is a summary of the main reasons for the overall increase in gross spending from fiscal year 2022-23 to fiscal year 2024-25:
- an increase of $10.8 billion in OAS benefits, including the Guaranteed Income Supplement and Allowances, mainly attributable to the growing population of seniors and projected consumer price inflation, to which the benefits are fully indexed.
- an increase of $9.1 billion in CPP benefits, also mainly attributable to the growing population of seniors and projected consumer price inflation, to which the benefits are fully indexed.
- an increase of $3.2 billion in Employment Insurance (EI) benefits mainly attributable to a rise in unemployment-related regular benefits and an increase in the average weekly benefit amount.
- a net increase of $0.5 billion for other departmental spending.
The Finances section of the Infographic for Employment and Social Development Canada on GC Infobase offers more financial information from previous years.
The following tables show information on spending for each of Employment and Social Development Canada's core responsibilities and for its internal services for the upcoming three fiscal years. The first table shows the gross amounts, while the second table shows the net amounts. Please refer to the ESDC's Financial Framework for a complete description of the departmental financial profile, including an explanation of gross planned spending.
Table 7.4 shows Employment and Social Development Canada’s planned spending for each of the next three years on its core responsibilities and on its internal services – Gross (dollars).
| Core responsibilities and internal services | 2025-26 planned spending | 2026-27 planned spending | 2027-28 planned spending |
|---|---|---|---|
| Core Responsibility 1: Social Development | 9,305,468,025 | 9,421,668,075 | 9,358,362,610 |
| Core Responsibility 2: Pensions and Benefits | 156,750,636,455 | 165,408,234,329 | 173,893,268,737 |
| Core Responsibility 3: Learning, Skills Development and Employment | 37,441,357,910 | 34,262,512,797 | 33,774,576,525 |
| Core Responsibility 4: Working Conditions and Workplace Relations | 193,294,667 | 191,829,510 | 191,840,055 |
| Core Responsibility 5: Information Delivery and Services for Other Departments | 518,284,645 | 462,188,412 | 399,980,528 |
| Subtotal | 204,209,041,702 | 209,746,433,123 | 217,618,028,455 |
| Internal services | 1,252,748,953 | 1,159,883,142 | 1,130,828,879 |
| Other Costs1 | 2,764,335,073 | 2,884,190,084 | 3,031,482,681 |
| Total | 208,226,125,728 | 213,790,506,349 | 221,780,340,015 |
- Note:
- Other costs include administrative costs of other government departments charged to the EI Operating Account and the Canada Pension Plan. It also includes EI doubtful accounts and recoveries from other government departments.
Table 7.5 shows Employment and Social Development Canada’s planned spending for each of the next three years on its core responsibilities and on its internal services – Net (dollars).
| Core responsibilities and internal services | 2025-26 planned spending | 2026-27 planned spending | 2027-28 planned spending |
|---|---|---|---|
| Core Responsibility 1: Social Development | 9,305,468,025 | 9,421,668,075 | 9,358,362,610 |
| Core Responsibility 2: Pensions and Benefits | 87,514,529,036 | 92,382,108,954 | 97,019,890,798 |
| Core Responsibility 3: Learning, Skills Development and Employment | 7,748,222,181 | 6,595,529,782 | 6,504,908,449 |
| Core Responsibility 4: Working Conditions and Workplace Relations | 192,394,667 | 190,929,510 | 190,940,055 |
| Core Responsibility 5: Information Delivery and Services for Other Departments | 518,284,645 | 462,188,412 | 399,980,528 |
| Subtotal | 105,278,898,554 | 109,052,424,733 | 113,474,082,440 |
| Internal services | 454,491,386 | 394,849,370 | 373,391,828 |
| Total | 105,733,389,940 | 109,447,274,103 | 113,847,474,268 |
Analysis of the next three years of spending
The department expects an overall increase of $13.6 billion in gross planned spending from fiscal year 2025-26 to fiscal year 2027-28. This can be primarily explained by annual increases to CPP and OAS benefits.
Below is a summary of the main reasons for the overall increase in funding over the planning years:
- planned OAS benefits, including Guaranteed Income Supplement and Allowances, are expected to reach $94.6 billion in fiscal year 2027-28, which represents an increase of $9.1 billion from the 2025-26 planned spending of $85.5 billion. This variance is mainly explained by an increased number of beneficiaries due to the aging population and an increase in benefits, resulting from the indexation.
- planned CPP benefits are estimated at $76.5 billion in fiscal year 2027-28, an increase of $7.7 billion from the 2025-26 planned spending of $68.8 billion, mainly attributed to inflation assumptions. It is also associated with a higher number of beneficiaries due to the aging population.
- an increase of $0.4 billion to Canada Disability Benefits which aims to alleviate poverty for persons with disabilities that are in the lowest income thresholds by providing a payment of up to $200 per recipient per month starting in July 2025.
Offsetting these increases are some decreases from fiscal year 2025-26 to fiscal year 2027-28, which contribute to the variance. This includes the following:
- EI benefits are expected to decrease by $2.4 billion from fiscal year 2025-26 to the fiscal year 2027-28, based on the Department of Finance labour market forecast included in the 2024 Fall Economic Statement (FES) and Statistics Canada information on the Canadian labour market as of November 1, 2024. These projections do not take into account any scenarios of the impact of the US tariffs on the Canadian economy.
- a decrease of $0.6 billion in planned voted grants and contributions, mainly related to the sunsetting of funding for programs such as Student Work Placement Program and the Canada Summer Jobs program.
- other decreases in statutory and voted planned spending, totaling $0.6 billion.
Planned spending currently included in this Departmental Results Report is presented as per ESDC's 2025-26 Departmental Plan and reflects authorities approved as of tabling in Parliament. As priorities shift and evolve, additional funding will be sought and approved for fiscal year 2025-26 and future years through Estimates.
The Finances section of the Infographic for Employment and Social Development Canada on GC Infobase offers more detailed financial information related to future years.
Budgetary actual gross and net actual spending summary
The following table reconciles gross actual spending with net actual spending for the fiscal year 2024-25 for each of Employment and Social Development Canada's core responsibilities and for its internal services.
Table 7.6 reconciles gross planned spending with net spending for 2024-25 (dollars).
| Core responsibilities and internal services | Actual gross spending for 2024-25 | Less: actual gross spending in specified purpose accounts for 2024-25 | Less: actual revenues netted against expenditures for 2024-25 | Actual net spending for 2024-25 |
|---|---|---|---|---|
| Core Responsibility 1: Social Development | 8,018,859,343 | 0 | 0 | 8,018,859,343 |
| Core Responsibility 2: Pensions and Benefits | 147,165,165,946 | 65,065,648,269 | 411,371,586 | 81,688,146,091 |
| Core Responsibility 3: Learning, Skills Development and Employment | 34,552,944,563 | 25,089,791,187 | 1,557,320,046 | 7,905,833,330 |
| Core Responsibility 4: Working Conditions and Workplace Relations | 206,974,970 | 0 | 1,086,310 | 205,888,660 |
| Core Responsibility 5: Information Delivery and Services for Other Departments | 603,214,600 | 0 | 0 | 603,214,600 |
| Subtotal | 190,547,159,422 | 90,155,439,456 | 1,969,777,942 | 98,421,942,024 |
| Internal services | 1,304,593,561 | 0 | 818,915,819 | 485,677,742 |
| Other Costs1 | 2,687,419,101 | 2,687,419,101 | 0 | 0 |
| Total | 194,539,172,084 | 92,842,858,557 | 2,788,693,761 | 98,907,619,766 |
- Note:
- Other costs include administrative costs of other government departments charged to the EI Operating Account and the Canada Pension Plan. It also includes EI doubtful accounts and recoveries from other government departments.
Analysis of budgetary actual gross and net planned spending summary
The variance between ESDC's budgetary gross and net actual spending in the fiscal year 2024-25 is explained by actual gross spending of $65.1 billion and $25.1 billion accounted in CPP and EI specified purpose accounts, respectively; by $2.7 billion of other costs, mostly related to administrative costs of other government departments charged to the EI operating account and the Canada Pension Plan; and by $2.8 billion of actual revenues netted against the ESDC's expenditures for administrative costs incurred by the department in the delivery of programs related to EI and CPP.
Please refer to ESDC's Financial Framework for a complete description of the departmental financial profile, including an explanation of gross planned spending.
The Finances section of the Infographic for Employment and Social Development Canada on GC Infobase offers information on the alignment of Employment and Social Development Canada's spending with Government of Canada's spending and activities.
Funding
This section provides an overview of the department's voted and statutory funding for its Core Responsibilities and for its internal services. Consult the Government of Canada budgets and expenditures for further information on funding authorities.
Figure 4 summarizes the department's approved voted and statutory funding from fiscal year 2022-23 to fiscal year 2027-28.
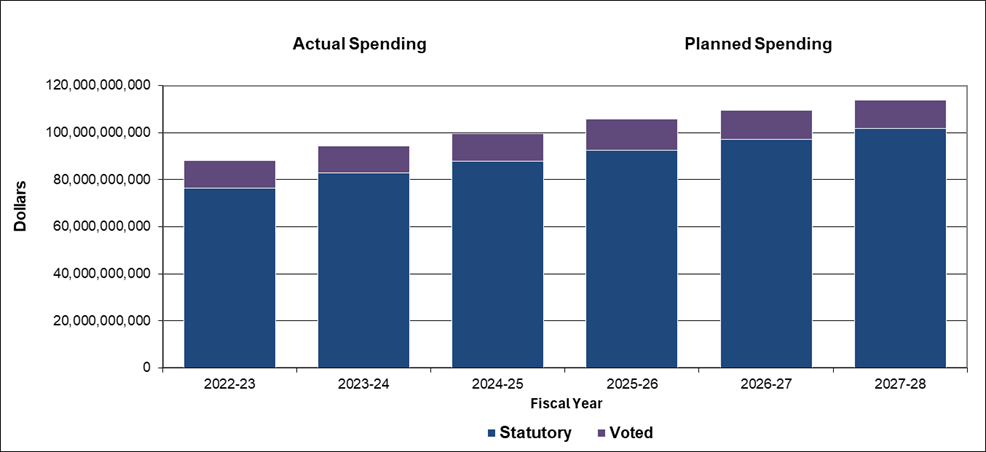
Text description of figure 4
| Year | 2022-23 Actual Spending | 2023-24 Actual Spending | 2024-25 Actual Spending | 2025-26 Planned Spending | 2026-27 Planned Spending | 2027-28 Planned Spending |
|---|---|---|---|---|---|---|
| Statutory | $76,489,375,962 | $82,840,593,310 | $87,334,481,786 | $92,589,411,733 | $97,164,227,381 | $101,757,631,874 |
| Voted1 | $11,662,861,369 | $11,602,787,404 | $11,573,137,980 | $13,143,978,207 | $12,283,046,722 | $12,089,842,394 |
| Total | $88,152,237,331 | $94,443,380,714 | $98,907,619,766 | $105,733,389,940 | $109,447,274,103 | $113,847,474,268 |
- Note 1: Voted expenditures or planned spending include debt write-offs in the fiscal years 2022-23, 2023-24, and 2025-26.
Analysis of statutory and voted funding over a six-year period
ESDC's statutory funding is expected to increase by $25.3 billion over the six-year period from fiscal year 2022-23 to fiscal year 2027-28. Below is a summary of the main reasons for the overall increase in funding over this six-year period:
- an increase of $25.2 billion in Old Age Security and Guaranteed Income Supplement statutory payments due to the aging population and changes in average monthly benefits, in line with indexation.
- an increase of $1.2 billion in Canada Disability Benefits aims to alleviate poverty for persons with disabilities who are in the lowest income brackets by providing a payment of up to $200 per recipient per month, starting in July 2025.
- the increase is offset by a decrease of $1.6 billion in the Canada Student Financial Assistance Program and Canada Apprentice Loans due to the conclusion of temporary COVID-19 support measures, such as the doubling of Canada Student Grants and the 40% increase in the maximum Canada Student Grants amount above pre-pandemic levels.
Voted expenditures are expected to increase by $0.4 billion over the six-year period starting in fiscal year 2022-23 to fiscal year 2027-28.
Consult the Public Accounts of Canada for further information on Employment and Social Development Canada's departmental voted and statutory expenditures.
Financial statements and financial statements highlights
The financial highlights are intended to serve as a general overview of Employment and Social Development Canada's (ESDC's) financial position and operations.
The following condensed consolidated financial statements are prepared in accordance with the Government's accounting policies, which are based on Canadian public sector accounting standards and are therefore different from reporting on the use of authorities, reflected in the rest of this report. Reconciliation between authorities used and the net cost of operations is set out in Note 3 of the Department's consolidated financial statements.
These consolidated financial statements include the transactions of the Employment Insurance Operating Account, a sub-entity under the control of ESDC. The accounts of this sub-entity have been consolidated with those of ESDC and all inter-organizational balances and transactions have been eliminated. The Canada Pension Plan (CPP) is excluded from ESDC's reporting entity because it is managed by both the Government of Canada and the provinces. Changes to the Canada Pension Plan require the agreement of at least two-thirds of the provinces, representing at least two-thirds of the population of all the provinces.
Financial statement highlights
ESDC's Consolidated Financial Statements (unaudited) for the year ended March 31, 2025.
Table 7.7 summarizes the expenses and revenues for 2024-25 which net to the cost of operations before government funding and transfers.
| Financial information | 2024-25 actual results |
2024-25 planned results | Difference (actual results minus planned) |
|---|---|---|---|
| Total expenses | 130,464,790,752 | 127,171,998,906 | 3,292,791,846 |
| Total revenues | 34,107,144,403 | 31,736,758,963 | 2,370,385,440 |
| Net cost of operations before government funding and transfers | 96,357,646,349 | 95,435,239,943 | 922,406,406 |
Analysis of expenses and revenues for 2024-25
Fiscal year 2024-25 expenses were $3,292.8 million higher than planned. This is mainly due to:
- An increase of $4,056 million in Learning, Skills Development and Employment mainly due to estimated unrecoverable COVID-19 benefits; and
- A decrease of $826.1 million in Pensions and Benefits mainly due to lower than expected benefits for Old Age Security (OAS) and Guaranteed Income Supplement (GIS).
2024-25 revenues were $2,370.4 million higher than planned. This is mainly due to:
- An increase of $1,515.7 million in Employment Insurance revenues due to higher than expected growth in employment and wages; and
- An increase of $798.9 million in Amortization of discount on loans due to the removal of interest on Canada Student Loans and Canada Apprentice Loans.
The 2024-25 planned results information is provided in ESDC's Consolidated Future-Oriented Statement of Operations (unaudited) for the year ending March 31, 2025.
Table 7.8 summarizes actual expenses and revenues and shows the net cost of operations before government funding and transfers.
| Financial information | 2024-25 actual results | 2023-24 actual results | Difference (2024-25 minus 2023-24) |
|---|---|---|---|
| Total expenses | 130,464,790,752 | 124,783,863,036 | 5,680,927,716 |
| Total revenues | 34,107,144,403 | 32,017,183,654 | 2,089,960,749 |
| Net cost of operations before government funding and transfers | 96,357,646,349 | 92,766,679,382 | 3,590,966,967 |
Analysis of differences in expenses and revenues between 2023-24 and 2024-25
Fiscal year 2024-25 expenses increased by $5,680.9 million compared to the previous fiscal year. The increase in expenses is mainly explained by:
- An increase of $4,288.0 million in Pension and Benefits expenses mainly due to an increase in the eligible population for OAS and GIS caused by the growing aging population and an increase in the maximum monthly benefit payable; and
- An increase of $1,101.1 million in Social Development expenses mainly due to the Early Learning and Child Care Program. In 2021-22, a Canada-wide system was initiated to provide provinces and territories with significant funding to reduce the cost of regulated childcare spaces.
Fiscal year 2024-25 revenues increased by $2,090.0 million compared to the previous fiscal year. The increase in revenues is mainly explained by an increase in Employment Insurance premiums mainly due to annual increases in maximum insurable earnings, an increase in average wages and an increase in paid employment.
Table 7.9 provides a brief snapshot of the amounts the department owes or must spend (liabilities) and its available resources (assets), which helps to indicate its ability to carry out programs and services.
| Financial information | Actual fiscal year 2024-25 | Previous fiscal year 2023-24 | Difference (2024-25 minus 2023-24) |
|---|---|---|---|
| Total net financial assets | 31,130,589,754 | 32,869,668,452 | (1,739,078,698) |
| Total net liabilities | 5,453,419,640 | 5,088,903,583 | 364,516,057 |
| Department net financial asset | 25,677,170,114 | 27,780,764,869 | (2,103,594,755) |
| Total non-financial assets | 873,099,198 | 675,907,898 | 197,191,300 |
| Department net financial position | 26,550,269,312 | 28,456,672,767 | (1,906,403,455) |
Analysis of department's liabilities and assets since last fiscal year
Fiscal year 2024-25 financial assets decreased by $1,739.1 million compared to the previous fiscal year. The decrease is mainly explained by:
- A decrease of $3,946.5 million in accounts receivable and advances mainly due to an increase of $4,092.9 million in the allowance for doubtful accounts reflecting the increase in the accounts receivable balance; and
- An increase of $2,207.4 million in loans receivable mainly due to an excess of new loans disbursed over the total amount of repayments received.
Fiscal year 2024-25 liabilities increased by $364.5 million compared to the previous fiscal year. The increase is mainly explained by an increase in the year-end balance of the liability related to Canada Pension Plan, which results from the timing of the weekly transfer to the CPP Investment Board for funds not immediately required to discharge benefit payments.
Human resources
This section presents an overview of the department's actual and planned human resources from fiscal year 2022-23 to fiscal year 2027-28.
Table 7.10 shows a summary in full-time equivalents of human resources for Employment and Social Development Canada’s core responsibilities and for its internal services for the previous three fiscal years.
| Core responsibilities and internal services | 2022 to 2023 actual FTEs | 2023-24 actual FTEs | 2024-25 actual FTEs |
|---|---|---|---|
| Core Responsibility 1: Social Development | 638 | 562 | 658 |
| Core Responsibility 2: Pensions and Benefits | 7,276 | 7,608 | 8,446 |
| Core Responsibility 3: Learning, Skills Development and Employment | 17,216 | 16,529 | 16,457 |
| Core Responsibility 4: Working Conditions and Workplace Relations | 872 | 807 | 822 |
| Core Responsibility 5: Information Delivery and Services for Other Departments | 4,382 | 4,748 | 5,462 |
| Subtotal | 30,384 | 30,254 | 31,845 |
| Internal Services | 6,575 | 6,361 | 6,374 |
| Total | 36,959 | 36,615 | 38,219 |
Analysis of human resources for the last three years
The overall increase of 1,260 full-time equivalents (FTEs) from fiscal year 2022-23 to fiscal year 2024-25 is primarily attributed to the following:
- an increase in FTEs resulting from the service delivery partnership with Health Canada, started in 2023-24, for the Canadian Dental Care Plan.
- an increase in temporary resources allocated for addressing the workloads related to Old Age Security (OAS) and the Canada Pension Plan (CPP), as well as supporting the Benefits Delivery Modernization.
These increases are partially offset by the following:
- a decrease in FTEs due to a reduction of temporary resources for the delivery of the Employment Insurance, Passport services and other Service Delivery Partnerships, resulting from a reduction of volumes, modernization efforts and other efficiencies.
- a decrease in FTEs for internal services, mainly explained by reductions in permanent funding and the sunsetting of funding for the corporate costs associated with various initiatives.
Table 7.11 shows the planned full-time equivalents for each of Employment and Social Development Canada’s core responsibilities and for its internal services for the next three years.
| Core responsibilities and internal services | 2025-26 planned FTEs | 2026-27 planned FTEs | 2027-28 planed FTEs |
|---|---|---|---|
| Core Responsibility 1: Social Development | 507 | 442 | 440 |
| Core Responsibility 2: Pensions and Benefits | 7,517 | 6,488 | 6,549 |
| Core Responsibility 3: Learning, Skills Development and Employment | 15,610 | 14,179 | 13,820 |
| Core Responsibility 4: Working Conditions and Workplace Relations | 839 | 831 | 831 |
| Core Responsibility 5: Information Delivery and Services for Other Departments | 4,045 | 3,370 | 2,319 |
| Subtotal | 28,518 | 25,310 | 23,959 |
| Internal Services | 5,806 | 5,346 | 5,275 |
| Total | 34,324 | 30,656 | 29,234 |
Analysis of human resources for the next three years
The reported Full-Time Equivalents (FTEs) are based on the funding approved within the Department's reference levels as of the preparation of the 2025-26 Main Estimates. These figures are subject to adjustment in accordance with subsequent funding decisions and/or the renewal of partnership agreements.
At the time of the preparing the 2025-26 Main Estimates, the planned full-time equivalents (FTEs) in fiscal year 2025-26 are 3,895 lower compared to actual FTEs in fiscal year 2024-25. This decrease is mainly attributed to:
- a reduction in planned FTEs for the delivery of Passport services and other service delivery partnerships on behalf of other government departments, such as the Canadian Dental Care Plan, impacting the planned FTEs in future years.
- lower FTEs for specific measures including the processing and payments of Employment Insurance and Old Age Security benefits.
- a decrease of FTEs for internal services, mainly explained by reductions in permanent funding and the sunsetting of funding for the corporate costs associated with various initiatives.
- a decrease of FTEs due to the winding-down of the emergency benefits program after the emergency period.
The overall decrease of 5,090 planned full-time equivalents (FTEs) from fiscal year 2025-26 to fiscal year 2027-28 is mainly explained by:
- a reduction in temporary resources provided for the delivery of various departmental programs and initiatives such as Employment Insurance, Old Age Security and CPP processing and payments, as well as the Temporary Foreign Worker Program and Canada Summer Jobs.
- modernization efforts and other efficiencies aimed at delivering Passport services and the Canadian Dental Care Plan, as well as partnership agreements to be renewed.
- a decrease of FTEs for internal services, mainly explained by reductions in permanent funding and the sunsetting of funding for the corporate costs associated with various initiatives.
Supplementary information tables
The following supplementary information tables are available on Employment and Social Development Canada's website:
- Details on transfer payment programs
- Up-front multi-year funding
- Gender‑based Analysis Plus
- Horizontal initiatives
- Response to Parliamentary committees and external audits
Federal tax expenditures
The tax system can be used to achieve public policy objectives through the application of special measures such as low tax rates, exemptions, deductions, deferrals and credits. The Department of Finance Canada publishes cost estimates and projections for these measures each year in the Report on Federal Tax Expenditures. This report also provides detailed background information on tax expenditures, including descriptions, objectives, historical information and references to related federal spending programs as well as evaluations and GBA Plus of tax expenditures.
Corporate information
Departmental profile
Appropriate minister: The Honourable Patty Hajdu
Institutional head: Paul Thompson, Deputy Minister, Employment and Social Development
Ministerial portfolio: Minister of Jobs and Families
Enabling instruments: Department of Employment and Social Development Act (S.C. 2005, c. 34); additional information on acts and regulations can be found on the Employment and Social Development Canada website
Year of incorporation / commencement: 2005
Other: For more information on the department's role, please visit the Employment and Social Development Canada website
Departmental contact information
Mailing address:
Portage IV
140 Promenade du Portage
Gatineau, QC K1A 0J9
Telephone: 1-800-622-6232
TTY: 1-800-622-6232
Email: NC-SPR-PSR-CPMD-DPMG-GD@hrsdc-rhdcc.gc.ca
Website: www.canada.ca/en/employment-social-development.html
Definitions
appropriation (crédit)
Any authority of Parliament to pay money out of the Consolidated Revenue Fund.
budgetary expenditures (dépenses budgétaires)
Operating and capital expenditures; transfer payments to other levels of government, departments or individuals; and payments to Crown corporations.
core responsibility (responsabilité essentielle)
An enduring function or role of a department. The departmental results listed for a core responsibility reflect the outcomes that the department seeks to influence or achieve.
Departmental Plan (plan ministériel)
A report that outlines the anticipated activities and expected performance of an appropriated department over a 3-year period. Departmental Plans are usually tabled in Parliament in spring.
departmental priority (priorité)
A plan, project or activity that a department focuses and reports on during a specific planning period. Priorities represent the most important things to be done or those to be addressed first to help achieve the desired departmental results.
departmental result (résultat ministériel)
A high-level outcome related to the core responsibilities of a department.
departmental result indicator (indicateur de résultat ministériel)
A quantitative or qualitative measure that assesses progress toward a departmental result.
departmental results framework (cadre ministériel des résultats)
A framework that connects the department's core responsibilities to its departmental results and departmental result indicators.
Departmental Results Report (rapport sur les résultats ministériels)
A report outlining a department's accomplishments against the plans, priorities and expected results set out in the corresponding Departmental Plan.
Full-time equivalent (équivalent temps plein)
Measures the person years in a departmental budget. An employee's scheduled hours per week divided by the employer's hours for a full-time workweek calculates a full-time equivalent. For example, an employee who works 20 hours in a 40-hour standard workweek represents a 0.5 full-time equivalent.
Gender-based Analysis Plus (GBA Plus) (analyse comparative entre les sexes plus [ACS Plus])
An analytical tool that helps to understand the ways diverse individuals experience policies, programs and other initiatives. Applying GBA Plus to policies, programs and other initiatives helps to identify the different needs of the people affected, the ways to be more responsive and inclusive, and the methods to anticipate and mitigate potential barriers to accessing or benefitting from the initiative. GBA Plus goes beyond biological (sex) and socio-cultural (gender) differences to consider other factors, such as age, disability, education, ethnicity, economic status, geography (including rurality), language, race, religion, and sexual orientation.
government priorities (priorités pangouvernementales)
For the purpose of the 2024-25 Departmental Results Report, government priorities are the high-level themes outlining the government's agenda as announced in the 2021 Speech from the Throne.
horizontal initiative (initiative horizontale)
A program, project or other initiative where two or more federal departments receive funding to work collaboratively on a shared outcome usually linked to a government priority, and where the ministers involved agree to designate it as horizontal. Specific reporting requirements apply, including that the lead department must report on combined expenditures and results.
Indigenous business (entreprise autochtones)
For the purposes of a Departmental Result Report, this includes any entity that meets the Indigenous Services Canada's criteria of being owned and operated by Elders, band and tribal councils, registered in the Indigenous Business Directory or registered on a modern treaty beneficiary business list.
non‑budgetary expenditures (dépenses non budgétaires)
Net outlays and receipts related to loans, investments and advances, which change the composition of the financial assets of the Government of Canada.
performance (rendement)
What a department did with its resources to achieve its results, how well those results compare to what the department intended to achieve, and how well lessons learned have been identified.
performance indicator (indicateur de rendement)
A qualitative or quantitative measure that assesses progress toward a departmental-level or program-level result, or the expected outputs or outcomes of a program, policy or initiative.
plan (plan)
The articulation of strategic choices, which provides information on how a department intends to achieve its priorities and associated results. Generally, a plan will explain the logic behind the strategies chosen and tend to focus on actions that lead to the expected result.
planned spending (dépenses prévues)
For Departmental Plans and Departmental Results Reports, planned spending refers to the amounts presented in Main Estimates. Departments must determine their planned spending and be able to defend the financial numbers presented in their Departmental Plans and Departmental Results Reports.
program (programme)
An Individual, group, or combination of services and activities managed together within a department and focused on a specific set of outputs, outcomes or service levels.
program inventory (répertoire des programmes)
A listing that identifies all the department's programs and the resources that contribute to delivering on the department's core responsibilities and achieving its results.
result (résultat)
An outcome or output related to the activities of a department, policy, program or initiative.
statutory expenditures (dépenses législatives)
Spending approved through legislation passed in Parliament, other than appropriation acts. The legislation sets out the purpose and the terms and conditions of the expenditures.
target (cible)
A quantitative or qualitative, measurable goal that a department, program or initiative plans to achieve within a specified time period.
voted expenditures (dépenses votées)
Spending approved annually through an appropriation act passed in Parliament. The vote also outlines the conditions that govern the spending.