
Vaccine Preventable Disease: Surveillance Report to December 31, 2019
Table of contents
- List of figures and tables
- Abbreviations
- Executive summary
- Introduction
- Methods
- Results
- Diphtheria
- Tetanus
- Invasive disease due to Haemophilus influenza serotype b (Hib)
- Invasive meningococcal disease (IMD)
- Mumps
- Summary
- Vaccine preventable diseases with moderate-level incidence in Canada
- Conclusion
- Acknowledgements
- Appendix A: Methods and limitations
- References
- Endnotes
Download the alternative format
(PDF format, 743 KB, 68 pages)
Date published: 2022-05-20
List of figures and tables
- Figure 1: Total number and average incidence rates (per 100,000 population) of reported vaccine preventable disease cases in Canada by age group, 2015 to 2019 (n=39,546)
- Table 1. Average annual reported cases and range of nationally notifiable vaccine preventable disease in Canada by age group, 2015 to 2019.
- Table 2. Average annual incidence rates (cases per 100,000 population) and range of nationally notifiable vaccine preventable diseases in Canada by age group, 2015 to 2019.
- Figure 2: Number and incidence rates (per 100,000 population) of reported measles cases in Canada by year, 1950 to 2019
- Figure 3: Total number and overall incidence rates (per 100,000 population) of reported measles cases in Canada by age group, 2015 to 2019 (n=394)
- Figure 4: Number and incidence rates (per 100,000 population) of reported rubella cases in Canada by year, 1950 to 2019
- Figure 5: Number and incidence rate (per 100,000 population) of reported acute flaccid paralysis cases in children less than 15 years of age, in Canada by year, 1996 to 2019
- Figure 6: Number and incidence rates (per 100,000 population) of reported diphtheria cases in Canada by year, 1924 to 2019
- Figure 7: Number and incidence rates (per 100,000 population) of reported tetanus cases in Canada by year, 1935 to 2019
- Figure 8: Number and incidence rates (per 100,000 population) of reported cases of invasive disease due to Hib in Canada by year, 1986 to 2019
- Figure 9: Total number and overall incidence rate (per 100,000 population) of reported cases of invasive disease due to Hib in Canada by age group, 2015 to 2019 (n=87)
- Figure 10: Number and incidence rate (per 100,000 population) of reported invasive meningococcal disease cases in Canada by year, 1997 to 2019
- Figure 11: Incidence of IMD (per 100,000 population) in Canada by serogroup and year, 1997 to 2019
- Figure 12: Total reported cases and overall incidence rate (per 100,000 population) of invasive meningococcal disease in Canada by age group, 2015 to 2019 (n=605)
- Figure 13: Number and incidence rate (per 100,000 population) of reported mumps cases in Canada by year, 1950 to 2019
- Figure 14: Total number and overall incidence rates (per 100,000 population) of reported mumps cases by age group, 2015 to 2019 (n=3,671)
- Figure 15: Number and incidence rate (per 100,000 population) of reported pertussis cases in Canada by year, 1938 to 2019
- Figure 16: Total number and overall incidence rates (per 100,000 population) of reported pertussis cases in Canada, by age group, 2015 to 2019 (n=14,646)
- Figure 17: Number and incidence rate (per 100,000 population) of reported IPD cases in Canada, by year, 2001 to 2019
- Figure 18: Annual incidence rate of IPD among age <2 and age 65 and up, 2001 to 2019
- Figure 19: Total number and overall incidence rate (per 100,000 population) of reported invasive pneumococcal disease cases in Canada by age group, 2015 to 2019 (n=17,763)
- Figure 20: Number and incidence rate (per 100,000 population) of reported varicella cases in Canada by year, 1991 to 2019
- Figure 21: Total number and overall incidence rate (per 100,000 population) of reported varicella cases in Canada by age group, 2015 to 2019 (n=2,366)
- Figure 22: Annual number of pediatric varicella hospitalizations in Canada reported through IMPACT, 1999 to 2019
Abbreviations
- AFP
- Acute flaccid paralysis
- AFM
- Acute flaccid myelitis
- CAFPSS
- Canadian Acute Flaccid Paralysis Surveillance System
- CIRID
- Centre for Immunization and Respiratory Infectious Diseases
- CMRSS
- Canadian Measles and Rubella Surveillance System
- cNICS
- Childhood National Immunization Coverage Survey
- CNDSS
- Canadian Notifiable Disease Surveillance System
- CPS
- Canadian Pediatric Society
- CRI
- Congenital rubella infection
- CRS
- Congenital rubella syndrome
- eIMDSS
- Enhanced Invasive Meningococcal Disease Surveillance System
- Hib
- Haemophilus influenzae type b
- IMD
- Invasive meningococcal disease
- IMPACT
- Immunization Monitoring Program ACTive
- IPD
- Invasive pneumococcal disease
- IPV
- Inactivated poliomyelitis vaccine
- NACI
- National Advisory Committee on Immunization
- OPV
- Oral polio vaccine
- NML
- National Microbiology Laboratory
- PAHO
- Pan-American Health Organization
- PHAC
- Public Health Agency of Canada
- Tdap
- Tetanus, diphtheria, pertussis vaccine
- VPDs
- Vaccine preventable diseases
- WHO
- World Health Organization
- WPV
- Wild-type poliovirus
Executive summary
Introduction
Disease prevention is a core function of public health. Many common infectious diseases that were once a major cause of morbidity and mortality in Canada are now preventable with vaccines. Nevertheless, vaccine preventable diseases (VPDs) remain a public health concern in Canada, and it is important to achieve the highest possible levels of vaccination. As part of the National Immunization Strategy for 2016-2021, vaccine coverage goals and VPD reduction targets by 2025 were set. The Vaccine Preventable Disease in Canada: Surveillance Report to December 31, 2019 summarizes the overall trends of 12 nationally notifiable VPDs for which publicly-funded routine vaccination programs are in place in all provinces and territories with a focus on the epidemiology of the VPDs for the most recent five-year period (2015 to 2019). This report supports the Government of Canada's international commitment to report on disease elimination and eradication initiatives and it provides evidence to inform vaccination programs and policy.
Consistent with the structure of the VPD Reduction Targets by 2025, each VPD was placed into one of three categories: VPDs under elimination in CanadaFootnote 1, VPDs with low-level incidenceFootnote 2, and VPDs with moderate-level incidenceFootnote 3. The findings for each of these categories are summarized below.
Key findings
VPDs under elimination Footnote a
Canada has maintained elimination status for measles, rubella, congenital rubella syndrome/congenital rubella infection (CRS/CRI), and polio. Based on surveillance data from 2015 to 2019, there were zero endemic cases of measles and rubella, along with zero cases of CRS/CRI and polio, resulting in Canada being on track to meet national VPD reduction targets for these diseases by 2025. Although vaccination coverage rates were fairly high among children two years of age for measles (90%), rubella (89%) and polio (92%), they remained below the 95% national vaccine coverage goal for these diseases.
VPDs with low-level incidenceFootnote b
Based on surveillance data from 2015 to 2019, Canada is on track to meet national VPD reduction targets by 2025 for tetanus, invasive disease due to Haemophilus influenza serotype b (Hib) and invasive meningococcal disease (IMD) but not currently on track to meet the reduction target for mumps if large outbreaks continue to occur. Surveillance data is not currently available to assess progress in meeting national VPD reduction targets for respiratory diphtheria and maternal and neonatal tetanus. However, work is currently underway to estimate maternal and neonatal tetanus case counts at the national level.
Despite these low disease incidence rates, vaccine coverage rates can be improved. Rates for diphtheria (78%), tetanus (78%), Hib (74%), mumps (89%), and meningococcal C vaccine (91%) by two years of age were all below the national vaccine coverage goal of 95% for each of these diseases.
VPDs with moderate-level incidenceFootnote c
Based on surveillance data from 2015 to 2019, Canada is on track to meet the VPD reduction targets for pertussis and varicella by 2025, but not for IPD, as incidence rates in adults 65 years of age and older have not decreased by 5%. Note, however, that varicella is not reportable in all provinces and territories and there are cases that may not have been seen by a physician or have not been laboratory confirmed.
Vaccine coverage rates for pertussis (78%), IPD (84%), varicella (83%) by two years of age were all below the national vaccine coverage goal of 95% for each of these diseases. Furthermore, the vaccine coverage rate for IPD for individuals 65 years of age and older is 58%, far below the 80% coverage goal.
Concluding remarks
The findings of this report underscore the pivotal role of publicly-funded infant and childhood vaccination programs in reducing the burden of VPDs. For most VPDs, incidence rates in Canada have declined drastically since the pre-vaccine era. There is a pressing need to enhance vaccine coverage in the next few years for Canada to meet the reduction targets by 2025 and reduce the burden of VPDs in Canada.
Introduction
Vaccines are one of the greatest achievements in public health and are considered to have saved more lives in the past 50 years in Canada than any other health intervention Footnote 1,Footnote 2,Footnote 3. While infectious diseases were the leading cause of death in Canada and worldwide during the 1900s, they are now responsible for less than 5% of all deaths in Canada, thanks in part to publicly-funded vaccination programs Footnote 1,Footnote 4,Footnote 5. Furthermore, Canada has contributed to the global eradication of smallpox as well as the elimination of endemically transmitted poliomyelitis (1994), measles (1998), rubella (2005) and CRS/CRI (2000) in the Americas through strong public health initiatives, including surveillance activities and routine publicly-funded vaccination programs Footnote 4, Footnote 5, Footnote 6. As part of Canada's National Immunization Strategy for 2016-2021, vaccine coverage goals and vaccine preventable disease (VPD) reduction targets by 2025 were set in collaboration with provinces and territories and are based on international standards and best practices Footnote 7.
Despite these successes, VPDs remain a public health concern in Canada. While vaccination coverage rates are good, Canada has yet to meet most national vaccination coverage goals. Despite low rates of disease, VPDs are a considerable health burden to the population, with infections causing a variety of serious complications such as pneumonia, meningitis, encephalitis, amputations, and death. Infections due to VPDs also have substantial economic and societal costs related to missed school and work days, health care provider visits, hospitalization and rehabilitation Footnote 2,Footnote 3. Finally, despite attaining elimination status for several VPDs, the risk of an importation and possible resurgence of any of the VPDs under elimination exists so long as these diseases continue to occur in countries outside of the Americas and vaccination coverage remains suboptimal. Therefore, vaccination rates should be improved to ensure herd immunity. Moreover, surveillance and prevention of VPDs are essential to protect population health and maintain successes in health achievement.
The prevention and control of VPDs is a shared responsibility in Canada. At the federal level, the Public Health Agency of Canada (PHAC) conducts national surveillance of VPDs; provides leadership and coordination for the National Immunization Strategy; delivers public and professional education and outreach to promote vaccination acceptance and uptake; and ensures the security of vaccine supply. The National Advisory Committee on Immunization (NACI) makes recommendations for the use of vaccines in Canada. Provincial and territorial public health authorities are responsible for vaccination program decisions and implementing programs that meet their goals, policies, and strategies in light of their specific epidemiologic and financial circumstances.
The VPD national surveillance report is published biennially, with the first report published in 2017 and the second in 2019.
Objective
This report provides a description of the epidemiology of 12 nationally notifiable VPDs for which publicly-funded routine vaccination programs exist in all Canadian provinces and territories, with a highlight of the data from 2015 to 2019. This report is intended to serve the following objectives:
- To summarize the epidemiology of 12 VPDs and associated vaccination coverage in Canada.
- To provide data to measure the progress in disease reduction.
- To support the Government of Canada's international commitments to report on disease elimination and eradication initiatives.
- To provide evidence to inform vaccination programs and policy.
Methods
The 12 VPDs are grouped according to their incidence levels in Canada.
Diseases under elimination: VPDs that have domestic and international programs to reduce their disease-specific incidence to zero
- Measles
- Rubella
- CRS/CRI
- Polio
Endemic diseases with low-level incidence: VPDs that generally have an annual incidence rate of less than one case per 100,000 population
- Tetanus
- Diphtheria
- Invasive disease due to Hib
- IMD
- Mumps
Endemic disease with moderate–levels of incidence: VPDs that consistently have an annual incidence rate equal to or greater than one case per 100,000 population
- Pertussis
- IPD
- Varicella
A description of this report's data sources, types of analyses conducted, and data limitations are provided in Appendix A. In addition, the epidemiology of VPDs contained in this report should be interpreted with an awareness of available vaccination programs, populations eligible for vaccination, rates of vaccine uptake by the population, and vaccine effectiveness. Details pertaining to specific vaccines can be found in the Canadian Immunization Guide and National Advisory Committee on Immunization statements.
Only nationally notifiable VPDs are presented in this report, thus VPDs such as zoster, rotavirus gastroenteritis, and human papillomavirus infection are not included. Furthermore, information on the national epidemiology of influenza and hepatitis are covered in separate surveillance reports.
While this report presents an overview of VPDs in Canada, routine surveillance reports for many of the diseases included are published on a regular basis and are referenced throughout this report. Readers interested in more detailed data are encouraged to consult these publications.
Results
National surveillance data indicate that from 2015 to 2019, an average of 7,914 VPD cases were reported annually (Table 1) which represents an average annual crude incidence rate of 21.5 cases per 100,000 population (Table 2). The VPDs that accounted for the largest proportion of reported cases were IPD (45%) and pertussis (37%). Age groups most affected by VPDs included children less than one year of age (88.0 cases per 100,000 population), children one to four years of age (48.8 cases per 100,000 population), and children 10 to 14 years of age (40.3 cases per 100,000 population) (Figure 1). During the same period, case counts were highest among those 60 years of age and older (n=9,993 cases) and 40 to 59 years of age (n=7,621 cases). The most affected age groups varied by disease, with some diseases such as pertussis, varicella, and IMD having a greater incidence in young children, while incidence was highest in the elderly for IPD and in adolescents/young adults for mumps.
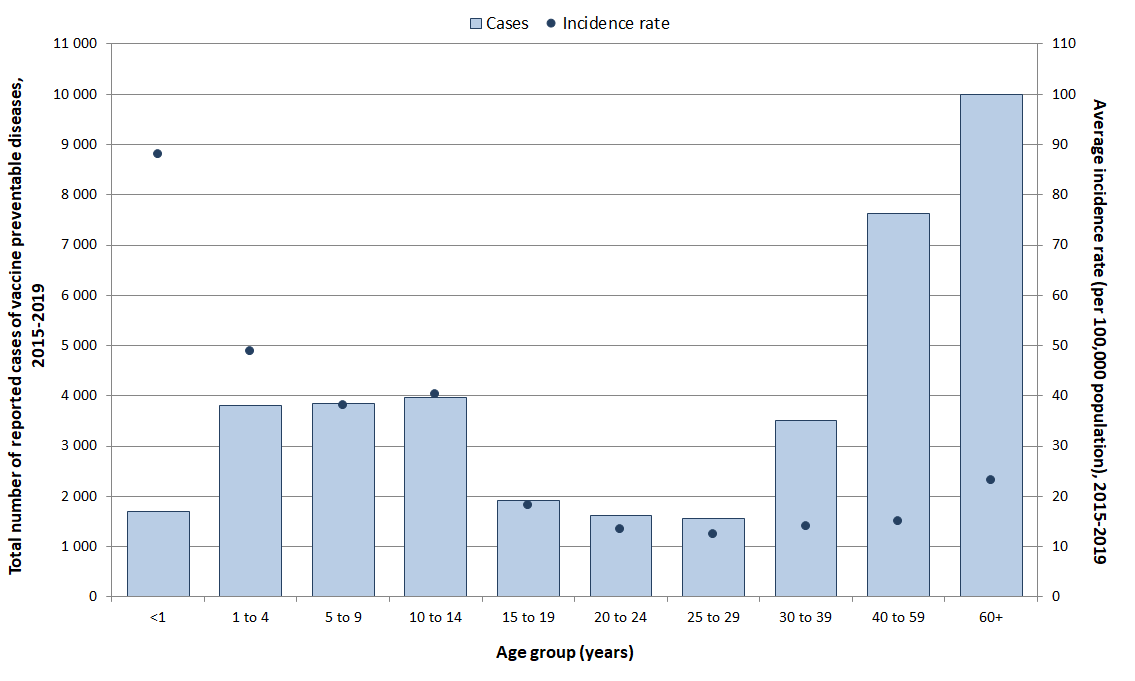
Figure 1: Text equivalent
| Age groups | Total number of cases | Overall incidence rate (per 100,000 population) |
|---|---|---|
| <1 | 1,690 | 87.9 |
| 1 to 4 | 3,806 | 48.8 |
| 5 to 9 | 3,848 | 38.1 |
| 10 to 14 | 3,964 | 40.3 |
| 15 to 19 | 1,919 | 18.1 |
| 20 to 24 | 1,624 | 13.4 |
| 25 to 29 | 1,565 | 12.3 |
| 30 to 39 | 3,516 | 14.0 |
| 40 to 59 | 7,621 | 15.0 |
| 60+ | 9,993 | 23.2 |
| Age group (Years) | Measles | Rubella | CRS/CRI | Polio | Tetanus | Diphtheria | Hib | Mumps | IMD | Varicella | IPD | Pertussis | Overall |
|---|---|---|---|---|---|---|---|---|---|---|---|---|---|
| < 1 | 4.2 (0-7) | 0 | 0.2 (0-1) | 0 | 0 | 0.2 (0-1) | 3.2 (0-5) | 3.6 (0-10) | 12.2 (6-17) | 26.6 (14-40) | 53.6 (45-60) | 234.2 (132-317) | 338.2 (243 - 419) |
| 1 to 4 | 8.0 (2-18) | 0 | N/A | 0 | 0.2 (0-1) | 0.4 (0-1) | 2.8 (1-5) | 18.6 (2-53) | 12.8 (8-16) | 45.8 (23-75) | 180.8 (151-197) | 491.8 (269-660) | 761.2 (430 - 939) |
| 5 to 9 | 11.6 (0-35) | 0 | 0 | 0.2 (0-1) | 1 (0-3) | 0.4 (0-2) | 41.2 (0-135) | 2.6 (1-4) | 68.4 (20-141) | 73.2 (71-76) | 571.0 (274-788) | 769.6 (430 - 985) | |
| 10 to 14 | 14.6 (0-55) | 0 | 0 | 0 | 0.6 (0-2) | 0.2 (0-1) | 52.0 (2-187) | 2.6 (2-4) | 83.6 (38-162) | 23.8 (23-25) | 615.2 (259-837) | 792.8 (386 - 1009) | |
| 15 to 19 | 11.6 (0-39) | 0 | 0 | 0 | 0 | 0.2 (0-1) | 96.0 (16-311) | 12.2 (10-15) | 53.3 (35-78) | 30.0 (25-36) | 180.4 (79-247) | 383.8 (239 - 622) | |
| 20 to 24 | 7.2 (1-15) | 0 | 0 | 0.2 (0-1) | 0.2 (0-1) | 0 | 122.2 (11-335) | 11 (6-19) | 47.2 (32-68) | 45.2 (35-54) | 91.6 (44-130) | 324.8 (221 - 545) | |
| 25 to 29 | 6.0 (0-11) | 0 | 0 | 0.2 (0-1) | 0.2 (0-1) | 0.8 (0-2) | 113.4 (9-352) | 4.6 (2-10) | 35.2 (31-38) | 73.2 (64-93) | 79.4 (45-112) | 313.0 (212 - 560) | |
| 30 to 39 | 8.0 (0-14) | 0 | 0 | 0.8 (0-2) | 0.4 (0-1) | 1.6 (0-3) | 149.4 (5-482) | 7.6 (5-11) | 52.4 (34-63) | 263.0 (216-312) | 220.0 (114-307) | 703.2 (574 - 1057) | |
| 40 to 59 | 7.2 (1-16) | 0.4 (0-1) | 0 | 1.0 (0-2) | 1.4 (0-3) | 3.0 (0-7) | 123.2 (9-363) | 20.0 (13-33) | 43.6 (38-58) | 986.2 (909-1163) | 338.2 (174-442) | 1524.2 (1392 - 1746) | |
| ≥ 60 | 0.4 (0-2) | 0 | 0 | 0.8 (0-2) | 0.6 (0-1) | 3.8 (1-5) | 14.4 (2-38) | 35.2 (26-45) | 16.8 (12-20) | 1820.8 (1638-2065) | 105.8 (54-137) | 1998.6 (1809 - 1809) | |
| Unspecified | 0 | 0 | 0 | 0 | 0 | 0 | 0 | 0.2 (0-1) | 0.4 (0-1) | 2.8 (0-13) | 1.6 (0-4) | 5.0 (0 - 13) | |
| All ages | 78.8 (11-196) | 0.4 (0-1) | 0 | 3.6 (1-5) | 5.0 (1-10) | 16 (11-27) | 733.4 (59-2266) | 121.0 (99-141) | 473.2 (311-695) | 3552.6 (3211-4026) | 2929.2 (1467-3951) | 7914.0 (6775 - 9837) |
| Age group (Years) | Measles | Rubella | CRS/CRI | Polio | Tetanus | Diphtheria | Hib | Mumps | IMD | Varicella | IPD | Pertussis | Overall |
|---|---|---|---|---|---|---|---|---|---|---|---|---|---|
| < 1 | 1.1 (0-1.8) | 0 | 0.1 (0-0.3) | 0 | 0 | 0.1 (0.0-0.3) | 0.8 (0.0-1.3) | 0.9 (0.3-2.6) | 3.2 (1.5-4.9) | 6.9 (3.6-10.6) | 13.9 (11.8-15.4) | 60.7 (34.8-81.4) | 87.9 (64.1 - 107.5) |
| 1 to 4 | 0.5 (0.1-1.2) | 0 | N/A | 0 | <0.05 (0-0.1) | <0.05 (0.0-0.1) | 0.2 (0.1-0.3) | 1.2 (0.1-3.4) | 0.8 (0.5-1) | 2.9 (1.5-4.8) | 11.6 (9.7-12.6) | 31.5 (17.2-42.3) | 48.8 (33.8 - 60.2) |
| 5 to 9 | 0.6 (0-1.8) | 0 | 0 | <0.05 (0-0.1) | <0.05 (0.0-0.1) | <0.05 (0-0.1) | 2.0 (0-6.7) | 0.1 (0.0-0.2) | 3.4 (1.0-7.1) | 3.6 (3.5-3.8) | 28.4 (13.5-39.2) | 38.1 (21.1 - 49.1) | |
| 10 to 14 | 0.8 (0-2.9) | 0 | 0 | 0 | <0.05 (0.0-0.1) | <0.05 (0-0.1) | 2.6 (0.1-9.5) | 0.1 (0.1-0.2) | 4.3 (1.9-8.5) | 1.2 (1.1-1.2) | 31.5 (12.9-43.3) | 40.3 (19.3 - 52.4) | |
| 15 to 19 | 0.5 (0-1.9) | 0 | 0 | <0.05 (0-0.0) | 0 | <0.05 (0-0.0) | 4.5 (0.7-14.7) | 0.6 (0.5-0.7) | 2.5 (1.6-3.7) | 1.4 (1.2-1.7) | 8.5 (3.7-11.7) | 18.1 (11.2 - 29.4) | |
| 20 to 24 | 0.3 (0.0-0.6) | 0 | 0 | <0.05 (0-0.0) | <0.05 (0.0-0.0) | 0 | 5.0 (0.5-13.9) | 0.5 (0.3-0.8) | 1.9 (1.3-2.7) | 1.9 (1.5-2.3) | 3.8 (1.8-5.4) | 13.4 (8.9 - 22.6) | |
| 25 to 29 | 0.2 (0-0.4) | 0 | 0 | <0.05 (0-0.0) | <0.05 (0.0-0.0) | <0.05 (0-0.1) | 4.5 (0.4-13.9) | 0.2 (0.1-0.4) | 1.4 (1.3-1.5) | 2.9 (2.6-3.6) | 3.2 (1.7-4.5) | 12.3 (8.0 - 22.1) | |
| 30 to 39 | 0.2 (0-0.3) | 0 | 0 | <0.05 (0-0.0) | <0.05 (0.0-0.0) | <0.05 (0.0-0.1) | 3.0 (0.4-9.6) | 0.1 (0.1-0.2) | 1.0 (0.7-1.3) | 5.2 (4.5-6.0) | 4.4 (2.2-6.2) | 14.0 (11.4 - 21.1) | |
| 40 to 59 | 0.1 (0.0-0.2) | <0.05 (0-0.0) | 0 | <0.05 (0-0.0) | <0.05 (0.0-0.0) | <0.05 (0-0.1) | 1.2 (0.1-3.6) | 0.2 (0.1-0.3) | 0.4 (0.4-0.6) | 9.7 (8.9-11.5) | 3.3 (1.7-4.3) | 15.0 (13.8 - 17.2) | |
| ≥ 60 | <0.05 (0-0.0) | 0 | 0 | <0.05 (0-0.0) | <0.05 (0.0-0.0) | <0.05 (0.0-0.1) | 0.2 (0-0.4) | 0.4 (0.3-0.5) | 0.2 (0.1-0.2) | 21.1 (19.8-23.2) | 1.2 (0.6-1.6) | 23.2 (22.3 - 24.7) | |
| Unspecified | 0 | 0 | 0 | 0 | 0 | No data | No data | No data | No data | No data | No data | No data | |
| All ages | 0.2 (0.0-0.5) | <0.05 (0.0-0.0) | 0 | <0.05 (0.0-0.0) | <0.05 (0.0-0.0) | <0.05 (0.0-0.1) | 2.0 (0.2-6.2) | 0.3 (0.3-0.4) | 2.0 (0.9-3.5) | 9.7 (9.0-10.8) | 8.0 (3.9-10.9) | 21.5 (17.9 - 26.8) |
Note: For summary purposes, incidence rates are indicated with one decimal. Therefore, when incidence rates are lower than 0.05 per 100,000 population, it is indicated as such. Incidence rates for all ages are detailed in each VPD section.
Vaccine preventable diseases under elimination in Canada
Measles
Key points:
- With routine vaccination, the incidence of measles in Canada has declined by over 99% from an average incidence rate of 373.3 cases per 100,000 population in the pre-vaccine era to 0.2 cases per 100,000 population from 2015 to 2019.
- Canada continues to maintain its measles elimination status and is on track to meet the reduction target of zero endemic measles cases by 2025; however, reported outbreaks of measles due to imported cases continue to occur, illustrating the need to remain vigilant until measles is eradicated worldwide.
- Vaccination rates should be improved to reach 95% coverage for herd immunity. Based on the 2019 childhood National Immunization Coverage Survey (cNICS), 90% of children in Canada received the recommended dose of measles-containing vaccine by two years of age and 83% received the recommended doses by seven years of age.
A measles-containing vaccine was made available in Canada in 1963 and routine vaccination programs were in place in all provinces and territories by 1970 Footnote 8,Footnote 9. In 1996/1997, all provinces and territories added a second dose of measles-containing vaccine to their routine schedules Footnote 10. Before measles-containing vaccine became available, many thousands of measles cases were reported annually and large outbreaks occurred in two to five-year cycles. With routine vaccination, the incidence of measles has declined by over 99% from an average incidence rate of 373.3 cases per 100,000 population in the pre-vaccine era (1950 to 1954)Footnote e to 0.2 cases per 100,000 population from 2015 to 2019 (Figure 2). Nonetheless, imported cases continue to occur in Canada and have resulted in secondary spread and measles outbreaks. For updated information on measles activities in Canada, refer to Measles and Rubella Weekly Reports and for more information in the Americas, refer to the PAHO Epidemiological Alerts and Updates.
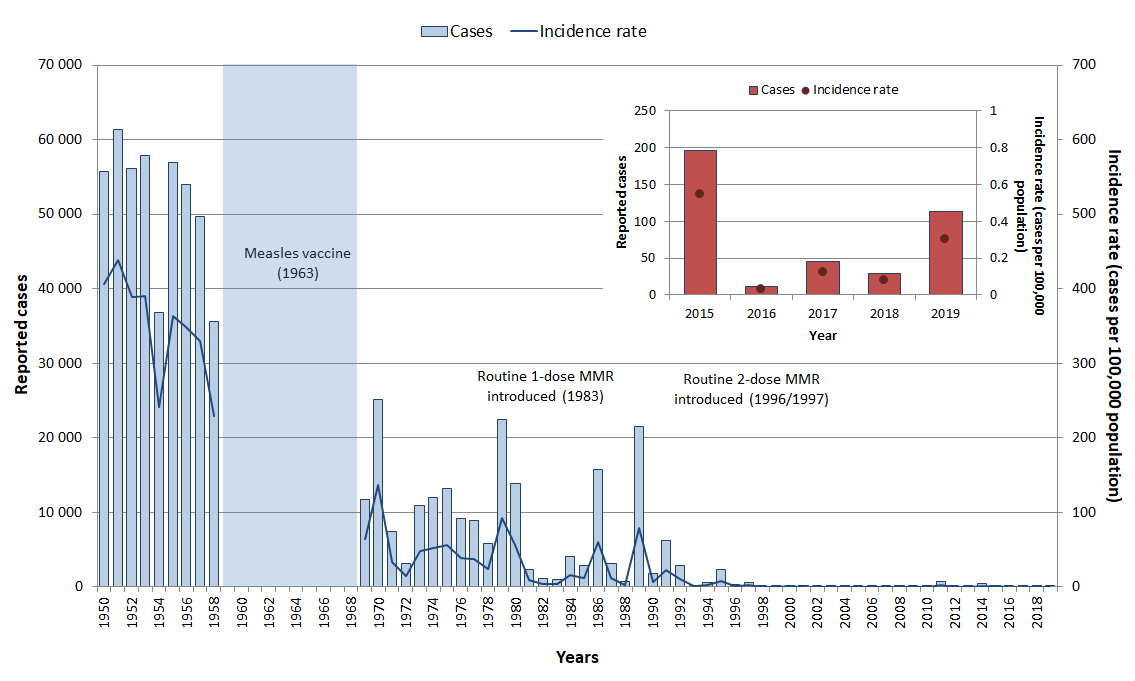
Figure 2: Text equivalent
| Year | Cases | Incidence rate (per 100,000 population) |
|---|---|---|
| 1950 | 55,653 | 406.6 |
| 1951 | 61,370 | 438.8 |
| 1952 | 56,178 | 389.2 |
| 1953 | 57,871 | 390.5 |
| 1954 | 36,850 | 241.5 |
| 1955 | 56,922 | 363.3 |
| 1956 | 53,986 | 348.1 |
| 1957 | 49,712 | 330.3 |
| 1958 | 35,531 | 229.3 |
| 1959 | No data | No data |
| 1960 | No data | No data |
| 1961 | No data | No data |
| 1962 | No data | No data |
| 1963 | No data | No data |
| 1964 | No data | No data |
| 1965 | No data | No data |
| 1966 | No data | No data |
| 1967 | No data | No data |
| 1968 | No data | No data |
| 1969 | 11,720 | 64.4 |
| 1970 | 25,137 | 136.4 |
| 1971 | 7,439 | 33.8 |
| 1972 | 3,136 | 14.1 |
| 1973 | 10,911 | 48.3 |
| 1974 | 11,985 | 52.3 |
| 1975 | 13,143 | 56.6 |
| 1976 | 9,158 | 38.9 |
| 1977 | 8,832 | 37.1 |
| 1978 | 5,858 | 24.4 |
| 1979 | 22,444 | 92.4 |
| 1980 | 13,864 | 56.3 |
| 1981 | 2,307 | 9.3 |
| 1982 | 1,064 | 4.2 |
| 1983 | 934 | 3.7 |
| 1984 | 4,086 | 15.9 |
| 1985 | 2,899 | 11.2 |
| 1986 | 15,796 | 60.3 |
| 1987 | 3,065 | 11.5 |
| 1988 | 710 | 2.6 |
| 1989 | 21,523 | 78.5 |
| 1990 | 1,738 | 6.3 |
| 1991 | 6,151 | 21.9 |
| 1992 | 2,915 | 10.2 |
| 1993 | 192 | 0.7 |
| 1994 | 517 | 1.8 |
| 1995 | 2,366 | 8.0 |
| 1996 | 328 | 1.1 |
| 1997 | 531 | 1.8 |
| 1998 | 17 | 0.1 |
| 1999 | 32 | 0.1 |
| 2000 | 207 | 0.7 |
| 2001 | 38 | 0.1 |
| 2002 | 9 | <0.1 |
| 2003 | 17 | 0.1 |
| 2004 | 9 | <0.1 |
| 2005 | 8 | <0.1 |
| 2006 | 13 | <0.1 |
| 2007 | 101 | 0.3 |
| 2008 | 61 | 0.2 |
| 2009 | 14 | <0.1 |
| 2010 | 99 | 0.3 |
| 2011 | 752 | 2.2 |
| 2012 | 10 | <0.1 |
| 2013 | 83 | 0.2 |
| 2014 | 418 | 1.2 |
| 2015 | 196 | 0.5 |
| 2016 | 11 | <0.1 |
| 2017 | 45 | 0.1 |
| 2018 | 29 | 0.1 |
| 2019 | 113 | 0.3 |
Epidemiology between 2015 and 2019
From 2015 to 2019, a total of 394 measles cases were reported in Canada through the Canadian Measles and Rubella Surveillance System. An average of 79 cases per year (range: 11 to 196) was reported, with the average incidence rate of 0.22 case per 100,000 population (range: 0.03 to 0.55) (Figure 2). Of these cases, 88 (22%) were imported to Canada and 278 (71%) were due to subsequent transmissions in Canada (i.e., were exposed in Canada and could be linked to a confirmed measles case). The source of infection (i.e., a link to another measles case) or location of exposure (i.e., acquired in Canada or abroad) could not be determined for 28 cases (7%). Sixty-four (16%) cases were hospitalized. Although cases were reported in every age group and the most affected age group varied from year to year depending on the outbreak context, for the period as a whole, the highest incidence rates were reported in infants under the age of one (1.1 cases per 100,000 population), followed by 10 to 14 years of age (0.7 cases per 100,000 population) (Figure 3). Cases were relatively evenly distributed between male and female.
Twenty-three outbreaks were reported during the surveillance period with the largest one reported in 2015. In this 2015 outbreak, the index case was exposed to measles during travel to a popular theme park in California. The outbreak resulted in 159 cases in Canada with most of the secondary transmission occurring in a non-immunizing religious community to which the index case belonged. Genotype B3 was associated with this outbreak. In 2017, a multi-jurisdictional outbreak was reported across Nova Scotia, Newfoundland and Labrador, Ontario, New Brunswick and Alberta. The outbreak resulted in 29 cases in a variety of settings including air travel/airport, healthcare, social, school and community settings. This outbreak provided the first evidence in Canada of measles transmission in domestic air travel. The genotype associated with this outbreak was D8. Based on the data for this period, Canada is on track to meet its VPD reduction target of zero endemic cases of measles by 2025. In June 2021, Canada re-certified its elimination status to measles, rubella and CRS for years 2016-2020.

Figure 3: Text equivalent
| Age groups | Total number of cases | Incidence rate (per 100,000 population) |
|---|---|---|
| < 1 | 21 | 1.1 |
| 1 to 4 | 40 | 0.5 |
| 5 to 9 | 58 | 0.6 |
| 10 to 14 | 73 | 0.7 |
| 15 to 19 | 58 | 0.6 |
| 20 to 24 | 36 | 0.3 |
| 25 to 29 | 30 | 0.2 |
| 30 to 39 | 40 | 0.2 |
| 40 to 59 | 36 | 0.1 |
| ≥ 60 | 2 | <0.1 |
Measles vaccination coverage
Based on the 2019 cNICS, 90% of children in Canada received the recommended dose of measles-containing vaccine by two years of age and 83% received the recommended doses by seven years of age Footnote 11. This is below the 95% vaccination coverage goals for receiving one dose of a measles-containing vaccine by two years of age and two doses by seven years of age.
Further reading
- PHAC measles webpage
- Canadian Immunization Guide measles vaccine chapter
- National Advisory Committee on Immunization measles vaccine guidance
- Measles annual reports: 2019 report, 2018 report, 2017 report and 2016 report
- Measles and Rubella Weekly Monitoring Reports
- Vaccination Coverage Goals and Vaccine Preventable Disease Reduction Targets by 2025
Rubella
Key points:
- With routine vaccination, the incidence of rubella in Canada has declined by over 99% from an average incidence rate of 107.2 cases per 100,000 population in the pre-vaccine era to 0.001 cases per 100,000 population from 2015 to 2019.
- While two cases of rubella were reported between 2015 and 2019 (one was imported), none resulted in secondary transmission within Canada, thus maintaining Canada's rubella elimination status. Canada is on track to meet the disease reduction target of zero endemic rubella cases by 2025.
- Vaccination coverage by two years of age should be improved to reach the national goal of 95%. Based on the 2019 cNICS, 89% of children in Canada received the recommended dose of rubella-containing vaccine by two years of age and 96% received the recommended doses by seven years of ageFootnote g.
A rubella-containing vaccine was made available in Canada in 1969 and routine vaccination programs were in place across all provinces and territories by 1983 Footnote 10,Footnote 12 . Before the rubella-containing vaccine became available, many thousands of rubella cases were reported annually and outbreaks occurred in three to six-year cycles. With routine vaccination, the incidence of rubella has declined by over 99% from an average incidence rate of 107.2 cases per 100,000 population in the pre-vaccine era (1950 to 1954)Footnote h to 0.001 cases per 100,000 population from 2015 to 2019 (Figure 4). Because imported cases continue to occur, there is still a risk of secondary spread to Canadians who remain vulnerable due to inadequate vaccination. Ongoing vigilance is required as a result. More recent data on rubella can be found in the Measles and Rubella Weekly Monitoring Reports.
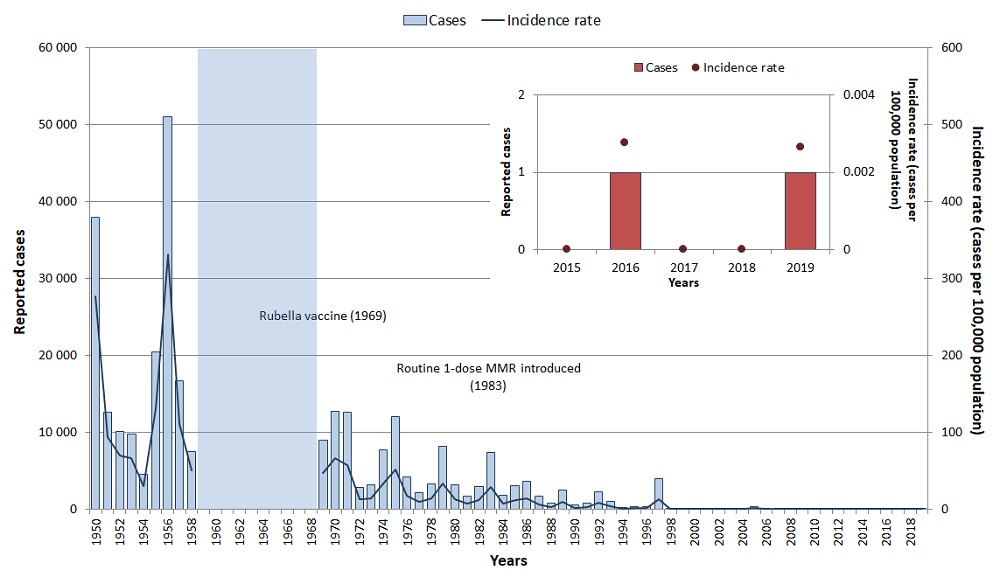
Figure 4: Text equivalent
| Year | Cases | Incidence rate (per 100,000 population) |
|---|---|---|
| 1950 | 37,917 | 277.0 |
| 1951 | 12,624 | 93.7 |
| 1952 | 10,116 | 70.1 |
| 1953 | 9,745 | 65.8 |
| 1954 | 4,468 | 29.5 |
| 1955 | 20,409 | 131.1 |
| 1956 | 51,036 | 331.2 |
| 1957 | 16,652 | 110.6 |
| 1958 | 7,431 | 50.3 |
| 1959 | No data | No data |
| 1960 | No data | No data |
| 1961 | No data | No data |
| 1962 | No data | No data |
| 1963 | No data | No data |
| 1964 | No data | No data |
| 1965 | No data | No data |
| 1966 | No data | No data |
| 1967 | No data | No data |
| 1968 | No data | No data |
| 1969 | 8,934 | 47.4 |
| 1970 | 12,710 | 66.7 |
| 1971 | 12,567 | 57.5 |
| 1972 | 2,808 | 12.7 |
| 1973 | 3,189 | 14.3 |
| 1974 | 7,732 | 34.1 |
| 1975 | 12,032 | 52.3 |
| 1976 | 4,167 | 17.9 |
| 1977 | 2,159 | 9.1 |
| 1978 | 3,270 | 13.7 |
| 1979 | 8,201 | 33.9 |
| 1980 | 3,138 | 12.8 |
| 1981 | 1,719 | 6.9 |
| 1982 | 2,973 | 11.8 |
| 1983 | 7,420 | 29.2 |
| 1984 | 1,831 | 7.1 |
| 1985 | 2,989 | 11.5 |
| 1986 | 3,570 | 13.6 |
| 1987 | 1,634 | 6.2 |
| 1988 | 801 | 3.0 |
| 1989 | 2,440 | 8.9 |
| 1990 | 506 | 1.8 |
| 1991 | 765 | 2.7 |
| 1992 | 2,201 | 7.7 |
| 1993 | 1,018 | 3.5 |
| 1994 | 241 | 0.8 |
| 1995 | 287 | 1.0 |
| 1996 | 272 | 0.9 |
| 1997 | 4,003 | 13.3 |
| 1998 | 63 | 0.2 |
| 1999 | 24 | 0.1 |
| 2000 | 29 | 0.1 |
| 2001 | 27 | 0.1 |
| 2002 | 15 | <0.1 |
| 2003 | 14 | <0.1 |
| 2004 | 9 | <0.1 |
| 2005 | 319 | 1.0 |
| 2006 | 9 | <0.1 |
| 2007 | 8 | <0.1 |
| 2008 | 5 | <0.1 |
| 2009 | 7 | <0.1 |
| 2010 | 13 | <0.1 |
| 2011 | 2 | <0.1 |
| 2012 | 2 | <0.1 |
| 2013 | 1 | <0.1 |
| 2014 | 1 | <0.1 |
| 2015 | 0 | <0.1 |
| 2016 | 1 | <0.1 |
| 2017 | 0 | <0.1 |
| 2018 | 0 | <0.1 |
| 2019 | 1 | <0.1 |
Epidemiology between 2015 and 2019
As rubella has been eliminated in Canada, disease activity generally results from imported cases. From 2015 to 2019, a total of two rubella cases were reported (Figure 4). The average incidence rate was 0.001 cases per 100,000 population for this period. Both cases were in adults between 40 and 59 years of age and neither of them were hospitalized. One case was imported and the other one had no recent travel history. Based on the data for this period, Canada is on track to meet its disease reduction target of zero endemic rubella cases by 2025.
Rubella vaccination coverage
Based on the 2019 cNICS, 89% of children in Canada received the recommended one dose of rubella-containing vaccine by two years of age, which falls below the 95% vaccine coverage goal. However, 96% received the recommended one dose by seven years of age, which meets the national coverage goal of 95% Footnote 11. In seroprevalence studies of cohorts of pregnant women in Canada, from 2006 to 2012, the percentage of study participants immune to rubella ranged from 84% to 92% Footnote 13,Footnote 14,Footnote 15.
Further reading
- PHAC rubella and CRS webpage
- Canadian Immunization Guide rubella vaccine chapter
- National Advisory Committee on Immunization rubella vaccine guidance
- Measles and Rubella Weekly Monitoring Reports
- Vaccination Coverage Goals and Vaccine Preventable Disease Reduction Targets by 2025
Congenital rubella syndrome (CRS) and congenital rubella infection (CRI)
Key points:
- With routine vaccination, the incidence of CRS/CRI in Canada has declined by 98% from an average annual incidence rate of 3.0 cases per 100,000 live births in the pre-vaccine era to 0.1 cases per 100,000 live births from 2015 to 2019.
- There have been no reported cases of CRS/CRI due to a rubella exposure in Canada since 2000. Thus Canada's elimination status for CRS/CRI is maintained.
- Canada is on track to meet the disease reduction target of zero CRS/CRI cases by 2025.
With routine rubella vaccination, CRS/CRI has declined by 98%. The average incidence rate of CRS/CRI decreased from 3.0 cases per 100,000 live births in the pre-vaccine era (1950 to 1954)Footnote j to 0.1 cases per 100,000 live births from 2015 to 2019. More recent data on CRS/CRI can be found in the Measles and Rubella Weekly Monitoring Reports.
Epidemiology between 2015 and 2019
From 2015 to 2019, one case of CRS/CRI was reported in Canada in 2015, resulting in an incidence rate of 0.3 cases per 100,000 live births for that year. The case was hospitalized and was due to maternal exposure to rubella outside of Canada. There have been no reported cases of CRS/CRI due to rubella exposure within Canada since 2000. This indicates that Canada is on track to meet its disease reduction target of zero cases of CRS/CRI by year 2025.
Rubella vaccination coverage
CRS/CRI can be prevented by ensuring that women of childbearing age are vaccinated against rubella. Currently, no vaccine coverage estimates are available for this group. In recent seroprevalence studies of cohorts of pregnant women in Canada, from 2006 to 2012, the percentage of study participants immune to rubella ranged from 84% to 92% Footnote 13,Footnote 14,Footnote 15.
Further reading
- PHAC rubella and CRS webpage
- Canadian Immunization Guide rubella vaccine chapter
- National Advisory Committee on Immunization rubella vaccine guidance
- Measles and Rubella Weekly Monitoring Reports
- Vaccination Coverage Goals and Vaccine Preventable Disease Reduction Targets by 2025
Polio and acute flaccid paralysis (AFP)
Key points:
- With routine vaccination, endemic polio has been eliminated in Canada. Incidence has declined from an average annual incidence rate of 17.5 cases per 100,000 population in the pre-vaccine era to zero cases reported from 2015 to 2019. Therefore, Canada is on track to meet its reduction target of zero cases of polio by 2025.
- Until polio eradication has been achieved globally, active surveillance of acute flaccid paralysis (AFP) remains critical given the continued risk of polio importation.
- Vaccination rates should be improved to reach the national goal of 95%. Based on the 2019 cNICS, 92% of children in Canada received the recommended doses of polio-containing vaccine by two years of age.
Polio vaccine was introduced in Canada in 1955. Vaccine programs switched from oral poliovirus vaccine (OPV) to inactivated poliomyelitis vaccines (IPV) exclusively in 1995/1996. Although Canada was certified polio-free in 1994, surveillance of poliomyelitis through systems monitoring for polio-like illness is essential due to the risk of importation from polio-endemic regions, vaccine-derived poliovirus importation from countries using the OPV and the existence of non-immunized populations in Canada. Between 2004 and 2012 in Canada, four cases of Sabin-derived poliovirus were detected in infants who had travelled to and were vaccinated in countries using OPV Footnote 6. During the 1950s, the incidence of polio in Canada was dramatically reduced with the introduction of vaccination programs. The average incidence rate of polio decreased from 17.5 cases per 100,000 population in the pre-vaccine era (1950 to 1954)Footnote k to zero from 2015 to 2019 (Figure 5). Based on data for this period, Canada is on track to meet its disease reduction target of zero cases of polio by 2025.
Active surveillance remains critical until global polio eradication has been achieved. As of 2019, polio continues to be endemic in two countries around the world: Afghanistan and Pakistan Footnote 16. As recommended by the WHO, Canada conducts AFP surveillance in children and youth less than 15 years of age to monitor for polio. AFP is the acute onset of paralysis in one or more limbs and is a characteristic of polio Footnote 4. Incidence rates of AFP appear to show a cyclical pattern, with increases observed every two to five years.
AFP epidemiology between 2015 and 2019
From 2015 to 2019 in Canada, a total of 220 AFP cases were reported in children under 15 years of age. An average of 44 cases were reported annually (range: 27 to 73) with the average incidence rate of 0.7 cases per 100,000 population (range: 0.5 to 1.2) (Figure 5). Fifty-four percent of the cases were male. The highest incidence rate of AFP since 1996 was reported in 2018 (Figure 5). This spike in cases could be attributed to an increase in the number of cases of a specific type of AFP, acute flaccid myelitis (AFM) in the United States, which may have resulted in increased awareness of AFM among Canadian clinicians Footnote 17.
All cases were adjudicated against the polio case definition and none were assessed to be polio. Most reported cases were diagnosed with either Guillain-Barré syndrome (46%) or transverse myelitis (24%).
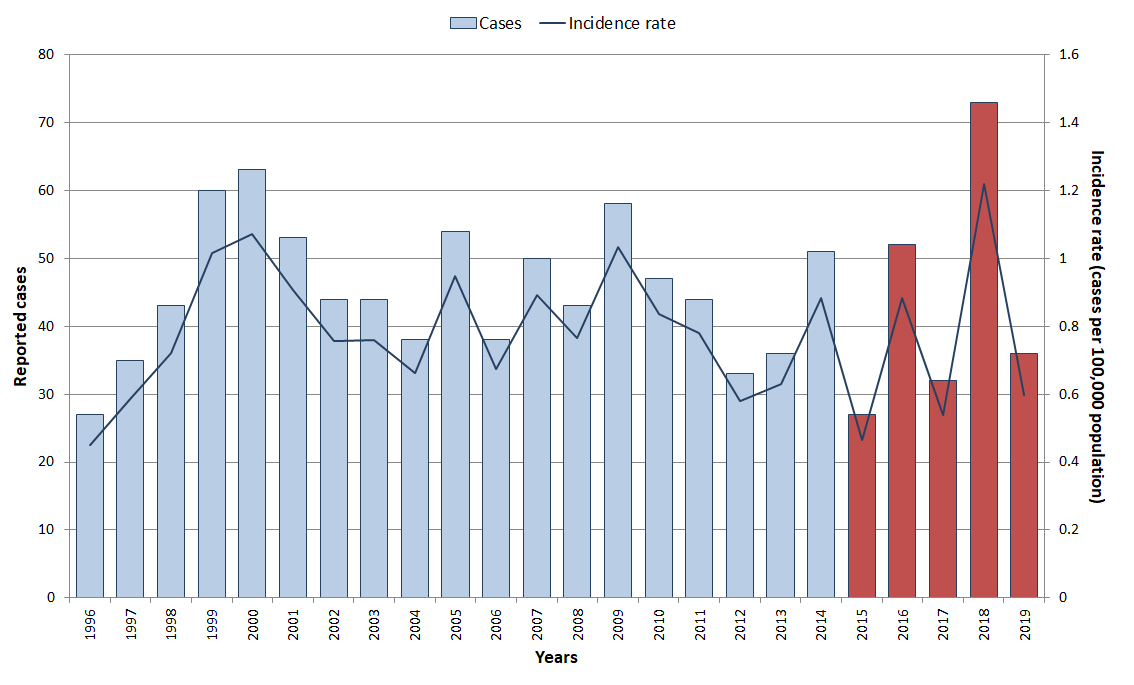
Figure 5: Text equivalent
| Year | Cases | Incidence rate (per 100,000 population) |
|---|---|---|
| 1996 | 27 | 0.5 |
| 1997 | 35 | 0.6 |
| 1998 | 43 | 0.7 |
| 1999 | 60 | 1.0 |
| 2000 | 63 | 1.1 |
| 2001 | 53 | 0.9 |
| 2002 | 44 | 0.8 |
| 2003 | 44 | 0.8 |
| 2004 | 38 | 0.7 |
| 2005 | 54 | 0.9 |
| 2006 | 38 | 0.7 |
| 2007 | 50 | 0.9 |
| 2008 | 43 | 0.8 |
| 2009 | 58 | 1.0 |
| 2010 | 47 | 0.8 |
| 2011 | 44 | 0.8 |
| 2012 | 33 | 0.6 |
| 2013 | 36 | 0.6 |
| 2014 | 50 | 0.9 |
| 2015 | 27 | 0.5 |
| 2016 | 52 | 0.9 |
| 2017 | 32 | 0.5 |
| 2018 | 72 | 1.2 |
| 2019 | 34 | 0.6 |
Polio vaccination coverage
Based on the 2019 cNICS, Canada falls slightly below the 95% national coverage goal with 92% of children in Canada receiving the recommended three doses of polio-containing vaccine by two years of age Footnote 11.
Further reading
- PHAC poliomyelitis (polio) webpage
- PHAC acute flaccid paralysis (AFP) webpage
- Canadian Immunization Guide poliomyelitis vaccine chapter
- National Advisory Committee on Immunization polio guidance
- Annual Canadian Paediatric Surveillance Program (CPSP) Report: AFP in Canada
- Global Polio Eradication Initiative
- Vaccination Coverage Goals and Vaccine Preventable Disease Reduction Targets by 2025
Summary
The average annual incidence of each of these diseases under elimination has declined by over 99% from the pre-vaccination era to the time-period 2015 to 2019. This steep decline can be largely attributed to routine vaccinations. Canada's elimination status was maintained for measles, rubella, congenital rubella syndrome/congenital rubella infection (CRS/CRI), and polio. Canada is on track to meet national VPD reduction targets for these diseases by 2025. However, improvements are necessary to achieve the 95% vaccine coverage goal as vaccine coverage for measles, rubella, and polio remains below 95% among children two years of age.
Vaccine preventable diseases with low-level incidence in Canada
Diphtheria
Key points:
- Routine vaccination has had a profound effect in reducing the incidence of diphtheria in Canada. The average annual incidence rate has declined by over 99% from 84.2 cases per 100,000 population in the pre-vaccine era to an average incidence rate of 0.01 cases per 100,000 population from 2015 to 2019.
- Surveillance data is not currently available to assess national reduction target of zero annual cases of respiratory diphtheria resulting from exposure by 2025.
- Despite the success of vaccination in reducing diphtheria disease burden, vaccination coverage rates remain low. Based on the 2019 cNICS, only 78% of children in Canada received the recommended doses of diphtheria-containing vaccine by two years of age and 78% received the recommended doses by seven years of age.
Vaccination against diphtheria has dramatically reduced its mortality and morbidity. With routine vaccination, the incidence of diphtheria has declined by over 99% from an average incidence rate of 84.2 cases per 100,000 population in the pre-vaccine era (1925 to 1929)Footnote m to 0.01 cases per 100,000 population from 2015 to 2019 (Figure 6).

Figure 6: Text equivalent
| Year | Cases | Incidence rate (per 100,000 population) |
| 1924 | 9,057 | 100.1 |
| 1925 | 7,244 | 78.8 |
| 1926 | 7,175 | 76.7 |
| 1927 | 8,501 | 89.1 |
| 1928 | 8,781 | 90.2 |
| 1929 | 9,010 | 90.0 |
| 1930 | 8,036 | 78.8 |
| 1931 | 5,914 | 57.1 |
| 1932 | 3,912 | 37.3 |
| 1933 | 2,377 | 22.4 |
| 1934 | 2,267 | 21.1 |
| 1935 | 1,999 | 18.5 |
| 1936 | 2,031 | 18.6 |
| 1937 | 2,945 | 26.7 |
| 1938 | 3,676 | 33.0 |
| 1939 | 2,897 | 25.8 |
| 1940 | 2,335 | 20.5 |
| 1941 | 2,866 | 24.9 |
| 1942 | 2,955 | 25.4 |
| 1943 | 2,804 | 23.8 |
| 1944 | 3,223 | 27.0 |
| 1945 | 2,786 | 23.1 |
| 1946 | 2,535 | 20.7 |
| 1947 | 1,550 | 12.4 |
| 1948 | 898 | 7.0 |
| 1949 | 806 | 6.2 |
| 1950 | 421 | 3.1 |
| 1951 | 253 | 1.8 |
| 1952 | 190 | 1.3 |
| 1953 | 132 | 0.9 |
| 1954 | 208 | 1.4 |
| 1955 | 139 | 0.9 |
| 1956 | 135 | 0.8 |
| 1957 | 142 | 0.9 |
| 1958 | 66 | 0.4 |
| 1959 | 38 | 0.2 |
| 1960 | 55 | 0.3 |
| 1961 | 91 | 0.5 |
| 1962 | 71 | 0.4 |
| 1963 | 75 | 0.4 |
| 1964 | 23 | 0.1 |
| 1965 | 51 | 0.3 |
| 1966 | 38 | 0.2 |
| 1967 | 41 | 0.2 |
| 1968 | 61 | 0.3 |
| 1969 | 48 | 0.2 |
| 1970 | 47 | 0.2 |
| 1971 | 75 | 0.3 |
| 1972 | 68 | 0.3 |
| 1973 | 169 | 0.7 |
| 1974 | 173 | 0.8 |
| 1975 | 103 | 0.4 |
| 1976 | 109 | 0.5 |
| 1977 | 124 | 0.5 |
| 1978 | 119 | 0.5 |
| 1979 | 84 | 0.3 |
| 1980 | 55 | 0.2 |
| 1981 | 7 | <0.1 |
| 1982 | 11 | <0.1 |
| 1983 | 11 | <0.1 |
| 1984 | 8 | <0.1 |
| 1985 | 9 | <0.1 |
| 1986 | 6 | <0.1 |
| 1987 | 4 | <0.1 |
| 1988 | 4 | <0.1 |
| 1989 | 9 | <0.1 |
| 1990 | 7 | <0.1 |
| 1991 | 5 | <0.1 |
| 1992 | 1 | <0.1 |
| 1993 | 1 | <0.1 |
| 1994 | 3 | <0.1 |
| 1995 | 2 | <0.1 |
| 1996 | 0 | <0.1 |
| 1997 | 1 | <0.1 |
| 1998 | 0 | <0.1 |
| 1999 | 1 | <0.1 |
| 2000 | 0 | <0.1 |
| 2001 | 0 | <0.1 |
| 2002 | 1 | <0.1 |
| 2003 | 1 | <0.1 |
| 2004 | 0 | <0.1 |
| 2005 | 0 | <0.1 |
| 2006 | 0 | <0.1 |
| 2007 | 3 | <0.1 |
| 2008 | 2 | <0.1 |
| 2009 | 2 | <0.1 |
| 2010 | 2 | <0.1 |
| 2011 | 1 | <0.1 |
| 2012 | 0 | <0.1 |
| 2013 | 0 | <0.1 |
| 2014 | 2 | <0.1 |
| 2015 | 2 | <0.1 |
| 2016 | 1 | <0.1 |
| 2017 | 10 | <0.1 |
| 2018 | 9 | <0.1 |
| 2019 | 3 | <0.1 |
Epidemiology between 2015 and 2019
From 2015 to 2019, a total of 25 diphtheria cases were reported in Canada and 76% of these cases occurred in 2017 and 2018. An average of five cases were reported per year (range: one to 10) with the average incidence rate of 0.014 cases per 100,000 population (range: 0.003 to 0.027 cases per 100,000 population) (Figure 6). All ages were affected, with the most cases among those 40 to 59 year of age (seven cases) and five to nine years of age (five cases). The current national case definition for diphtheria captures both respiratory and cutaneous diphtheria, with no distinction between the types of infection. Therefore, surveillance data is not available to assess the reduction target of zero annual cases of respiratory diphtheria resulting from exposure by 2025 in Canada.
Diphtheria vaccination coverage
Based on the 2019 cNICS, the 95% goal for childhood vaccine coverage has not been met: 78% of children in Canada received the recommended four doses of diphtheria-containing vaccine by two years of age and 78% received the recommended five doses by seven years of age. The 90% goal for adolescent vaccine coverage has been met as 95% received a booster dose during adolescence Footnote 11.
Further reading
- PHAC diphtheria webpage
- Canadian Immunization Guide diphtheria vaccine chapter
- National Advisory Committee on Immunization diphtheria vaccine guidance
- Vaccination Coverage Goals and Vaccine Preventable Disease Reduction Targets by 2025
Tetanus
Key points:
- With routine vaccination, the incidence of tetanus has declined by 95% from an average incidence rate of 0.2 cases per 100,000 population in the pre-vaccine era to 0.01 cases per 100,000 population from 2015 to 2019.
- Canada is on track to meet its reduction target of less than five cases of tetanus annually by 2025. Surveillance data is not currently available to assess reduction targets of zero cases of maternal/neonatal tetanus by 2025, although work is currently underway to estimate case counts at the national level.
- Vaccination rates fall below the national goal of 95% and should be improved. Based on the 2019 cNICS, 78% of children in Canada received the recommended doses of tetanus-containing vaccine by two years of age and 78% received the recommended doses by seven years of age.
Unlike other VPDs, tetanus is not transmitted from person-to-person and while cases have always been relatively rare in Canada, they are generally severe. As tetanus is not communicable, vaccination programs were introduced with a focus on individual protection instead of herd immunity and all provinces and territories had routine tetanus vaccination programs by the 1940s Footnote 10. With routine vaccination, the incidence of tetanus has declined by 95% from an average incidence rate of 0.2 cases per 100,000 population in the pre-vaccine era (1935 to 1939)Footnote n to 0.01 cases per 100,000 population from 2015 to 2019 (Figure 7).
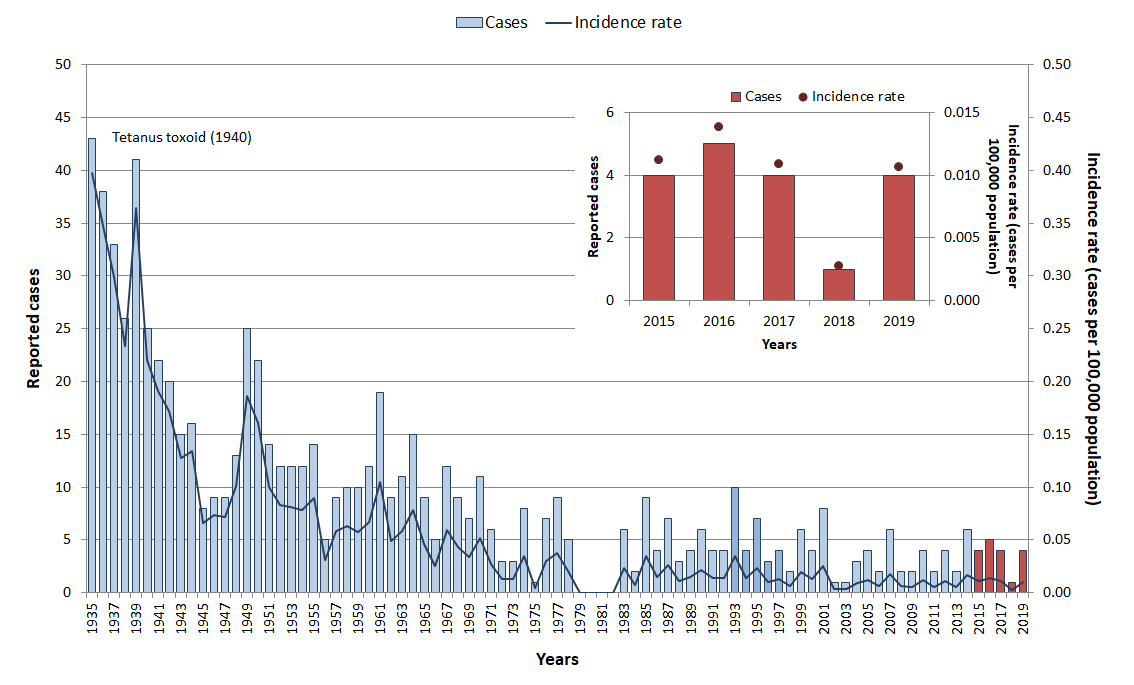
Figure 7: Text equivalent
| Year | Cases | Incidence rate (per 100,000 population) |
|---|---|---|
| 1935 | 43 | 0.4 |
| 1936 | 38 | 0.3 |
| 1937 | 33 | 0.3 |
| 1938 | 26 | 0.2 |
| 1939 | 41 | 0.4 |
| 1940 | 25 | 0.2 |
| 1941 | 22 | 0.2 |
| 1942 | 20 | 0.2 |
| 1943 | 15 | 0.1 |
| 1944 | 16 | 0.1 |
| 1945 | 8 | 0.1 |
| 1946 | 9 | 0.1 |
| 1947 | 9 | 0.1 |
| 1948 | 13 | 0.1 |
| 1949 | 25 | 0.2 |
| 1950 | 22 | 0.2 |
| 1951 | 14 | 0.1 |
| 1952 | 12 | 0.1 |
| 1953 | 12 | 0.1 |
| 1954 | 12 | 0.1 |
| 1955 | 14 | 0.1 |
| 1956 | 5 | <0.1 |
| 1957 | 9 | 0.1 |
| 1958 | 10 | 0.1 |
| 1959 | 10 | 0.1 |
| 1960 | 12 | 0.1 |
| 1961 | 19 | 0.1 |
| 1962 | 9 | <0.1 |
| 1963 | 11 | 0.1 |
| 1964 | 15 | 0.1 |
| 1965 | 9 | <0.1 |
| 1966 | 5 | <0.1 |
| 1967 | 12 | 0.1 |
| 1968 | 9 | <0.1 |
| 1969 | 7 | <0.1 |
| 1970 | 11 | 0.1 |
| 1971 | 6 | <0.1 |
| 1972 | 3 | <0.1 |
| 1973 | 3 | <0.1 |
| 1974 | 8 | <0.1 |
| 1975 | 1 | <0.1 |
| 1976 | 7 | <0.1 |
| 1977 | 9 | <0.1 |
| 1978 | 5 | <0.1 |
| 1979 | 0 | <0.1 |
| 1980 | 0 | <0.1 |
| 1981 | 0 | <0.1 |
| 1982 | 0 | <0.1 |
| 1983 | 6 | <0.1 |
| 1984 | 2 | <0.1 |
| 1985 | 9 | <0.1 |
| 1986 | 4 | <0.1 |
| 1987 | 7 | <0.1 |
| 1988 | 3 | <0.1 |
| 1989 | 4 | <0.1 |
| 1990 | 6 | <0.1 |
| 1991 | 4 | <0.1 |
| 1992 | 4 | <0.1 |
| 1993 | 10 | <0.1 |
| 1994 | 4 | <0.1 |
| 1995 | 7 | <0.1 |
| 1996 | 3 | <0.1 |
| 1997 | 4 | <0.1 |
| 1998 | 2 | <0.1 |
| 1999 | 6 | <0.1 |
| 2000 | 4 | <0.1 |
| 2001 | 8 | <0.1 |
| 2002 | 1 | <0.1 |
| 2003 | 1 | <0.1 |
| 2004 | 3 | <0.1 |
| 2005 | 4 | <0.1 |
| 2006 | 2 | <0.1 |
| 2007 | 6 | <0.1 |
| 2008 | 2 | <0.1 |
| 2009 | 2 | <0.1 |
| 2010 | 4 | <0.1 |
| 2011 | 2 | <0.1 |
| 2012 | 4 | <0.1 |
| 2013 | 2 | <0.1 |
| 2014 | 6 | <0.1 |
| 2015 | 4 | <0.1 |
| 2016 | 5 | <0.1 |
| 2017 | 4 | <0.1 |
| 2018 | 1 | <0.1 |
| 2019 | 4 | <0.1 |
Epidemiology between 2015 and 2019
From 2015 to 2019, a total of 18 cases of tetanus were reported in Canada. An average of four cases were reported per year (range: one to five) with the average incidence rate of 0.01 cases per 100,000 population (range: 0.003 to 0.014) (Figure 7). The large majority of the cases were in adults 20 years of age and older. Based on the data for this period, Canada is on track to meet its reduction target of less than five cases of tetanus annually by 2025. Maternal and neonatal tetanus was eliminated in the Region of the Americas in 2017 Footnote 18. However, surveillance data is not currently available to assess reduction targets of zero cases of maternal/neonatal tetanus in Canada by 2025. Work is currently underway to estimate maternal and neonatal tetanus case counts based on diagnostic codes from Canadian hospital databases and consultations with provincial and territorial partners.
Tetanus vaccination coverage
Based on the 2019 cNICS, only 78% of children in Canada received the recommended four doses of tetanus-containing vaccine by two years of age and only 78% received the recommended five doses by seven years of age, which is below the national vaccination coverage goal of 95% Footnote 11. Based on the 2018-2019 Seasonal Influenza Vaccine Coverage Survey, only 69% of adults received a tetanus-containing vaccine and only 58% of Canadians 65 years of age and older received the vaccine Footnote 19.
Further reading
- PHAC tetanus webpage
- Canadian Immunization Guide tetanus vaccine chapter
- National Advisory Committee on Immunization tetanus vaccine guidance
- Vaccination Coverage Goals and Vaccine Preventable Disease Reduction Targets by 2025
Invasive disease due to Haemophilus influenza serotype b (Hib)
Key points:
- With routine vaccination, the incidence of invasive disease due to Hib has declined by 99% in children less than five years of age, decreasing from an average incidence rate of 34.6 cases per 100,000 population in the pre-vaccine era to 0.3 cases per 100,000 population from 2015 to 2019.
- Based on Canada's Immunization Monitoring Program ACTive (IMPACT) data, Canada is on track to meet its disease reduction target of less than five cases of preventable Hib annually in children less than five years of age by 2025.
- Vaccine coverage remains low, particularly among infants. Based on the 2019 cNICS, only 74% of children in Canada received the recommended doses of Hib-containing vaccine by two years of age and 80% received the recommended doses by seven years of age.
Prior to the introduction of the Hib vaccine into provincial and territorial routine childhood vaccination schedules in 1988, Hib was the most common cause of bacterial meningitis in Canada Footnote 10, particularly among infants. With routine vaccination, the incidence of invasive disease due to Hib has declined by 99% in children less than five years of age, from 34.6 cases per 100,000 population in the pre-vaccine era (1986 to 1987)Footnote p to 0.3 cases per 100,000 population from 2015 to 2019. In the general population, invasive disease due to Hib has declined by 98% from 2.6 cases per 100,000 population in the pre-vaccine era (1986 to 1987) to 0.04 cases per 100,000 population from 2015 to 2019 (Figure 8). However, the average age-standardized incidence rate in northern Canada was 8.8 times higher than the rest of Canada between 2001 and 2018Footnote q.

Figure 8: Text equivalent
| Year | Cases | Incidence rate (per 100,000 population) |
| 1986 | 694 | 2.7 |
| 1987 | 670 | 2.5 |
| 1988 | 798 | 3.0 |
| 1989 | 979 | 3.6 |
| 1990 | 529 | 1.9 |
| 1991 | 353 | 1.3 |
| 1992 | 284 | 1.0 |
| 1993 | 130 | 0.5 |
| 1994 | 72 | 0.2 |
| 1995 | 62 | 0.2 |
| 1996 | 69 | 0.2 |
| 1997 | 71 | 0.2 |
| 1998 | 56 | 0.2 |
| 1999 | 21 | 0.1 |
| 2000 | 33 | 0.1 |
| 2001 | 46 | 0.1 |
| 2002 | 50 | 0.2 |
| 2003 | 44 | 0.1 |
| 2004 | 38 | 0.1 |
| 2005 | 30 | 0.1 |
| 2006 | 32 | 0.1 |
| 2007 | 27 | 0.1 |
| 2008 | 44 | 0.1 |
| 2009 | 18 | 0.1 |
| 2010 | 17 | 0.1 |
| 2011 | 27 | 0.1 |
| 2012 | 24 | 0.1 |
| 2013 | 33 | 0.1 |
| 2014 | 26 | 0.1 |
| 2015 | 27 | 0.1 |
| 2016 | 12 | <0.1 |
| 2017 | 18 | 0.1 |
| 2018 | 11 | <0.1 |
| 2019 | 12 | <0.1 |
Epidemiology between 2015 and 2019
From 2015 to 2019, a total of 80 cases of invasive Hib were reported in Canada. An average of 16 cases were reported per year (range: 11 to 27) with the average incidence rate of 0.04 cases per 100,000 population (range: 0.03 to 0.08) (Figure 8). Cases were reported in almost every age group; however, the highest incidence rates were reported in children under five years of age, followed by adults 60 years of age and over (Figure 9). Males accounted for 64% of all cases.
Based on data obtained through IMPACT, a total of 21 paediatric cases were hospitalized due to Hib from 2015 to 2019, averaging four cases per year (range: one to nine). Of those, 52% were male and 67% were in infants under one year of age. A total of four cases of preventable HibFootnote r were reported among children less than five years of age. No deaths due to Hib were reported by IMPACT. Based on data for this period, Canada is on track to meet its disease reduction target of less than five cases of preventable Hib annually in children less than five years of age by 2025.

Figure 9: Text equivalent
| Age groups | Total number of cases | Overall incidence rate (per 100,000 population) |
|---|---|---|
| < 1 | 16 | 0.8 |
| 1 to 4 | 14 | 0.2 |
| 5 to 9 | 2 | <0.1 |
| 10 to 14 | 1 | <0.1 |
| 15 to 19 | 1 | <0.1 |
| 20 to 24 | 0 | <0.1 |
| 25 to 29 | 4 | <0.1 |
| 30 to 39 | 8 | <0.1 |
| 40 to 59 | 15 | <0.1 |
| ≥ 60 | 19 | <0.1 |
Haemophilus influenzae serotype b vaccination coverage
Based on the 2019 cNICS, only 74% of children in Canada received the recommended four doses of Hib-containing vaccine by two years of age and 80% received the recommended four doses by seven years of age Footnote 11. Thus, the 95% vaccine coverage goal by two years of age for the Hib vaccine is not achieved.
Further reading
- PHAC invasive Haemophilus influenzae disease webpage
- Canadian Immunization guide Haemophilus influenzae serotype b vaccine chapter
- National Advisory Committee on Immunization Haemophilus influenzae serotype b vaccine guidance
- Vaccination Coverage Goals and Vaccine Preventable Disease Reduction Targets by 2025
Invasive meningococcal disease (IMD)
Key points:
- Overall IMD incidence has declined by 60% from an average incidence rate of 0.8 cases per 100,000 population in the pre-vaccine era to 0.3 cases per 100,000 population from 2015 to 2019.
- With routine vaccination, the incidence of IMD due to serogroup C in Canada has declined by 94% from an average incidence of 0.3 cases per 100,000 population in the pre-vaccine era to 0.01 cases per 100,000 population from 2015 to 2019. Canada is on track to meet its reduction target of less than five cases of IMD serogroup C annually in children less than 18 years of age by 2025.
- Serogroup B now accounts for the majority of reported IMD cases in Canada at 40% compared to only 4% for serogroup C. While vaccines targeting IMD serogroup B are not currently part of routine vaccination programs in Canada, meningococcal B vaccines have been used during outbreaks.
- Vaccination rates should be improved to reach the national goal of 95%. Based on the 2019 cNICS, 91% of children in Canada received the recommended dose of meningococcal C vaccine by two years of age.
Between 2002 and 2007, a variety of routine childhood and adolescent meningococcal vaccination programs using monovalent (targeting serogroup C) and quadrivalent (targeting serogroups A, C, W-135, and Y) conjugate vaccines were implemented in Canadian provinces and territories Footnote 20. The overall incidence of IMD decreased by 60% from an average incidence rate of 0.8 cases per 100,000 population in the pre-vaccine era (1997 to 2001)Footnote s to 0.3 cases per 100,000 population from 2015 to 2019 (Figure 10). With routine vaccination, the incidence of IMD serogroup C has declined by 94%, from an average incidence rate of 0.3 cases per 100,000 population in the pre-vaccine era (1997 to 2001) to 0.01 cases per 100,000 population from 2015 to 2019 (Figure 11).
Although serogroup B is responsible for the majority of IMD cases, the incidence rate has been declining overall since it peaked in 2007. While vaccines targeting IMD serogroup B are not currently part of routine vaccination programs in Canada, meningococcal B vaccines have been used during outbreaks.
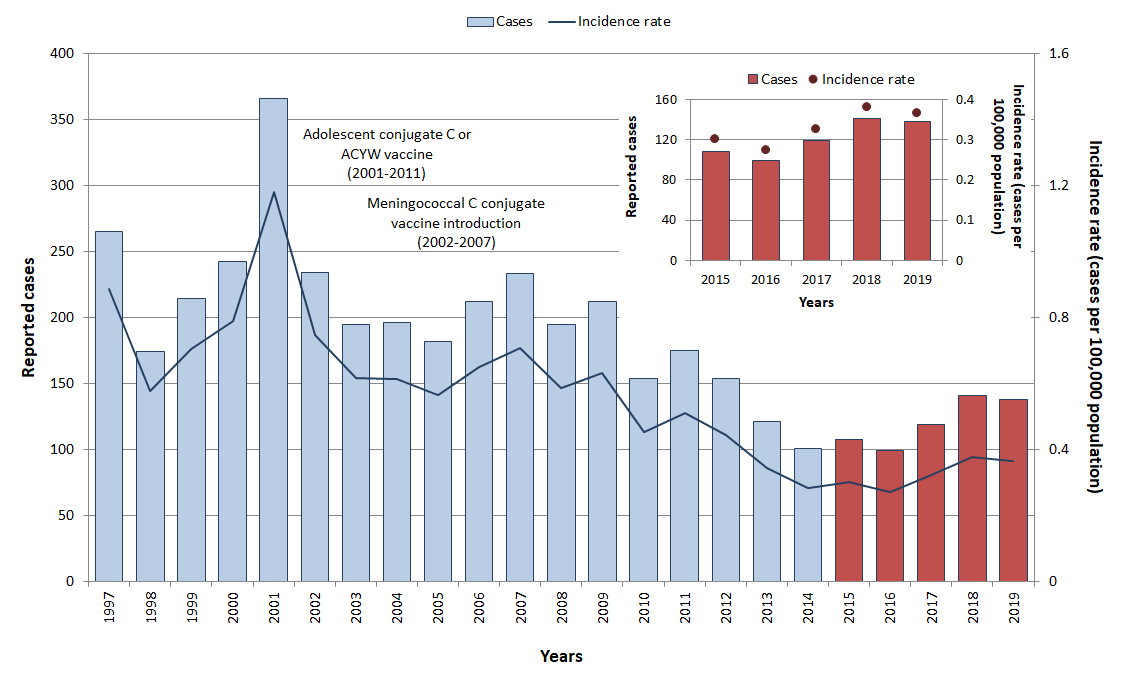
Figure 10: Text equivalent
| Year | Cases | Incidence rate (per 100,000 population) |
|---|---|---|
| 1997 | 265 | 0.9 |
| 1998 | 174 | 0.6 |
| 1999 | 214 | 0.7 |
| 2000 | 242 | 0.8 |
| 2001 | 366 | 1.2 |
| 2002 | 234 | 0.7 |
| 2003 | 195 | 0.6 |
| 2004 | 196 | 0.6 |
| 2005 | 182 | 0.6 |
| 2006 | 212 | 0.7 |
| 2007 | 233 | 0.7 |
| 2008 | 195 | 0.6 |
| 2009 | 212 | 0.6 |
| 2010 | 154 | 0.5 |
| 2011 | 175 | 0.5 |
| 2012 | 154 | 0.4 |
| 2013 | 121 | 0.3 |
| 2014 | 101 | 0.3 |
| 2015 | 108 | 0.3 |
| 2016 | 99 | 0.3 |
| 2017 | 119 | 0.3 |
| 2018 | 141 | 0.4 |
| 2019 | 138 | 0.4 |
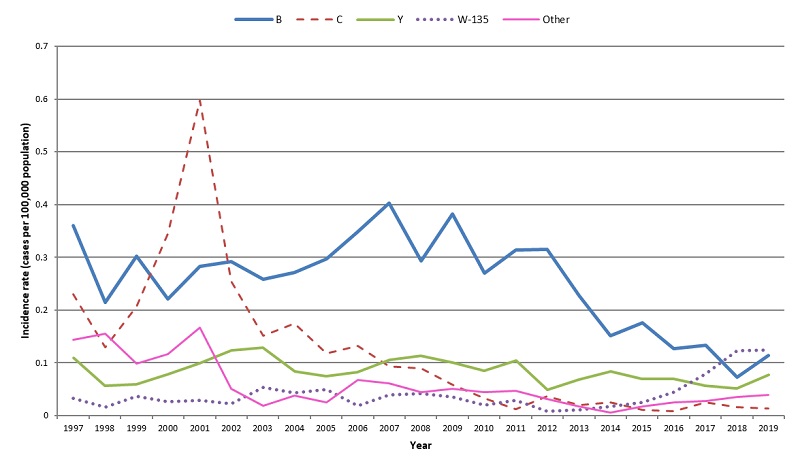
Figure 11: Text equivalent
| Year | Incidence rate by serogroup (per 100,000 population) | |||||
|---|---|---|---|---|---|---|
| B | C | Y | W-135 | Other | ||
| 1997 | 0.36 | 0.23 | 0.11 | 0.03 | 0.14 | |
| 1998 | 0.22 | 0.13 | 0.06 | 0.02 | 0.16 | |
| 1999 | 0.30 | 0.21 | 0.06 | 0.04 | 0.10 | |
| 2000 | 0.22 | 0.34 | 0.08 | 0.03 | 0.12 | |
| 2001 | 0.28 | 0.60 | 0.10 | 0.03 | 0.17 | |
| 2002 | 0.29 | 0.25 | 0.12 | 0.02 | 0.05 | |
| 2003 | 0.26 | 0.15 | 0.13 | 0.05 | 0.02 | |
| 2004 | 0.27 | 0.17 | 0.08 | 0.04 | 0.04 | |
| 2005 | 0.30 | 0.12 | 0.07 | 0.05 | 0.02 | |
| 2006 | 0.35 | 0.13 | 0.08 | 0.02 | 0.07 | |
| 2007 | 0.40 | 0.09 | 0.11 | 0.04 | 0.06 | |
| 2008 | 0.29 | 0.09 | 0.11 | 0.04 | 0.04 | |
| 2009 | 0.38 | 0.06 | 0.10 | 0.04 | 0.05 | |
| 2010 | 0.27 | 0.03 | 0.08 | 0.02 | 0.04 | |
| 2011 | 0.31 | 0.01 | 0.10 | 0.03 | 0.05 | |
| 2012 | 0.32 | 0.04 | 0.05 | 0.01 | 0.03 | |
| 2013 | 0.23 | 0.02 | 0.07 | 0.01 | 0.02 | |
| 2014 | 0.15 | 0.03 | 0.08 | 0.02 | 0.01 | |
| 2015 | 0.18 | 0.01 | 0.07 | 0.03 | 0.02 | |
| 2016 | 0.13 | 0.01 | 0.07 | 0.04 | 0.02 | |
| 2017 | 0.13 | 0.02 | 0.06 | 0.08 | 0.03 | |
| 2018 | 0.07 | 0.02 | 0.05 | 0.12 | 0.03 | |
| 2019 | 0.11 | 0.01 | 0.07 | 0.12 | 0.05 | |
Epidemiology between 2015 and 2019
From 2015 to 2019, a total of 606 IMD cases were reported in Canada. An average of 121 cases were reported per year (range: 99 to 141), with an average incidence rate of 0.3 per 100,000 population (range: 0.3 to 0.4) (Figure 10). Though cases were reported in every age group, the highest incidence rates were observed in infants less than one year of age followed by children from one to four years of age (3.2 cases and 0.8 cases per 100,000 population, respectively). The lowest overall incidence rate was reported among those five to nine years of age and 10-14 years of age (0.1 cases per 100,000 population for both), although the incidence rate among those 30-39 years of age was similar (0.2 cases per 100,000 population) (Figure 12). Cases were relatively evenly distributed across the sexes (48% males and 52% females on average, annually). During this time, 47 IMD-associated deaths were reported to the eIMDSS, for a case-fatality rate of 7.8%.

Figure 12: Text equivalent
| Age groups | Total number of cases | Overall incidence rate (per 100,000 population) |
|---|---|---|
| < 1 | 61 | 3.2 |
| 1 to 4 | 64 | 0.8 |
| 5 to 9 | 13 | 0.1 |
| 10 to 14 | 13 | 0.1 |
| 15 to 19 | 61 | 0.6 |
| 20 to 24 | 55 | 0.5 |
| 25 to 29 | 23 | 0.2 |
| 30 to 39 | 38 | 0.2 |
| 40 to 59 | 100 | 0.2 |
| ≥ 60 | 176 | 0.4 |
A decline in incidence rates for serogroup B has been observed since 2015. Incidence rates for serogroup W-135 have been increasing and other serogroups remained stable (Figure 11). IMD serogroup B was responsible for most cases in all age groups (total of 241 cases accounting for 40% of all IMD cases) and the highest incidence rates were observed in infants less than one year of age followed by children from one to four years of age (1.9 cases and 0.5 cases per 100,000 population, respectively). There was a total of 157 IMD serogroup W-135 cases which accounts for 26% of all IMD cases. Similar to serogroup B, serogroup W-135 affected mostly those less than one year of age with an incidence rate of 0.7 cases per 100,000 population, although the majority of serogroup W-135 cases were older individuals (59% of cases among those 40 years and older). There was a total of 126 IMD serogroup Y cases accounting for 21% of all IMD cases; individuals aged 15 to 19 and 20 to 24 years of age were most affected with both having an incidence rate of 0.1 cases per 100,000 population. Disease caused by serogroup C remained rare, accounting for only 4% of IMD cases (total of 27 cases). Seven cases of IMD caused by serogroup C were reported among those 18 years of age and under, with an average 1.4 cases per year. Based on data for this period, Canada is on track to meet its reduction target of less than five cases of IMD serogroup C annually in children less than 18 years of age by 2025.
Invasive meningococcal disease vaccination coverage
Based on the 2019 cNICS, 91% of children in Canada received the recommended one dose of meningococcal C vaccine by two years of age, falling slightly below the national vaccination coverage goal of 95% Footnote 11.
Further reading
- Invasive meningococcal disease
- Canadian Immunization Guide meningococcal vaccine chapter
- National Advisory Committee on Immunization meningococcal vaccine guidance
- Vaccination Coverage Goals and Vaccine Preventable Disease Reduction Targets by 2025
Mumps
Key points:
- With routine vaccination, the incidence of mumps in Canada has declined by over 99% from an average incidence rate of 251.2 cases per 100,000 population in the pre-vaccine era to 2.0 cases per 100,000 population from 2015 to 2019.
- Mumps outbreaks continue to occur every two to five years underscoring the need for ongoing vigilance and improved vaccination coverage. Several mumps outbreaks occurred in some provinces in 2017 and 2018, resulting in significant increase in the number of reported cases. Therefore, Canada is not currently on track to meet its reduction target of maintaining less than 100 mumps cases annually (based on a five-year average) by 2025.
- Vaccination rates should be improved to reach the national goal of 95%. Based on the 2019 cNICS, 89% of children in Canada received the recommended doses of mumps-containing vaccine by two years of age and 83% received the recommended doses by seven years of age.
Routine one-dose vaccination against mumps was implemented across provinces and territories between 1969 and 1983, with the second dose programs implemented between 1996 and 2001 Footnote 21. With routine vaccination, the incidence rate of mumps declined from 251.2 cases per 100,000 population during the pre-vaccine era (1950 to 1954)Footnote v to 2.0 cases per 100,000 population between 2015 and 2019 (Figure 13). However, mumps continues to be a cyclical disease in Canada, with outbreaks occurring every few years.
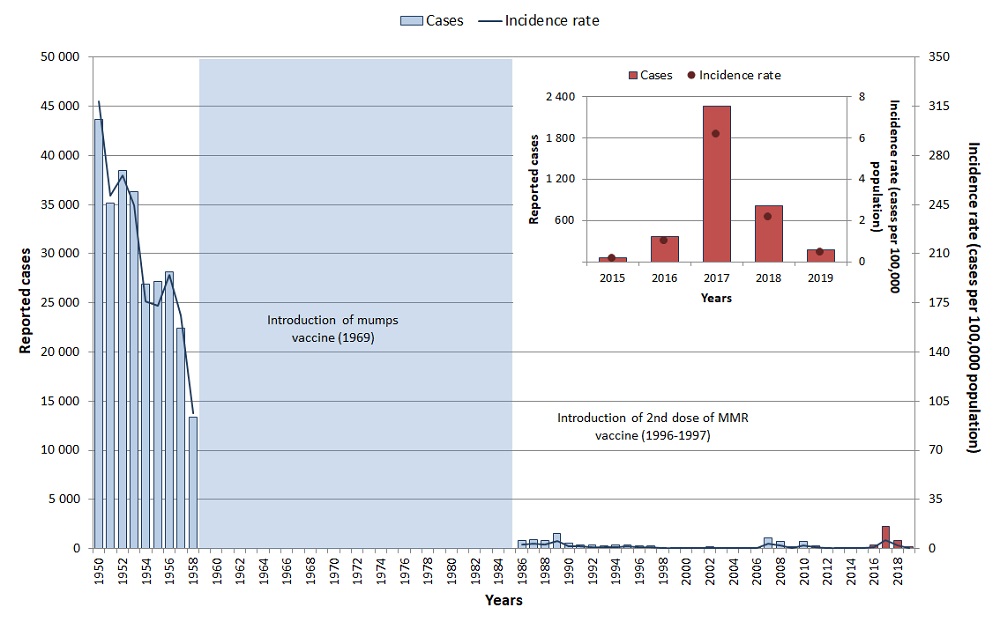
Figure 13: Text equivalent
| Year | Cases | Incidence rate (per 100,000 population) |
| 1950 | 43,671 | 318.5 |
| 1951 | 35,189 | 251.2 |
| 1952 | 38,439 | 265.8 |
| 1953 | 36,297 | 244.5 |
| 1954 | 26,908 | 176.0 |
| 1955 | 27,193 | 173.2 |
| 1956 | 28,112 | 195.2 |
| 1957 | 22,386 | 166.1 |
| 1958 | 13,360 | 96.3 |
| 1959 | No data | No data |
| 1960 | No data | No data |
| 1961 | No data | No data |
| 1962 | No data | No data |
| 1963 | No data | No data |
| 1964 | No data | No data |
| 1965 | No data | No data |
| 1966 | No data | No data |
| 1967 | No data | No data |
| 1968 | No data | No data |
| 1969 | No data | No data |
| 1970 | No data | No data |
| 1971 | No data | No data |
| 1972 | No data | No data |
| 1973 | No data | No data |
| 1974 | No data | No data |
| 1975 | No data | No data |
| 1976 | No data | No data |
| 1977 | No data | No data |
| 1978 | No data | No data |
| 1979 | No data | No data |
| 1980 | No data | No data |
| 1981 | No data | No data |
| 1982 | No data | No data |
| 1983 | No data | No data |
| 1984 | No data | No data |
| 1985 | No data | No data |
| 1986 | 836 | 3.2 |
| 1987 | 949 | 3.6 |
| 1988 | 792 | 2.9 |
| 1989 | 1,550 | 5.7 |
| 1990 | 535 | 1.9 |
| 1991 | 390 | 1.4 |
| 1992 | 330 | 1.2 |
| 1993 | 325 | 1.1 |
| 1994 | 356 | 1.2 |
| 1995 | 397 | 1.4 |
| 1996 | 290 | 1.0 |
| 1997 | 254 | 0.8 |
| 1998 | 114 | 0.4 |
| 1999 | 92 | 0.3 |
| 2000 | 81 | 0.3 |
| 2001 | 102 | 0.3 |
| 2002 | 200 | 0.6 |
| 2003 | 28 | 0.1 |
| 2004 | 33 | 0.1 |
| 2005 | 79 | 0.2 |
| 2006 | 42 | 0.1 |
| 2007 | 1,109 | 3.4 |
| 2008 | 748 | 2.2 |
| 2009 | 187 | 0.6 |
| 2010 | 768 | 2.3 |
| 2011 | 273 | 0.8 |
| 2012 | 48 | 0.1 |
| 2013 | 96 | 0.3 |
| 2014 | 40 | 0.1 |
| 2015 | 59 | 0.2 |
| 2016 | 365 | 1.0 |
| 2017 | 2,266 | 6.2 |
| 2018 | 808 | 2.2 |
| 2019 | 173 | 0.5 |
Epidemiology between 2015 and 2019
From 2015 to 2019, a total of 3,671 cases of mumps were reported nationally; however, 94% of the cases occurred in 2016, 2017 and 2018 and were mainly due to various outbreaks. These outbreaks occurred in multiple provinces during these three years and mainly involved the young adult population of 20 to 39 years of age Footnote 22. Although mumps is a cyclical disease with outbreaks occurring every few years, the incidence rate of mumps in 2018 was the highest since 1986, when mumps became notifiable in the post-vaccine era.
The five-year average of reported cases annually from 2015 to 2019 is 734 cases per year (range: 59 to 2,266, median: 365). The average incidence for this period was 2.0 cases per 100,000 population (range: 0.2 to 6.2) (Figure 13). The highest incidence rates were among those 20 to 24 years of age (5.0 cases per 100,000 population), followed by 15 to 19 years of age (4.5 cases per 100,000 population) and 25 to 29 years of age (4.5 cases per 100,000 population) (Figure 14). Due to large mumps outbreaks occurring in several provinces from 2016 to 2018, Canada is not currently on track to meet its reduction target of maintaining less than 100 cases of mumps annually (based on a five-year average) by 2025.
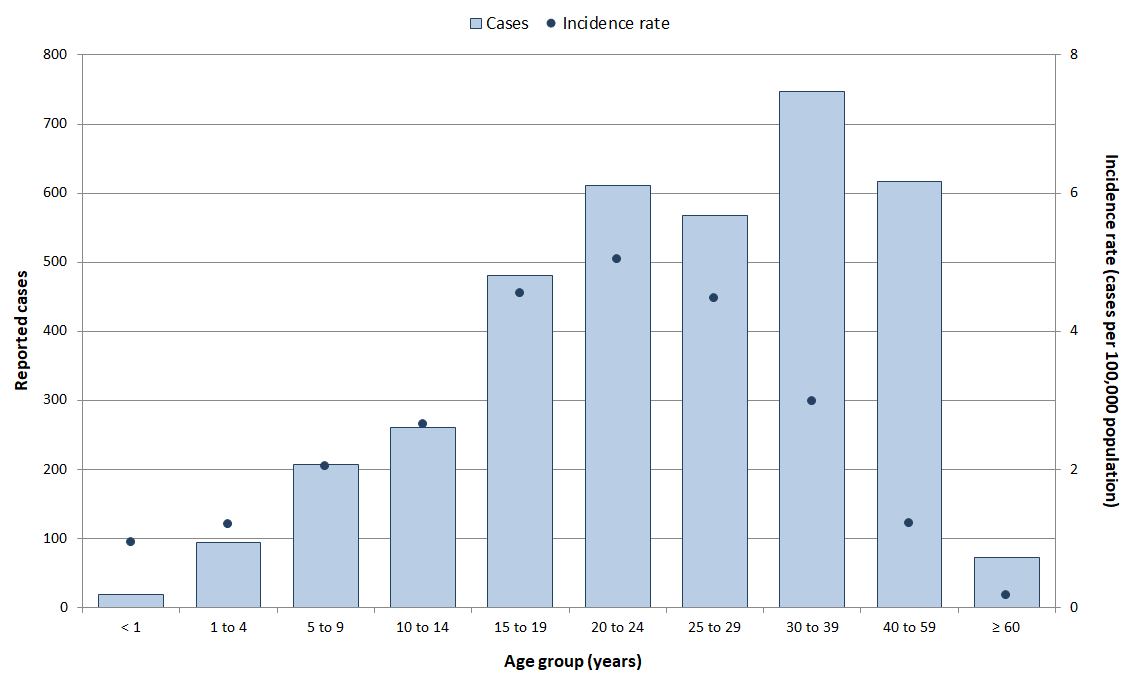
Figure 14: Text equivalent
| Age groups | Total number of cases | Overall incidence rate (per 100,000 population) |
|---|---|---|
| < 1 | 18 | 0.9 |
| 1 to 4 | 93 | 1.2 |
| 5 to 9 | 206 | 2.0 |
| 10 to 14 | 261 | 2.7 |
| 15 to 19 | 480 | 4.5 |
| 20 to 24 | 611 | 5.0 |
| 25 to 29 | 567 | 4.5 |
| 30 to 39 | 747 | 3.0 |
| 40 to 59 | 616 | 1.2 |
| ≥ 60 | 72 | 0.2 |
Mumps vaccination coverage
Based on the 2019 cNICS, 89% of children in Canada received the recommended one dose of mumps-containing vaccine by two years of age and 83% received the recommended two doses by seven years of age, which is below the vaccine coverage goal of 95% Footnote 11.
Further reading
- PHAC mumps webpage
- Canadian Immunization Guide mumps vaccine chapter
- National Advisory Committee on Immunization mumps vaccine guidance
- Vaccination Coverage Goals and Vaccine Preventable Disease Reduction Targets by 2025
- Outbreak of Mumps in Canada, 2016-2018
Summary
The average annual incidence from 2015 to 2019 of each of the VPDs with low incidence has declined over 90% compared to the pre-vaccination era. Based on surveillance data from 2015 to 2019, Canada is on track to meet national VPD reduction targets by 2025 for tetanus, Hib and IMD. If large outbreaks continue to occur, Canada is currently not on track to meet the reduction target for mumps. Presently, surveillance data is not available to assess progress in meeting national VPD reduction targets for respiratory diphtheria and maternal and neonatal tetanus. However, current work is underway to estimate maternal and neonatal tetanus case counts at the national level.
Although incidence rates for these diseases are low, vaccine coverage rates can be improved. Rates for diphtheria, tetanus and Hib by two years of age were all below 80%, which is considerably below the national vaccine coverage goal of 95%. Coverage among children two years of age for mumps-containing vaccine and meningococcal C vaccine were above 85%, but they were still below the national vaccine coverage goal of 95%.
Vaccine preventable diseases with moderate-level incidence in Canada
Pertussis
Key points:
- With routine vaccination, the incidence of pertussis has declined by 95% in Canada from an average incidence rate of 156.2 cases per 100,000 population in the pre-vaccine era to an average incidence of 8.0 cases per 100,000 population from 2015 to 2019.
- However, continued vigilance is imperative because pertussis remains endemic in Canada with peaks in incidence rates observed every two to five years that may last several years.
- Three deaths of infants under six months of age were reported from 2015 and 2019.
- Based on data from IMPACT, Canada is on track to meet its reduction target of less than three deaths annually in infants less than six months of age (based on a three-year rolling average) by 2025.
- Based on the 2019 cNICS, only 78% of children in Canada received the recommended doses of pertussis-containing vaccine by two years of age, 78% by seven years of age, and 95% by 17 years of age. Based on the 2018-2019 Seasonal Influenza Vaccination Coverage Survey, 33% of adults in Canada received one dose of pertussis-containing vaccine.
Pertussis is an endemic and cyclical disease in Canada, with peaks at two to five-year intervals and increased case counts may be observed over several years. Despite this, Canada has experienced an overall decline in pertussis incidence since the introduction of the whole-cell pertussis vaccine in 1943, acellular vaccines in 1997/1998, and the addition of an adolescent acellular dose to provincial and territorial vaccine programs between 1999 and 2004 Footnote 23, Footnote 24. With routine vaccination, the incidence of pertussis has declined by 95% from an average incidence rate of 156.2 cases per 100,000 population in the pre-vaccine era (1938 to 1942)Footnote x to 8.0 cases per 100,000 population from 2015 to 2019 (Figure 15).
In 2018, NACI recommended that immunization with the tetanus, diphtheria, pertussis vaccine (Tdap) should be offered in every pregnancy irrespective of their previous immunization history Footnote 25. More recent recommendations on pertussis can be found in the National Advisory Committee on Immunization pertussis vaccine guidance document.
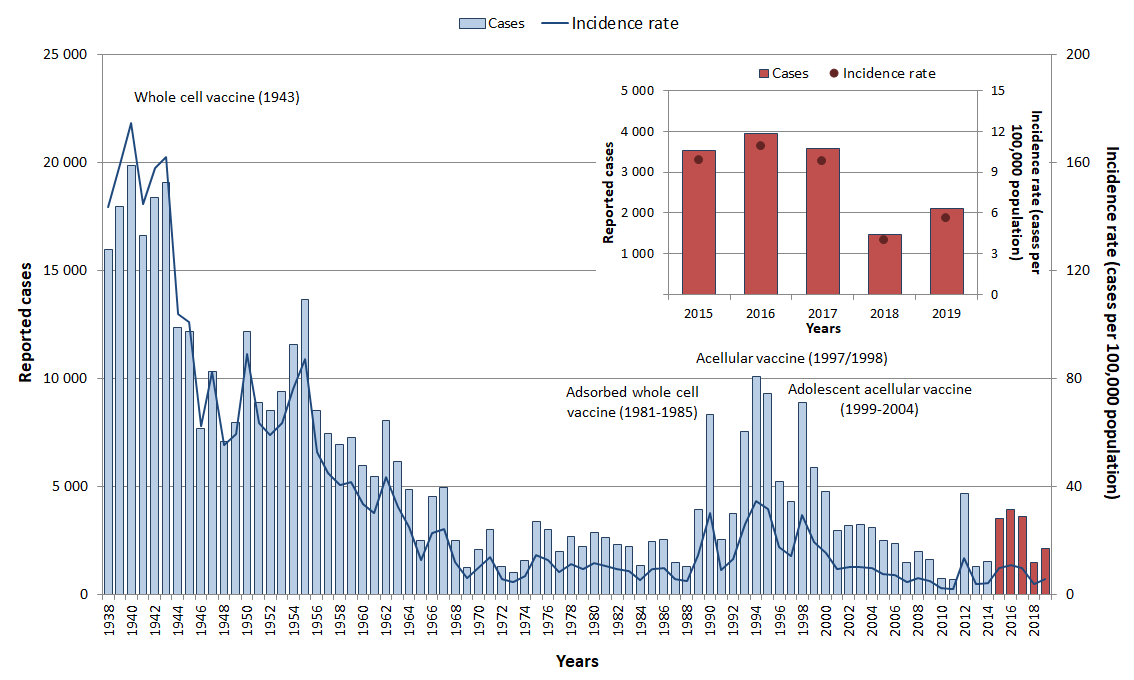
Figure 15: Text equivalent
| Year | Cases | Incidence rate (per 100,000 population) |
|---|---|---|
| 1938 | 16,003 | 143.7 |
| 1939 | 17,972 | 159.8 |
| 1940 | 19,878 | 174.9 |
| 1941 | 16,647 | 144.9 |
| 1942 | 18,384 | 158.0 |
| 1943 | 19,082 | 162.0 |
| 1944 | 12,384 | 103.8 |
| 1945 | 12,192 | 101.1 |
| 1946 | 7,671 | 62.5 |
| 1947 | 10,324 | 82.4 |
| 1948 | 7,084 | 55.3 |
| 1949 | 7,961 | 59.3 |
| 1950 | 12,182 | 89.0 |
| 1951 | 8,889 | 63.6 |
| 1952 | 8,520 | 59.0 |
| 1953 | 9,387 | 63.3 |
| 1954 | 11,600 | 76.0 |
| 1955 | 13,682 | 87.3 |
| 1956 | 8,513 | 52.9 |
| 1957 | 7,459 | 44.9 |
| 1958 | 6,932 | 40.6 |
| 1959 | 7,259 | 41.5 |
| 1960 | 5,993 | 33.6 |
| 1961 | 5,476 | 30.1 |
| 1962 | 8,076 | 43.5 |
| 1963 | 6,134 | 32.4 |
| 1964 | 4,844 | 25.1 |
| 1965 | 2,472 | 12.6 |
| 1966 | 4,555 | 22.8 |
| 1967 | 4,949 | 24.3 |
| 1968 | 2,505 | 12.1 |
| 1969 | 1,242 | 5.9 |
| 1970 | 2,098 | 9.9 |
| 1971 | 3,002 | 13.7 |
| 1972 | 1,297 | 5.8 |
| 1973 | 997 | 4.4 |
| 1974 | 1,579 | 6.9 |
| 1975 | 3,387 | 14.6 |
| 1976 | 3,002 | 12.8 |
| 1977 | 1,988 | 8.4 |
| 1978 | 2,666 | 11.1 |
| 1979 | 2,227 | 9.2 |
| 1980 | 2,873 | 11.7 |
| 1981 | 2,632 | 10.6 |
| 1982 | 2,314 | 9.2 |
| 1983 | 2,232 | 8.8 |
| 1984 | 1,353 | 5.3 |
| 1985 | 2,433 | 9.4 |
| 1986 | 2,557 | 9.8 |
| 1987 | 1,483 | 5.6 |
| 1988 | 1,301 | 4.9 |
| 1989 | 3,943 | 14.5 |
| 1990 | 8,330 | 30.1 |
| 1991 | 2,534 | 9.0 |
| 1992 | 3,763 | 13.2 |
| 1993 | 7,537 | 26.2 |
| 1994 | 10,116 | 34.8 |
| 1995 | 9,308 | 31.7 |
| 1996 | 5,230 | 17.6 |
| 1997 | 4,281 | 14.3 |
| 1998 | 8,896 | 29.4 |
| 1999 | 5,862 | 19.2 |
| 2000 | 4,748 | 15.4 |
| 2001 | 2,945 | 9.5 |
| 2002 | 3,199 | 10.2 |
| 2003 | 3,239 | 10.2 |
| 2004 | 3,104 | 9.7 |
| 2005 | 2,492 | 7.7 |
| 2006 | 2,346 | 7.2 |
| 2007 | 1,493 | 4.5 |
| 2008 | 1,967 | 5.9 |
| 2009 | 1,628 | 4.8 |
| 2010 | 750 | 2.2 |
| 2011 | 694 | 2.0 |
| 2012 | 4,653 | 13.4 |
| 2013 | 1,281 | 3.6 |
| 2014 | 1,531 | 4.3 |
| 2015 | 3,522 | 9.8 |
| 2016 | 3,951 | 10.9 |
| 2017 | 3,586 | 9.8 |
| 2018 | 1,467 | 3.9 |
| 2019 | 2,120 | 5.6 |
Epidemiology between 2015 and 2019
From 2015 to 2019, a total of 14,646 cases of pertussis were reported, averaging 2,929 cases per year (range: 1,467 to 3,951). The average annual incidence rate was 8.0 cases per 100,000 population (range: 3.9 to 10.9). Higher incidence rates were observed between 2015 and 2017 (Figure 15). Although cases were reported across all age groups, incidence rates were highest in children under 15 years of age, especially in infants less than one year of age (Figure 16). Overall, 55% of the cases were female.
Based on data obtained through IMPACT, from 2015 to 2019, a total of 273 (average: 55, range: 24-78) paediatric cases were hospitalized due to pertussis from 2015 to 2019. Of those, 52% were female. Most of the cases (89%) were in infants under six months of age. Of those, nearly half (49%) were in infants less than two months of age. A total of three deaths due to pertussis were reported and all were in infants under six months of age. Based on three-year rolling average data from this period, Canada is on track to meet its disease reduction target of less than three deaths annually in infants less than six months of age by 2025.
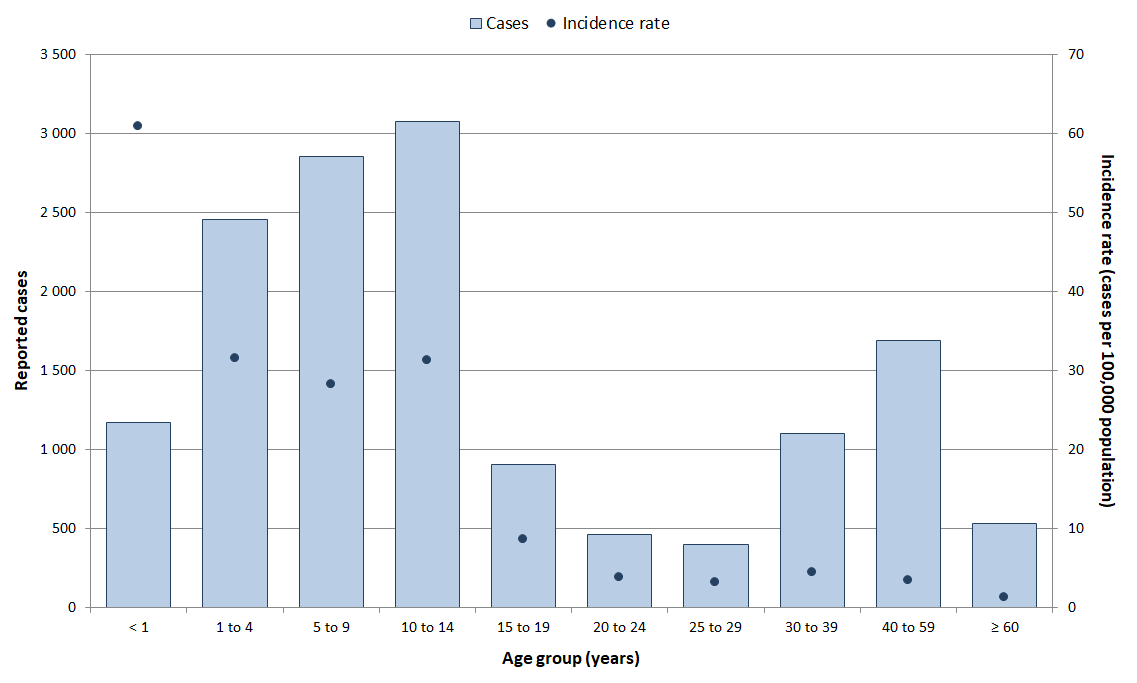
Figure 16: Text equivalent
| Age groups | Total number of cases | Overall incidence rate (per 100,000 population) |
|---|---|---|
| < 1 | 1,171 | 60.9 |
| 1 to 4 | 2,459 | 31.5 |
| 5 to 9 | 2,855 | 28.3 |
| 10 to 14 | 3,076 | 31.2 |
| 15 to 19 | 902 | 8.5 |
| 20 to 24 | 458 | 3.8 |
| 25 to 29 | 397 | 3.1 |
| 30 to 39 | 1,100 | 4.4 |
| 40 to 59 | 1,691 | 3.3 |
| ≥ 60 | 529 | 1.2 |
Pertussis vaccination coverage
Based on the 2019 cNICS, only 78% of children in Canada received the recommended four doses of pertussis-containing vaccine by two years of age and 78% received the recommended five doses by seven years of age, which did not meet the 95% vaccine coverage goal. However, the 90% adolescent vaccine coverage goal was met because 95% received the recommended one dose of the booster by 17 years of age Footnote 11. According to the 2018-2019 Seasonal Influenza Vaccination Coverage Survey, 33% of adults in Canada received one dose of the pertussis-containing vaccine in adulthood Footnote 19.
Further reading
- PHAC pertussis webpage
- Canadian Immunization Guide pertussis vaccine chapter
- National Advisory Committee on Immunization pertussis vaccine guidance
- Vaccination Coverage Goals and Vaccine Preventable Disease Reduction Targets by 2025
Invasive pneumococcal disease (IPD)
Key points:
- With the implementation of routine childhood pneumococcal vaccination between 2002 and 2006, invasive pneumococcal disease (IPD) incidence among children less than two years of age has decreased substantially from a peak of 73.0 cases per 100,000 population in 2003 to an average of 16.2 cases per 100,000 population from 2015 to 2019.
- Conversely, incidence rates among adults 65 years of age and older have remained relatively unchanged since the early 2000s; therefore, Canada is not currently on track to meet its target of a 5% reduction in the overall incidence of IPD among adults 65 years and older by 2025.
- Based on the 2019 cNICS and 2018-2019 Seasonal Influenza Vaccination Coverage Survey, 84% of children in Canada received the recommended doses of pneumococcal vaccine by two years of age and 58% of adults 65 years and older in Canada received a pneumococcal vaccine.
Streptococcus pneumoniae (pneumococcus) is the leading cause of invasive bacterial infections and bacterial pneumonia in young children. IPD became nationally notifiable in 2000; before this time, only cases of pneumococcal meningitis were notifiable nationally. Following a period of instability in incidence rates due to this change in reporting practice, overall annual incidence rates of IPD have remained relatively stable since 2003, ranging between 8.9 and 9.5 cases per 100,000 population per year (Figure 17). However, age-standardized incidence rates between 2001 and 2018 were 2.8 times higher in northern Canada than elsewhere in the countryFootnote z.
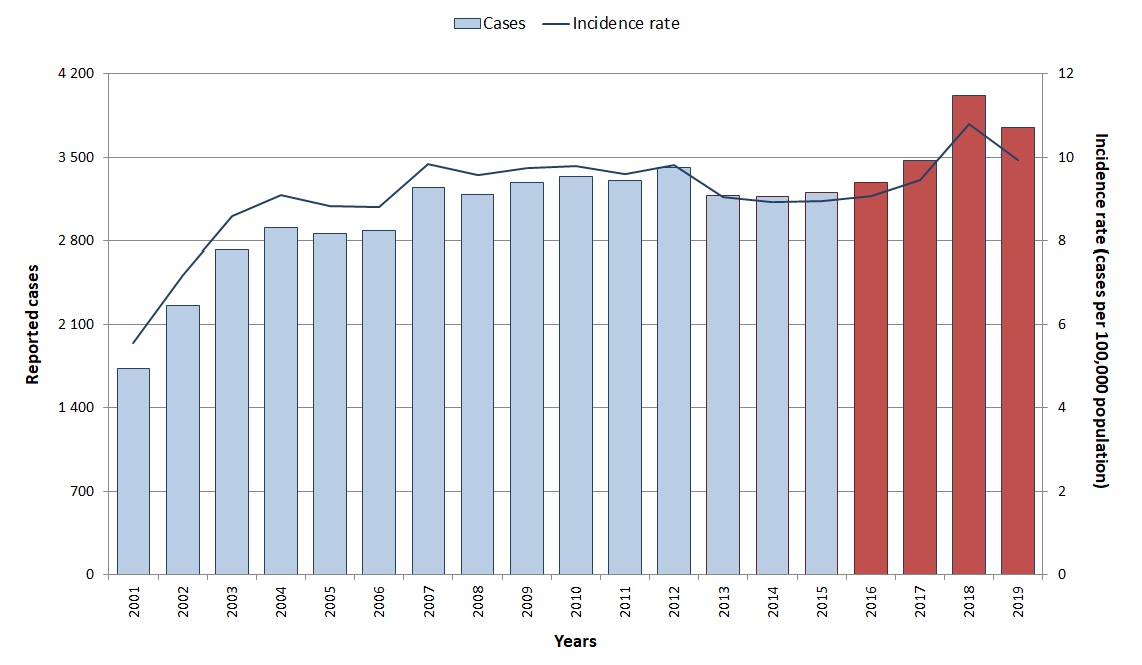
Figure 17: Text equivalent
| Year | Cases | Incidence rate (per 100,000 population) |
|---|---|---|
| 2001 | 1,733 | 5.6 |
| 2002 | 2,261 | 7.2 |
| 2003 | 2,725 | 8.6 |
| 2004 | 2,914 | 9.1 |
| 2005 | 2,857 | 8.8 |
| 2006 | 2,883 | 8.8 |
| 2007 | 3,247 | 9.8 |
| 2008 | 3,192 | 9.6 |
| 2009 | 3,291 | 9.8 |
| 2010 | 3,344 | 9.8 |
| 2011 | 3,307 | 9.6 |
| 2012 | 3,419 | 9.8 |
| 2013 | 3,185 | 9.0 |
| 2014 | 3,177 | 8.9 |
| 2015 | 3,211 | 9.0 |
| 2016 | 3,290 | 9.1 |
| 2017 | 3,478 | 9.5 |
| 2018 | 4,026 | 10.8 |
| 2019 | 3,758 | 9.9 |
NACI recommends routine immunization against IPD for those aged two years and under and those aged 65 years of age and older Footnote 26,Footnote 27. In the absence of national surveillance data prior to 2000, incidence rates for children less than two years of age (between 1994 and 1999) were estimated by various studies and ranged from 58.8 cases to 112.2 cases per 100,000 population Footnote 28. Following the implementation of routine pneumococcal childhood vaccination between 2002 and 2006, IPD incidence among children less than two years of age decreased to an average of 16.2 cases per 100,000 population from 2015 to 2019 (Figure 18). The proportion of IPD due to serotypes covered by the PCV7 vaccine decreased considerably following its introduction in all provinces and territories by 2006 Footnote 29,Footnote 30,Footnote 31,Footnote 32. By 2010, serotypes covered by the PCV7 vaccine represented 6% of all IPD cases in children 14 years of age and under, while responsible for over 80% of invasive disease in children during the pre-conjugate vaccine era Footnote 30,Footnote 33.
Following the introduction of the PCV13 vaccine in all provinces and territories by 2011, PCV13-specific serotype cases have declined in all ages from 46% in 2010 to 21% in 2018 Footnote 34,Footnote 35. Although the 23-valent pneumococcal polysaccharide vaccine has been licensed for use in Canada since 1983 and included in routine vaccination programs for those 65 years of age and older in all provinces and territories by 2000 Footnote 36, the average incidence in this age group has remained relatively unchanged since the early 2000s (Figure 18).
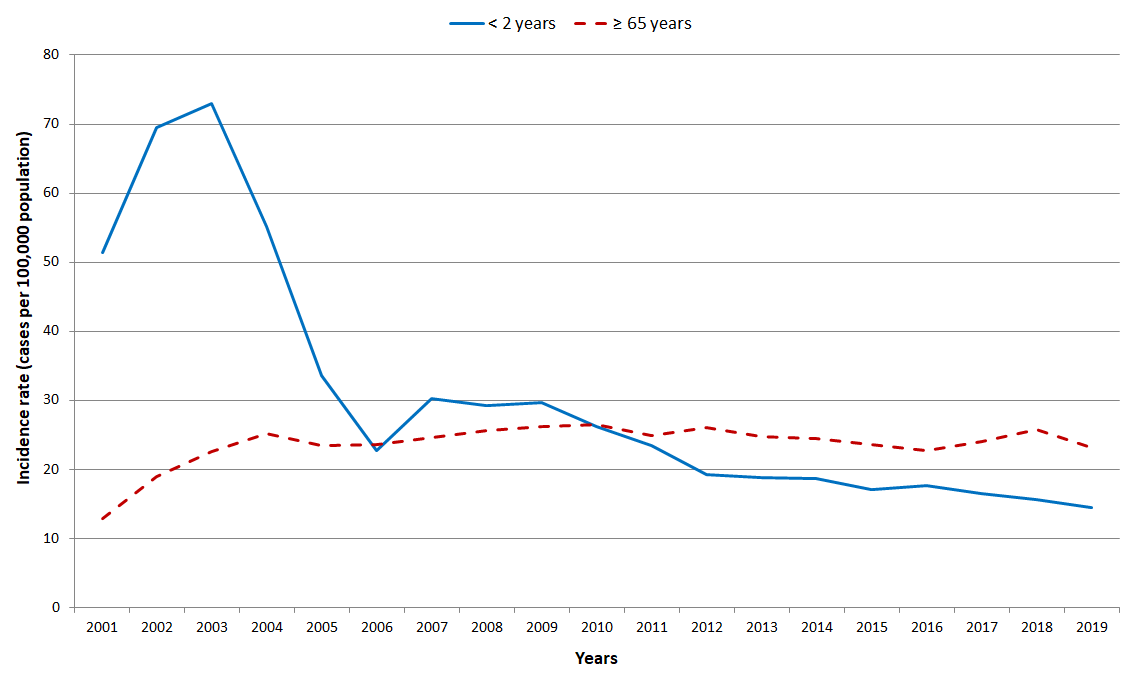
Figure 18: Text equivalent
| Year | Incidence rate per age groups (per 100,000 population) |
|
|---|---|---|
| <2 | 65+ | |
| 2001 | 51.4 | 12.9 |
| 2002 | 69.4 | 18.9 |
| 2003 | 73.0 | 22.5 |
| 2004 | 55.1 | 25.1 |
| 2005 | 33.6 | 23.5 |
| 2006 | 22.7 | 23.5 |
| 2007 | 30.2 | 24.6 |
| 2008 | 29.3 | 25.5 |
| 2009 | 29.7 | 26.1 |
| 2010 | 26.1 | 26.5 |
| 2011 | 23.5 | 24.8 |
| 2012 | 19.3 | 26.0 |
| 2013 | 18.8 | 24.7 |
| 2014 | 18.7 | 24.4 |
| 2015 | 17.1 | 23.6 |
| 2016 | 17.6 | 22.7 |
| 2017 | 16.5 | 24.0 |
| 2018 | 15.7 | 25.8 |
| 2019 | 14.4 | 23.2 |
Epidemiology between 2015 and 2019
From 2015 to 2019, a total of 17,763 IPD cases were reported in Canada. An average of 3,553 cases were reported per year (range: 3,211 to 4,026), with an average incidence rate of 9.7 cases per 100,000 population (range: 9.0 to 10.8) (Figure 17). Although cases were reported across all age groups, the highest incidence rates were in adults aged 60 years of age and older (21.2 cases per 100,000 population), followed by infants less than one year (13.9 cases per 100,000) and children aged one to four years of age (11.6 cases per 100,000) (Figure 19). Males accounted for 55% of all cases. Based on data for this period, Canada is not currently on track to meet the 5% disease reduction target for IPD in adults 65 years of age and older by 2025 because the incidence rate in this age group has remained relatively stable since the early 2000s.
Based on data obtained through IMPACT, a total of 716 paediatric cases were hospitalized due to IPD from 2015 to 2019, averaging 143 cases per year (range: 123 to 164). Of those, 57% were male. Most of the cases (68%) were in children less than five years of age. Approximately 76% of the cases had information on IPD serotypes. Of these, approximately 76% were due to serotypes not included in the pneumococcal conjugate 13-valent (Pneu-C-13) vaccine. A total of 22 deaths due to IPD were reported between 2015 and 2019 through IMPACT, ranging from two to eight deaths per year. The majority (77%) were in children under five years of age.
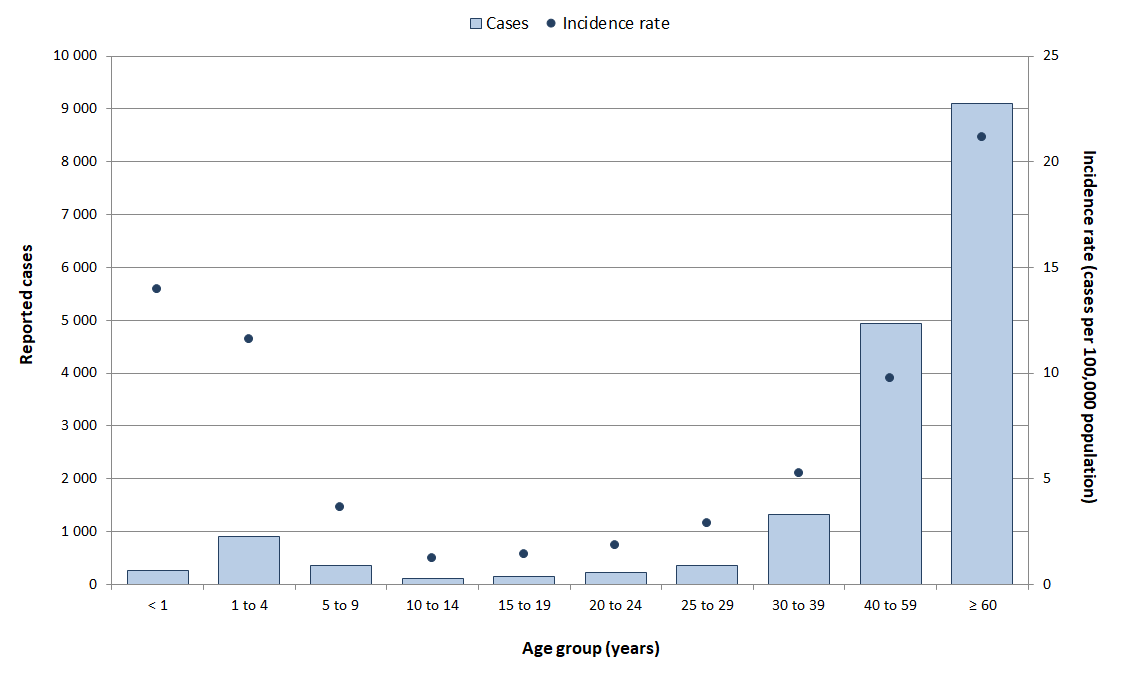
Figure 19: Text equivalent
| Age groups | Total number of cases | Overall incidence rate (per 100,000 population) |
|---|---|---|
| < 1 | 268 | 13.9 |
| 1 to 4 | 904 | 11.6 |
| 5 to 9 | 366 | 3.6 |
| 10 to 14 | 119 | 1.2 |
| 15 to 19 | 150 | 1.4 |
| 20 to 24 | 226 | 1.9 |
| 25 to 29 | 366 | 2.9 |
| 30 to 39 | 1,315 | 5.2 |
| 40 to 59 | 4,931 | 9.7 |
| ≥ 60 | 9,104 | 21.2 |
IPD vaccination coverage
Based on the 2019 cNICS, only 84% of children in Canada received the recommended doses of pneumococcal vaccine by two years of age Footnote 11. Based on the 2018-2019 Seasonal Influenza Vaccination Coverage Survey, only 58% of adults 65 years of age and older in Canada received a pneumococcal vaccine Footnote 19. Neither the 95% vaccination coverage goal for children by two years of age nor the 80% vaccination coverage goal for adults 65 years of age and older were met.
Further reading
- PHAC invasive pneumococcal disease webpage
- Canadian Immunization Guide pneumococcal vaccine chapter
- National Advisory Committee on Immunization pneumococcal vaccine guidance
- Serotype distribution of invasive Streptococcus pneumoniae in Canada after the introduction of the 13-valent pneumococcal conjugate vaccine, 2010-2012
- National Laboratory Surveillance of Invasive Streptococcal Disease in Canada - Annual Summaries: 2018 report, 2017 report, 2016 report
- Vaccination Coverage Goals and Vaccine Preventable Disease Reduction Targets by 2025
Varicella
Key points:
- Although nationally notifiable, varicella is not reportable in all jurisdictions. Data presented is therefore an underestimate of the true burden of varicella in Canada.
- With routine vaccination, the incidence of varicella in Canada has declined by 99% from an average incidence rate of 213.3 cases per 100,000 population in the pre-vaccine era to 2.0 cases per 100,000 population from 2015 to 2019. Data from IMPACT also suggests an overall decline in hospitalizations associated with serious varicella infections.
- Based on data from IMPACT, Canada is on track to meet its reduction target of less than 50 hospitalizations annually for varicella in vaccine-eligible children less than 18 years of age, by 2025.
- Vaccination rates should be improved to reach the national goal of 95%. Based on the 2019 cNICS, only 83% of children in Canada received the recommended doses of varicella-containing vaccine by two years of age.
The varicella vaccine was first approved in Canada in 1998 and routine varicella vaccination programs were implemented in Canadian provinces and territories between 2000 and 2007 Footnote 37. Based on data from reporting jurisdictions, the average incidence of varicella has declined by approximately 99% from 213.3 cases per 100,000 population in the pre-vaccine era (1993 to 1997)Footnote ac to an average incidence of 2.0 cases per 100,000 population between 2015 and 2019 (Figure 20).
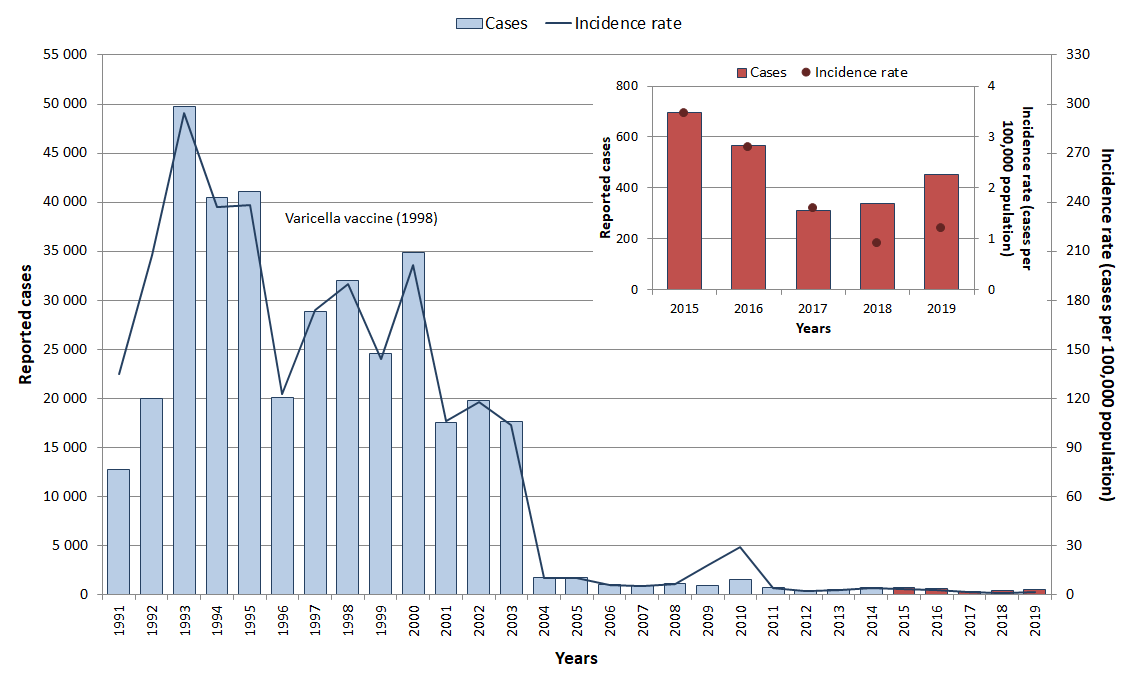
Figure 20: Text equivalent
| Year | Cases | Incidence rate (per 100,000 population) |
|---|---|---|
| 1991 | 12,773 | 134.8 |
| 1992 | 20,001 | 207.9 |
| 1993 | 49,779 | 294.7 |
| 1994 | 40,416 | 236.9 |
| 1995 | 41,087 | 238.4 |
| 1996 | 20,077 | 122.4 |
| 1997 | 28,866 | 174.0 |
| 1998 | 32,024 | 189.9 |
| 1999 | 24,509 | 143.7 |
| 2000 | 34,866 | 201.7 |
| 2001 | 17,515 | 105.8 |
| 2002 | 19,761 | 117.6 |
| 2003 | 17,572 | 103.4 |
| 2004 | 1,734 | 10.1 |
| 2005 | 1,750 | 10.0 |
| 2006 | 1,041 | 5.9 |
| 2007 | 870 | 4.9 |
| 2008 | 1,138 | 6.3 |
| 2009 | 933 | 18.1 |
| 2010 | 1,511 | 29.0 |
| 2011 | 681 | 3.7 |
| 2012 | 355 | 1.9 |
| 2013 | 456 | 2.4 |
| 2014 | 719 | 3.7 |
| 2015 | 695 | 3.5 |
| 2016 | 568 | 2.8 |
| 2017 | 311 | 1.6 |
| 2018 | 339 | 0.9 |
| 2019 | 453 | 1.2 |
Epidemiology between 2015 and 2019
Based on data from reporting jurisdictions, a total of 2,366 varicella cases were reported in Canada from 2015 to 2019. An average of 473 cases were reported per year (range: 311 to 694) with the average incidence rate of 2.0 cases per 100,000 population (range: 0.9 to 3.5) (Figure 20). Cases were reported in every age group; however, the highest overall incidence rate was reported among infants less than one year of age (9.4 cases per 100,000 population), followed by children aged 10 to 14 years of age (5.7 cases per 100,000 population), and five to nine years of age (4.5 cases per 100,000 population, Figure 21). Males accounted for 55% of all cases.

Figure 21: Text equivalent
| Age groups | Total number of cases | Incidence rate (per 100,000 population) |
|---|---|---|
| < 1 | 133 | 6.9 |
| 1 to 4 | 229 | 2.9 |
| 5 to 9 | 342 | 3.4 |
| 10 to 14 | 418 | 4.2 |
| 15 to 19 | 266 | 2.5 |
| 20 to 24 | 236 | 1.9 |
| 25 to 29 | 176 | 1.4 |
| 30 to 39 | 262 | 1.0 |
| 40 to 59 | 218 | 0.4 |
| ≥ 60 | 84 | 0.2 |
Based on data from IMPACT, since the introduction of routine vaccination programs in 2000, the paediatric hospitalizations associated with serious varicella infections have declined from 398 hospitalizations to an annual average of 47 hospitalizations (range: 25 to 73) from 2015 to 2019 (Figure 22). During this surveillance period, the number of hospitalizations decreased from 73 cases in 2015 to 25 cases in 2019. Fifty-eight percent of the cases were male. The distribution of cases through age groups were highest in the one to four years of age (31%), followed by the five to nine years of age (29%) and infants under one year of age (22%). The majority of cases (81%) occurred among children who were immunocompromised, not eligible for vaccination, or not vaccinated. One death associated with varicella was reported through IMPACT during this period. Among children eligible for vaccinationFootnote af, an average of 13 hospitalizations were reported annually. Based on data from 2015 to 2019, Canada is on track to meet its VPD target of less than 50 hospitalizations annually due to varicella in vaccine-eligible children less than 18 years of age, by 2025.

Figure 22: Text equivalent
| Year | Number of pediatric varicella hospitalisations |
|---|---|
| 1999 | 234 |
| 2000 | 398 |
| 2001 | 278 |
| 2002 | 305 |
| 2003 | 247 |
| 2004 | 271 |
| 2005 | 198 |
| 2006 | 152 |
| 2007 | 107 |
| 2008 | 59 |
| 2009 | 77 |
| 2010 | 69 |
| 2011 | 71 |
| 2012 | 61 |
| 2013 | 52 |
| 2014 | 68 |
| 2015 | 73 |
| 2016 | 58 |
| 2017 | 42 |
| 2018 | 37 |
| 2019 | 25 |
Varicella vaccination coverage
Based on the 2019 cNICS, only 83% of children in Canada received the recommended dose of varicella vaccine by two years of age, which is below the 95% vaccine coverage goal Footnote 11.
Further reading
- PHAC varicella webpage
- Canadian Immunization Guide varicella vaccine chapter
- National Advisory Committee on Immunization varicella vaccine guidance
- Vaccination Coverage Goals and Vaccine Preventable Disease Reduction Targets by 2025
Summary
There has been a decline of over 95% in the average annual incidence rate for pertussis and varicella during the period from 2015 to 2019 compared to the pre-vaccination era. Children are most vulnerable to these diseases, with the highest incidence rates being reported in infants under one year of age. The overall incidence rates for IPD have remained stable since 2003, with the highest rates reported in adults over the age of 60. Based on surveillance data from 2015 to 2019, Canada is on track to meet the VPD reduction target for pertussis and varicella by 2025 but is not on track for meeting the reduction target of a 5% reduction in IPD incidence for adults 65 years of age and older. Vaccination rates for pertussis, IPD, and varicella did not meet the national vaccination coverage goal of 95% by two years of age. Furthermore, the IPD vaccination rate did not meet the national coverage goal of 80% coverage for individuals 65 years of age and older.
Conclusion
The findings of this report underscore the pivotal role of publicly-funded infant, childhood and adult vaccination programs in reducing the burden of VPDs. For many VPDs, incidence rates have declined drastically in Canada since the pre-vaccine era. Surveillance data from 2015 to 2019 indicate that Canada is on track to meet national VPD reduction targets for measles, rubella, CRS/CRI, polio, diphtheria, tetanus, invasive disease due to Hib, IMD, pertussis, and varicella, but is at risk of not meeting the reduction targets for mumps and IPD by 2025.
Canada continues to maintain its elimination status for measles, rubella, CRS/CRI and polio. Despite the large number of measles cases due to imported cases, ongoing endemic transmission of the measles virus was not re-established in Canada. High vaccine coverage and strong surveillance are continue to be critical to retain the elimination status of these diseases.
Although achieving VPD reduction targets can be impacted by various factors, such as increases in mumps due to outbreaks, cyclical fluctuation of pertussis every two to five years, preventable cases of Hib among infants, imported cases of measles causing risks of secondary spread or serogroup conversion in IMD, the results described in this report indicate a pressing need to enhance vaccine coverage over the next few years in order for Canada to meet the reduction targets by 2025. Strong surveillance systems are important to monitor disease trends and burden, as well as to provide data for national vaccination recommendations and programs.
The greatest additional gains can come from understanding the characteristics of under-immunized and unimmunized populations and improving their vaccination coverage. History demonstrates that the importation of disease into under-immunized or unimmunized populations can result in outbreaks. Rates of vaccination need to be enhanced through clear, understandable and ongoing public communication about the risks and benefits of vaccination, especially when disease rates are low. Vaccines are one of the greatest achievements of biomedical science and public health. Continued commitment to vaccine programs is essential to advance their public health benefits.
Acknowledgements
We are grateful to local, provincial, and territorial public health staff for their continued support and tireless efforts in communicable disease surveillance and control as well as outbreak investigations. We also thank the healthcare providers and laboratorians who diligently report case information to their local health authorities. Finally, we thank IMPACT researchers and nurse monitors and the Canadian Pediatric Society for their work in elucidating the burden of vaccine preventable diseases in the hospitalized pediatric populations.
Appendix A: Methods and limitations
Surveillance data sources
Canadian Notifiable Disease Surveillance System
National surveillance data for polio, diphtheria, tetanus, invasive disease due to Haemophilus influenzae serotype b (Hib), mumps, pertussis, invasive pneumococcal disease (IPD), varicella, and historical data for measles (1950-2011) and rubella (1950-2012) were obtained through the Canadian Notifiable Disease Surveillance System (CNDSS), a surveillance system coordinated by the Public Health Agency of Canada (PHAC). Data aggregated by year, sex, province/territory, and age group are voluntarily provided annually by provincial and territorial partners. Age groups include infants less than one year of age, one to four years of age, five to nine years of age, ten to 14 years of age, 15 to 19 years of age, 20 to 24 years of age, 25 to 29 years of age, 30 to 39 years of age, 40 to 59 years of age, and adults 60 years of age and older. In addition, eight jurisdictions (British Columbia, Alberta, Saskatchewan, Ontario, Québec, Prince Edward Island, the Yukon, and Nunavut), provide case-level data to CNDSS. These jurisdictions accounted for approximately 90% of the Canadian population between 2015 and 2019. Data in this report are current as of June 2021.
Canadian Measles and Rubella Surveillance System
National enhanced surveillance data for measles (2012-2019), rubella (2013-2019), and CRS/CRI were obtained through the Canadian Measles and Rubella Surveillance System (CMRSS). Provincial and territorial departments of health submit case-level, non-nominal epidemiologic data weekly to PHAC on all cases that meet the national case definitions, including zero-reporting. The National Microbiology Laboratory (NML) provides genotype results for confirmed cases.
Enhanced Invasive Meningococcal Disease Surveillance System
National surveillance data for invasive meningococcal disease (IMD) were obtained through the enhanced Invasive Meningococcal Disease Surveillance System (eIMDSS). Provincial and territorial departments of health submit case-level, non-nominal epidemiologic and laboratory data annually to PHAC on all cases of IMD that meet the national case definition Footnote 38. Provincial and territorial public health and/or hospital laboratories send all Neisseria meningitidis isolates to the NML for confirmation and organism characterization. Deterministic matching on province/territory, date of birth or age, sex, onset date, and serogroup is conducted to link epidemiologic and laboratory data for cases with incomplete information.
Canada's Immunization Monitoring Program, ACTive
The Canadian Immunization Monitoring Program, Active (IMPACT) is a national surveillance initiative that monitors adverse events following immunization, vaccine failures and selected infectious diseases that are, or will be, vaccine preventable. IMPACT is managed by the Canadian Paediatric Society (CPS) and conducted by the IMPACT network of paediatric investigators at 12 tertiary care paediatric hospitals across Canada, which represent 90% of all tertiary care paediatric beds in Canada. Funding is provided by PHAC to the CPS for IMPACT. The IMPACT Data Monitoring Centre submits case-level, non-nominal epidemiologic and laboratory data quarterly to PHAC on hospitalizations in children 16 years of age and younger due to pertussis, varicella, IPD and Hib.
Canadian Acute Flaccid Paralysis Surveillance System
National surveillance data for acute flaccid paralysis (AFP) in children less than 15 years of age is a WHO-recommended strategy for detecting poliovirus circulation. National AFP surveillance data were obtained through the Canadian Acute Flaccid Paralysis Surveillance System (CAFPSS). Data are voluntarily provided by participating physicians and IMPACT nurse monitors who submit completed case report forms on an ongoing basis to the Canadian Paediatric Surveillance Program. The forms are then forwarded to PHAC for medical adjudication to rule out polio as the cause of AFP and to ensure that cases meet the national AFP case definition.
International Circumpolar Surveillance System of Invasive Bacterial Diseases
The International Circumpolar Surveillance (ICS) initiative is a population-based surveillance network of countries with circumpolar regions. Within Canada, six regions (Yukon, Northwest Territories, Nunavut, northern Labrador, Québec Cree, and Québec Nunavik) and a network of laboratories, including two references laboratories, the Laboratoire de santé publique du Québec and the National Microbiology Laboratory, participate in the program. Data collected include laboratory results, risk factors, clinical manifestation information, age, sex, and ethnicity details.
Vaccination coverage data sources
2019 Childhood National Immunization Coverage Survey
In Canada, national immunization coverage for childhood vaccines is monitored every two years by surveys conducted by Statistics Canada on behalf of PHAC through the childhood National Immunization Coverage Survey (cNICS). The cNICS is intended to determine if children are immunized in accordance with recommended immunization schedules for publicly-funded vaccines, to report vaccination coverage estimates to international organizations, and to develop appropriately targeted public education strategies.
Note: These reported numbers are most likely underestimates because data were collected primarily from parent-held vaccination records, in which some doses may be missing or recorded with incomplete information such as missing or illegible dates. In addition, in jurisdictions where vaccinations are recorded by vaccine and where the measles-mumps-rubella-varicella (MMRV) vaccine is in use, some doses of this vaccine may be recorded as MMR, thus leading to an under-counting of varicella vaccination.
2018-2019 Seasonal Influenza Vaccination Coverage Survey
Since 1991, PHAC has been monitoring national vaccination coverage for selected adult vaccines. It was first monitored through the adult National Immunization Coverage Survey (aNICS), which was first conducted in 2001 and has been routinely administered every two years since 2006. As of 2018, adult vaccine coverage was merged into the Seasonal Influenza Vaccination Coverage Survey. The Seasonal Influenza Vaccination Coverage Survey measures coverage for the flu shot in adults every year and includes other adult vaccine coverage every second year. Results from these national vaccine coverage surveys are used to monitor coverage at the national level for vaccines recommended by the National Advisory Committee on Immunization (NACI), to report vaccination coverage estimates against national coverage goals, and to inform vaccination program and public education strategies. Target populations include adults with or without chronic medical conditions and health care workers.
Population data sources
Population estimates
For all VPDs except CRS/CRI, denominator data for incidence rate calculations were obtained from Statistics Canada population estimates in October 1, 2020 Footnote 39.
Live births
For CRS/CRI, incidence rate by live births were obtained from CNDSS Notifiable disease charts Footnote 40.
Analyses
Analyses performed for this report include frequency counts, crude and age-specific incidence rates, and age and sex distributions as appropriate. Numerator data are from CNDSS, CMRSS, eIMDSS, IMPACT, and CAFPSS. Denominators are from population data and populations of those provinces and territories that did not submit data were removed from the denominators of incidence rate calculations. Case-fatality rate for IMD represents the percentage of reported deaths due to IMD among the reported IMD cases. Case-level CNDSS data were used to calculate IPD incidence rates for children less than two years of age and for adults 65 years of age and older.
Limitations
General limitations associated with data collected from passive surveillance systems should be considered in the interpretation of the results presented in this report, including differences in reporting practices across jurisdictions, reporting delays, missing or incomplete data, duplicate reports and under-reporting. Because surveillance activities are ongoing, all data are subject to change. Except for VPDs under elimination in Canada, cases reported to the national level are not reviewed to ensure that they meet national case definitions. Because of the unreliability of results based on small numbers, caution should be used when interpreting results such as incidence rates and sex distribution based on less than 20 cases.
Due to the passive nature of many of the surveillance systems used to provide data for this report, reported cases are expected to be underestimates of the true burden of disease. Under-reporting is also likely among adolescents and adults (who may be less likely to be seen by a health care professional) and for milder or asymptomatic illness or those diseases where laboratory confirmation of disease is infrequent. However, under-reporting of diseases is less likely to be a concern for those diseases under elimination (i.e., polio, measles, rubella and CRS/CRI) due in part to the high profile of these diseases and strong laboratory and healthcare reporting to public health.
Data for most of the surveillance systems are not received from provinces and territories in real time, nor are most cases reported at the national level linked with laboratory and epidemiological data. Outbreak surveillance data are not available nationally for any of the VPDs (except for measles, rubella, and IMD). Detailed case vaccination history, manifestations, and mortality information is not available for VPDs where data were obtained through CNDSS.
Case-level data available from CNDSS was not available for Prince Edward Island from 2001 to 2009 and for Northwest Territories, Nova Scotia, Newfoundland, New Brunswick, and Manitoba from 2001 to 2017. The populations of these jurisdictions were removed from the IPD incidence rate calculations where case-level data were used exclusively. Data from the remaining provinces and territories represents approximately 90% of the Canadian population.
As death data available through Statistics Canada has not been validated, this information was not presented in this report.
The limitations of the coverage data obtained from cNICS and The Seasonal Influenza Vaccination Coverage Survey have been documented elsewhere Footnote 19,Footnote 41.
References
- Footnote 1
-
Public Health Agency of Canada. Brief report: Hepatitis B infection in Canada. Ottawa (ON): PHAC; 2011.; Available at: http://www.phac-aspc.gc.ca/id-mi/pdf/hepB-eng.pdf. Accessed February 20, 2017.
- Footnote 2
-
Ehreth J. The value of vaccination: A global perspective. Vaccine 2003;21:4105.
- Footnote 3
-
Centers for Disease Control and Prevention (CDC). Appendix: Methods for the cost-benefit analyses presented in "Benefits from immunization during the vaccines for children program era - United States, 1994-2013". MMWR 2014;63:352.
- Footnote 4
-
Public Health Agency of Canada. Poliomyelitis (polio) surveillance. Ottawa (ON): PHAC; 2014. Available at: https://www.canada.ca/en/public-health/services/diseases/poliomyelitis-polio/surveillance.html
- Footnote 5
-
Public Health Agency of Canada. Elimination of measles, rubella and congenital rubella syndrome in Canada, Documentation and Verification Report. Ottawa (ON): PHAC; 2011.
- Footnote 6
-
Booth TF, Grudeski E, McDermid A, Rotondo J. The polio eradication endgame: Why immunization and continued surveillance is critical. Can Commun Dis Rep 2015;41(10).
- Footnote 7
-
Public Health Agency of Canada. Vaccination coverage goals and vaccine preventable disease reduction targets by 2025. Ottawa (ON): PHAC; 2019; Available at: https://www.canada.ca/en/public-health/services/immunization-vaccine-priorities/national-immunization-strategy/vaccination-coverage-goals-vaccine-preventable-diseases-reduction-targets-2025.html. Accessed 07/25, 2021.
- Footnote 8
-
Varughese PV, Acres SE. Measles in Canada: Surveillance summary. Can Commun Dis Rep 1979;5:121.
- Footnote 9
-
Varughese PV, Acres SE. Measles in Canada - 1986. CMAJ 1987;136(11):1183.
- Footnote 10
-
Public Health Agency of Canada. Canadian immunization guide, 7th Edition. Ottawa (ON) PHAC; 2006.
- Footnote 11
-
Public Health Agency of Canada. Highlights from the 2019 childhood national immunization coverage survey (cNICS). Ottawa (ON): PHAC; 2021; Available at: https://www.canada.ca/en/public-health/services/publications/vaccines-immunization/2019-highlights-childhood-national-immunization-coverage-survey.html. Accessed 07/05, 2021.
- Footnote 12
-
Macey JF, Tam T, Lipskie T, Tipples G, EisBrenner T. Rubella elimination, the Canadian experience. J Infect Dis 2011;204(suppl_2):S585.
- Footnote 13
-
Lim G, Harris T, Desai S, Crowcroft N, Mazzulli T, Kozlowski T, et al. Rubella immunity among prenatal women in Ontario, 2006-2010. BMC Infect Dis 2013 2 August 2013;13(362).
- Footnote 14
-
Lai FY, Dover DC, Lee B, Fonseca K, Solomon N, Plitt SS, et al. Determining rubella immunity in pregnant Alberta women 2009-2012. Vaccine 2015;33(5):635-641.
- Footnote 15
-
Gilbert N, Rotondo J, Shapiro J, Sherrard L, Fraser W, Ward B. Seroprevalence of rubella antibodies and determinants of susceptibility to rubella in a cohort of pregnant women in Canada, 2008-2011. Vaccine 2017 May 25;35(23):3050-3055.
- Footnote 16
-
World Health Organization. Poliomyelitis. Geneva (CH): WHO; 2019. https://www.who.int/news-room/fact-sheets/detail/poliomyelitis.
- Footnote 17
-
Dickson C, Fane BH, Squires SG. Acute flaccid myelitis (AFM) in Canada. Can Commun Dis Rep 2020 Oct 1;46(10).
- Footnote 18
-
Pan American Health Organization (PAHO). Region of the Americas eliminates maternal and neonatal tetanus. Washington (DC): PAHO; 2017; Available at: https://www.paho.org/hq/index.php?option=com_content&view=article&id=13696:americas-eliminates-maternal-neonatal-tetanus&Itemid=1926&lang=en. Accessed 07/25, 2021.
- Footnote 19
-
Public Health Agency of Canada. Vaccine uptake in Canadian adults. Results from the 2018-2019 Seasonal Influenza Vaccination Coverage Survey. Ottawa (ON); PHAC; 2019. https://www.canada.ca/en/public-health/services/publications/healthy-living/2018-2019-influenza-flu-vaccine-coverage-survey-results.html
- Footnote 20
-
National Advisory Committee on Immunization (NACI). Update on the invasive meningococcal disease and meningococcal vaccine conjugate recommendations. Can Commun Dis Rep 2009;35(ACS-3).
- Footnote 21
-
Katz SL, King K, Varughese P, De Serres G, Tipples G, Waters J, et al. Measles elimination in Canada. J Infect Dis 2004;189(S1):S236-S242.
- Footnote 22
-
Saboui M, Squires SG. Outbreaks of mumps in Canada, 2016-2018. Can Commun Dis Rep 2020 Nov 5;46(11/12).
- Footnote 23
-
Barreto L, Van Exan R, Rutty C. The challenge of whooping cough: Canada's role in the development of pertussis vaccines. 2006.
- Footnote 24
-
Cutcliffe N. Building on the legacy of vaccines in Canada: Value, opportunities, and challenges. Ottawa (ON); BIOTECanada: 2010.
- Footnote 25
-
Public Health Agency of Canada. Update on immunization in pregnancy with Tdap vaccine. An advisory committee statement (ACS). National Advisory Committee on Immunization (NACI). Ottawa (ON); PHAC: 2018.; Available at: https://www.canada.ca/en/public-health/services/publications/healthy-living/update-immunization-pregnancy-tdap-vaccine.html. Accessed 07/20, 2021.
- Footnote 26
-
Public Health Agency of Canada. Pneumococcal vaccine: Canadian immunization guide. Ottawa (ON); PHAC: 2016. https://www.canada.ca/en/public-health/services/publications/healthy-living/canadian-immunization-guide-part-4-active-vaccines/page-16-pneumococcal-vaccine.html
- Footnote 27
-
Public Health Agency of Canada. Update on the use of pneumococcal vaccines in adults 65 years of age and older - A public health perspective. An advisory committee statement (ACS). National Advisory Committee on Immunization (NACI). Ottawa (ON); PHAC: 2018; Available at: https://www.canada.ca/en/public-health/services/publications/healthy-living/update-on-the-use-of-pneumococcal-vaccines-in-adult.html#a6. Accessed 10/20, 2021.
- Footnote 28
-
National Advisory Committee on Immunization (NACI). Statement on the recommended use of pneumococcal conjugate vaccine. Can Commun Dis Rep 2002;28(ACS-2).
- Footnote 29
-
Kellner JD, Vanderkooi OG, MacDonald J, Church DL, Tyrrell GJ, Scheifele DW. Changing epidemiology of invasive pneumococcal disease in Canada, 1998-2007: Update from the Calgary-Area Streptococcus pneumoniae Research (CASPER) Study. Clin Infect Dis 2009;49(2):205-212.
- Footnote 30
-
Data was not available for British Columbia (1993 to 2017), Saskatchewan (1996 to 1997, 2001 to 2015), Manitoba (1991 to 2017), Ontario (1991 to 1992, 2009 to 2010), Quebec (1991 to 2017), Newfoundland and Labrador (2015 to 2017), Nova Scotia (1998 to 2017) and Yukon (2009 to 2012). Reporting of cases in Nunavut began in 2000. Under-reporting of varicella was noted by Ontario for their jurisdiction.
- Footnote 31
-
Weinberger DM, Malley R, Lipsitch M. Serotype replacement in disease after pneumococcal vaccination. The Lancet 2011;378(9807):1962-1973.
- Footnote 32
-
Tyrrell GJ, Lovgren M, Chui N, Minion J, Garg S, Kellner JD, et al. Serotypes and antimicrobial susceptibilities of invasive Streptococcus pneumoniae pre- and post-seven valent pneumococcal conjugate vaccine introduction in Alberta, Canada, 2000-2006. Vaccine 2009;27(27):3553-3560.
- Footnote 33
-
Demczuk W, Griffith A, Singh R, Martin I, Gilmour M. National Laboratory surveillance of Streptococcus pneumoniae and Streptococcus pyogenes In Canada Annual Summary 2010. 2010.
- Footnote 34
-
Public Health Agency of Canada (PHAC). National Surveillance of Invasive Streptococcus pneumoniae and Streptococcus pyogenes in Canada - Annual Summary 2012. Ottawa (ON); PHAC; 2013.
- Footnote 35
-
Public Health Agency of Canada (PHAC). National Laboratory Surveillance of Invasive Streptococcal Disease in Canada - Annual Summary 2018. Ottawa (ON); PHAC; 2019.
- Footnote 36
-
Squires SG, Pelletier L. Publicly-funded influenza and pneumococcal immunization programs in Canada: A progress report. Can Commun Dis Rep 2000;26(17):141.
- Footnote 37
-
Waye A, Jacobs P, Tan B. The impact of the universal infant varicella immunization strategy on Canadian varicella-related hospitalization rates. Vaccine 2013;31(42):4744.
- Footnote 38
-
Public Health Agency of Canada. Case definitions: Nationally notifiable diseases. Ottawa (ON); PHAC: 2021; Available at: https://diseases.canada.ca/notifiable/diseases-list. Accessed 06/10, 2021.
- Footnote 39
-
Statistics Canada. Population estimates 0-100+ October Canada - Province-Territory 1971-2020. 2021. Ottawa (ON); Stats Can: 2018.
- Footnote 40
-
Public Health Agency of Canada. Notifiable diseases online. Ottawa (ON); PHAC: 2020; Available at: https://diseases.canada.ca/notifiable/. Accessed 06/11, 2021.
- Footnote 41
-
Public Health Agency of Canada. Childhood national immunization coverage survey, 2017. Ottawa (ON); PHAC: 2019; Available at: https://www150.statcan.gc.ca/n1/daily-quotidien/190326/dq190326d-eng.htm. Accessed 06/07, 2019.
Endnotes
- Footnote 1
-
Diseases with programs to reduce incidence to zero - includes measles, rubella, congenital rubella syndrome/congenital rubella infection, and polio.
- Footnote 2
-
Annual incidence rate < 1 case per 100,000 population - includes diphtheria, tetanus, invasive disease due to Haemophilus influenzae serotype b, invasive meningococcal disease, and mumps.
- Footnote 3
-
Annual incidence rate ≥ 1 case per 100,000 population - includes pertussis, IPD, and varicella.
- Footnote 4
-
Ages were unknown for twenty-five cases and were therefore not included.
- Footnote 5
-
The pre-vaccine era is defined as the five years before vaccine introduction, or the closest possible five years to when stable reporting occurs. For measles, this was 1950 to 1954. The measles live vaccine was authorized in Canada in 1963 and all provinces and territories had a measles vaccine program by 1983. Measles was taken off the notifiable diseases list from 1959 to 1968 with decreased physician reporting in the years leading up to 1959, thus 1954 was chosen as the last year with reliable data that could be used in comparisons.
- Footnote 6
-
Measles was removed from the list of national notifiable diseases for the years 1959 to 1968 with decreased physician reporting in the years leading up to 1959.
- Footnote 7
-
The difference in coverage estimates in children seven years of age, between rubella, measles and mumps is due to the number of doses required to be considered vaccinated. One dose of rubella vaccine is required by seven years of age compared to two doses of measles and mumps vaccine.
- Footnote 8
-
The pre-vaccine era is defined as the five years before vaccine introduction, or the closest possible five years to when stable reporting occurs. For rubella, this was 1950 to 1954. The rubella vaccine was authorized in Canada in 1969 and all provinces and territories had a rubella vaccine program by 1983. Rubella was taken off the notifiable disease list from 1959 to 1968 with decreased physician reporting in the years leading up to 1959, thus 1954 was chosen as the last year with reliable data that could be used in comparisons.
- Footnote 9
-
Rubella was removed from the list of national notifiable diseases for the years 1959 to 1968.
- Footnote 10
-
The pre-vaccine era is defined as the five years before vaccine introduction, or the closest possible five years to when stable reporting occurs. For rubella, this was 1950 to 1954. The rubella vaccine was authorized in Canada in 1969 and all provinces and territories had a rubella vaccine program by 1983. Rubella was taken off the notifiable disease list from 1959 to 1968 with decreased physician reporting in the years leading up to 1959, thus 1954 was chosen as the last year with reliable data that could be used in comparisons.
- Footnote 11
-
The pre-vaccine era is defined as the five years before vaccine introduction, or the closest possible five years to when stable reporting occurs. For polio, this was 1950 to 1954, as the inactivated polio vaccine was authorized in Canada in 1955.
- Footnote 12
-
AFP has been nationally notifiable in Canada since 1996.
- Footnote 13
-
The pre-vaccine era is defined as the five years before vaccine introduction, or the closest possible five years to when stable reporting occurs. For diphtheria, this was 1925 to 1929. Although the diphtheria toxoid was introduced in 1926, routine immunization began in 1930.
- Footnote 14
-
The pre-vaccine era is defined as the five years before vaccine introduction, or the closest possible five years to when stable reporting occurs. For tetanus, this was 1935 to 1939. Tetanus toxoid was introduced in Canada in 1940 but national reporting began in 1957. Thus, reported tetanus deaths were used instead of cases for the years preceding vaccine introduction.
- Footnote 15
-
Tetanus was added to the list of nationally notifiable diseases in 1957. Reported tetanus deaths were used instead of cases for the years 1935 to 1956.
- Footnote 16
-
The pre-vaccine era used for invasive disease due to Hib was 1986 to 1987. Although Hib vaccines were first introduced in 1986 and the Hib conjugate vaccine was introduced in 1992, national notifiable disease reporting of invasive Hib disease did not begin until 1986.
- Footnote 17
-
Northern Canada includes Yukon, Northwest Territories, Nunavut, Quebec Cree, Quebec Nunavik and northern Labrador. Rates for the rest of Canada exclude cases reported in those six regions.
- Footnote 18
-
A Hib case is considered preventable if it occurs in an infant who was age-eligible to have completed the primary Hib vaccination schedule (three doses) but who was unvaccinated or under-vaccinated for age. Vaccine failures are not considered preventable.
- Footnote 19
-
The pre-vaccine era is defined as the five years before vaccine introduction, or the closest possible five years to when stable reporting occurs. For IMD, this was 1997 to 2001, as the meningococcal C conjugate vaccine was introduced in all provinces and territories between 2002 and 2007.
- Footnote 20
-
The "Other" category includes serogroup A, 29E, X, Z, non-groupable and unknown serogroup.
- Footnote 21
-
Age was unknown for one case, therefore it was not included.
- Footnote 22
-
The pre-vaccine era is defined as the five years before vaccine introduction, or the closest possible five years to when stable reporting occurs. For mumps, this was 1950 to 1954. The mumps vaccine was authorized in Canada in 1969 and all provinces and territories had a mumps vaccine program by 1983. Mumps was taken off the notifiable disease list from 1959 to 1985 with decreased physician reporting in the years leading up to 1959, thus 1954 was chosen as the last year with reliable data that could be used in comparisons.
- Footnote 23
-
Mumps was removed from the list of national notifiable diseases for the years 1959 to 1985.
- Footnote 24
-
The pre-vaccine era is defined as the five years before vaccine introduction, or the closest possible five years to when stable reporting occurs. For pertussis, this was 1938 to 1942, as the whole cell pertussis vaccine was authorized in Canada in 1943.
- Footnote 25
-
Ages were unknown for nine cases, therefore they were not included.
- Footnote 26
-
Northern Canada includes Yukon, Northwest Territories, Nunavut, Quebec Cree, Quebec Nunavik and northern Labrador. Rates for the rest of Canada exclude cases reported in those six regions.
- Footnote 27
-
Excluded 2000 because ON started reporting in 2001.
- Footnote 28
-
Data was not available for Prince Edward Island from 2001 to 2009 and for Northwest Territories, Nova Scotia, Newfoundland, New Brunswick, and Manitoba from 2001 to 2019. Therefore, the population for these provinces and territories were excluded in the calculation on incidences rates for children less than two years of age and adults 65 years of age and over, depending on the corresponding year.
- Footnote 29
-
The pre-vaccine era is defined as the five years before vaccine introduction, or the closest possible five years to when stable reporting occurs. For varicella, this was 1993 to 1997, as the first varicella vaccine was approved for use in Canada in 1998.
- Footnote 30
-
Data was not available for British Columbia (1993 to 2017), Saskatchewan (1996 to 1997, 2001 to 2015), Manitoba (1991 to 2017), Ontario (1991 to 1992, 2009 to 2010), Quebec (1991 to 2017), Newfoundland and Labrador (2015 to 2017), Nova Scotia (1998 to 2017) and Yukon (2009 to 2012). Reporting of cases in Nunavut began in 2000. Under-reporting of varicella was noted by Ontario for their jurisdiction.
- Footnote 31
-
Ages were unknown for two cases and were therefore not included.
- Footnote 32
-
Vaccine eligible children include children aged one to 17 who are not immunocompromised and are either not vaccinated or have an unknown vaccination status for varicella.