
2018–19 Departmental Results Report - Treasury Board of Canada Secretariat
On this page

Ministers’ message

President of the Treasury Board

Minister of Digital Government
We are pleased to present the Departmental Results Report for the Treasury Board of Canada Secretariat (TBS) for the 2018–19 fiscal year.
During the last fiscal year, TBS made progress in a number of areas in its ongoing work for Canada and Canadians. For example, we advanced regulatory cooperation between the federal government and other jurisdictions in Canada and internationally. This included signing a Memorandum of Understanding with the United States to strengthen the cooperation needed to address regulatory challenges and improve business investment between our two countries.
We also introduced the Cabinet Directive on Regulations, which ensures regulations promote innovation and economic growth, while protecting the environment and the social and economic well-being of Canadians.
In Open Government, TBS led Canada’s chairmanship of the international Open Government Partnership, and worked with other federal departments to add 3,000 more data sets to open.canada.ca.
In addition, we published the new Policy on Service and Digital, which comes into effect and establishes the foundation for the transition to digital government in Canada. We also launched the Directive on Automated Decision-making to guide departments in the accountable use of Artificial Intelligence.
The Canadian Digital Service, which has been up and running since 2017, has recruited top digital talent into government, and has partnered with several departments and agencies to improve services to Veterans, Canadians with disabilities, low-income Canadians, and others. We also initiated a two-year Privacy Breach Action Plan to strengthen the protection of personal information and the management of privacy breaches across the government.
In people management, we saw increased representation in executive positions by members of visible minorities, women and Indigenous peoples and established the Office of Public Service Accessibility. We also put forward amendments to the Official Languages Regulations to improve access to federal services in both official languages.
As a final example of our efforts, we have initiated the development of a modern, user-friendly, human resources and pay solution for the dedicated federal public servants who serve Canadians every day.
We invite you to read this report and discover for yourselves the many ways TBS works to improve our government, our business environment and our climate for the benefit of all Canadians.
Original signed by:
The Honourable Jean-Yves Duclos, P.C., M.P.
The President of the Treasury Board
Original signed by:
The Honourable Joyce Murray P.C., M.P.
The Minister of Digital Government
Results at a glance
The Treasury Board is the committee of Cabinet that acts as the government’s management board. The Treasury Board of Canada Secretariat (TBS) is the central agency that serves as the administrative arm of the Treasury Board.
TBS has 4 Core Responsibilities.Footnote 1
-
Spending oversight
TBS reviews government programs, spending proposals, and spending authorities; and it reports to Parliament and Canadians on departments’ planned and actual spending and results.
-
Administrative leadership
TBS sets the strategic direction for federal government administration in areas such as service delivery and access to government information, as well as the management of assets, finances, information, and technology. It also supports departments’ efforts to make government greener and to improve digital services.
-
Employer
TBS sets the strategic direction for managing people in the public service. This encompasses workplace policies and services, employment conditions and labour relations, pensions and benefits, executive and leadership development, and people management systems and processes.
-
Regulatory oversight
TBS sets the strategic direction for regulatory practices in the federal government. It also reviews proposed regulations; coordinates targeted regulatory reviews; and promotes good regulatory practices, including regulatory cooperation across jurisdictions.
Although TBS plays a central leadership role in setting administrative policy and in supporting the Treasury Board, deputy heads are accountable for managing their departments.Footnote 2
Performance summary
In carrying out its Core Responsibilities in 2018–19, TBS:
- sought to achieve 15 departmental resultsFootnote 3
- measured its progress toward achieving those results using 37 indicators
Targets were set for 29 of these indicators. Of these indicators:
- 11 met their target (for example, indicators related to open data and regulatory cooperation).
- 10 related to targets to be achieved by dates after (for example, an indicator related to reducing the federal governments’ greenhouse gas emissions).
- 6 did not meet their target. These results reflect situations where TBS is still working with departments to meet Canadians’ high expectations of government (for example, indicators related to the clarity of reporting on government spending).
- 2 had targets that could not be compared with the 2018–19 results because of changes in how the indicators were measured (both indicators relate to harassment in the public service).Footnote 4
In 2018–19, 8 TBS performance indicators had no target established. These indicators were new, and TBS did not set targets because it was collecting baseline data for them in 2018–19.
Figure 1 shows TBS’s progress on its performance indicators for 2018–19, as of .
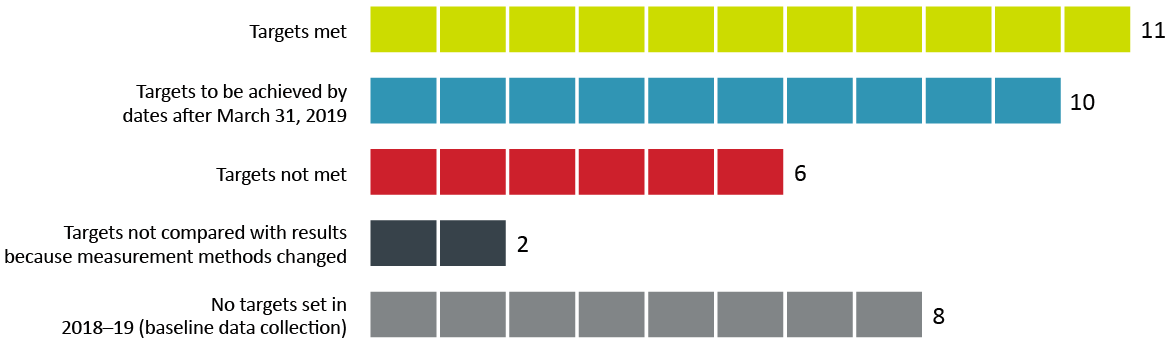
Figure 1 - Text version
| Progress | Number of indicators |
|---|---|
| Targets met | 11 |
| Targets to be achieved by dates after | 10 |
| Targets not met | 6 |
| Targets not compared with results because measurement methods changed | 2 |
| No targets set in 2018–19 (baseline data collection) | 8 |
In working toward these results, in 2018–19, TBS’s total actual spending was $6,155,857,445, and its total actual full‑time equivalents was 2,111.
For more information on TBS’s plans, priorities and results achieved, see the “Results: what we achieved” section of this report.
Results: what we achieved
This section describes TBS’s Core Responsibilities, the results that TBS aimed to achieve in relation to them in 2018–19, and how TBS performed against the related targets it set in its 2018–19 Departmental Plan.
Core Responsibilities
Spending Oversight
Description
- Review spending proposals and authorities
- Review existing and proposed government programs for efficiency, effectiveness and relevance
- Provide information to Parliament and Canadians on government spending
Results
In 2018–19, TBS aimed to achieve 4 results in exercising its Spending Oversight responsibility:
- Departments achieve measurable results
- Treasury Board proposals contain information that helps Cabinet ministers make decisions
- Budget initiatives are approved for implementation quickly
- Reporting on government spending is clear
The following provides details on those results.
Departmental result 1 for Spending Oversight: departments achieve measurable results
Context
TBS sets policy requirements in the area of results‑based management. It also provides guidance to departments to help them:
- determine performance indicators for their departmental results, programs, and spending proposals
- set ambitious but achievable targets for those indicators
- review their spending so that it is aligned with government priorities and is used for programs that achieve results
In 2018–19, most departments were reporting for the first time on their performance in relation to the indicators that were established as part of their new Departmental Results Frameworks.Footnote 5
2018–19 actual results
In cases where targets were specified and actual results reported for departmental result indicators, departments met 71 % of their 2018–19 targets. This rate is up from 65% the previous year and falls within the target of between 70% and 80%, which indicates that departments are setting targets that are ambitious, yet achievable.
| Performance indicator | Target | Date to achieve target | 2018–19 Actual results |
2017–18 Actual results |
2016–17 Actual results |
|---|---|---|---|---|---|
| Percentage of departmental results indicators for which targets are achieved | Between 70% and 80% | Annually | 71% | 65% | 69% |
Departmental result 2 for Spending Oversight: Treasury Board proposals contain information that helps Cabinet ministers make decisions
Context
TBS works with federal departments when they prepare proposals (for example, for new programs or new spending) for submission to the Treasury Board. TBS ensures that these proposals:
- align with Treasury Board policies and government priorities
- support value for money
- clearly explain the results that will be achieved and how those results will be measured
- contain clear assessments of risk, including financial risk
2018–19 actual results
TBS reviews the degree to which Treasury Board submissions transparently disclose financial risk. In 2018–19, it found that 45% of submissions did transparently disclose financial risk, up from 13% the previous year. Two factors are believed to account for this improvement:
- Some departments that have many large projects have increased their internal costing capacity.
- TBS is working with departments earlier in the development of program and project proposals to help them identify and document financial risks.
In its 2019–20 Departmental Plan, TBS set a target of 75% of Treasury Board submissions transparently disclosing financial risk by 2023. In pursuit of this target, TBS provided updated guidance to departments on how to present cost information. The new guidance focuses on how to build comprehensive, well‑documented cost estimates.
| Performance indicator | Target | Date to achieve target | 2018–19 Actual results |
2017–18 Actual results |
2016–17 Actual results |
|---|---|---|---|---|---|
| Degree to which Treasury Board submissions transparently disclose financial risk | No target set for 2018–19 as baseline data was being collectedFootnote 6 | 45%Footnote 7 | 13% | Not assessed | |
Departmental result 3 for Spending Oversight: Budget initiatives are approved for implementation quickly
Context
The annual Budget outlines the government’s spending priorities. The Estimates documents (the Main Estimates and Supplementary Estimates), which are prepared by TBS, detail how each department plans to spend money to carry out those priorities.
In the past, the Main Estimates were tabled in Parliament before the Budget was tabled, which meant that departments had to delay implementing initiatives announced in the Budget because spending for them had not yet been authorized in an Estimates document.
2018–19 actual results
In 2017, the House of Commons approved a 2‑year pilot initiative to allow the Main Estimates to be tabled after the Budget so that they would incorporate Budget initiatives. The aim of the pilot was to make financial reporting clear and consistent, and to make funding available to departments in a timely manner.
For both Budget 2018 and Budget 2019, 100% of Budget initiatives were included in the Main Estimates.
| Performance indicator | Target | Date to achieve target | 2018–19 Actual results |
2017–18 Actual results |
2016–17 Actual results |
|---|---|---|---|---|---|
| Percentage of budget initiatives included in the next available Estimates | 100% | 100% of initiatives were included in the next available Estimates | 40% of Budget 2017 initiatives were included in the next available Estimates | 66% of Budget 2016 initiatives were included in the next available Estimates |
Departmental result 4 for Spending Oversight: reporting on government spending is clear
Context
Departments provide overviews of their results and spending through their Departmental Plans and Departmental Results Reports, which are tabled in Parliament and published online. To help make reporting on government spending clear, TBS provides departments with guides and templates for preparing these documents.
Departments also provide more detailed information through the GC InfoBase, an interactive and publicly accessible website managed by TBS.
2018–19 actual results
As part of its efforts to improve Departmental Plans and Departmental Results Reports, in 2018–19, TBS began surveying online readers about the usefulness of these documents. The average rating was 3.3 out of 5, which was below the target of 4.
To improve this rating, TBS worked with departments to address survey participants’ comments and to find ways to make the documents more useful to readers (for example, by using simpler language, by setting clearer targets, and by providing clearer links to program information in GC InfoBase). TBS’s guides and templates for the 2020–21 Departmental Plans incorporated the feedback received.
TBS also surveys GC InfoBase users on whether they found the information they were looking for. In 2018–19, the average rating was 3.2 out of 5, below the target of 4, and down from 3.9 in 2017–18.
To improve this result, TBS will:
- do user testing to find ways to make GC InfoBase more user-friendly so that users can find what they need more easily
- explore ways to add datasets in areas where users have expressed interest (for example, services, horizontal initiatives, transfer payments, people management)
| Performance indicators | Target | Date to achieve target | 2018–19 Actual results |
2017–18 Actual results |
2016–17 Actual results |
|---|---|---|---|---|---|
| Degree to which visitors to online departmental planning and reporting documents found the information useful | Average rating: 4 out of 5 |
Average rating: 3.3 out of 5 |
Not assessed (User survey implemented with tabling of 2018–19 Departmental Plans) |
Not assessed | |
| Degree to which GC InfoBase users found the spending information they sought | Average rating: 4 out of 5 |
Average rating: 3.2 out of 5 |
Average rating: 3.9 out of 5Footnote 8 |
Not assessed |
Budgetary financial and human resources for Spending Oversight
| 2018–19 Main Estimates |
2018–19 Planned spending |
2018–19 Total authorities available for use |
2018–19 Actual spending (authorities used) |
2018–19 Difference (Actual spending minus Planned spending) |
|---|---|---|---|---|
| 10,662,340,900 | 10,662,340,900 | 3,852,437,596 | 42,146,978 | -10,620,193,622 |
The variance between planned and actual spending in relation to this Core Responsibility is mainly attributable to the way government‑wide funds are transferred between TBS and other government organizations.
Every year, TBS includes in its reference levels funding that is to be transferred to other government organizations once specific criteria that have been approved by the Treasury Board are met. If these funds are needed, they are transferred to the appropriate department. If they are not needed, the unused balance is returned to the fiscal framework at the end of the fiscal year and is reported as a TBS lapse. TBS does not incur any actual spending under government‑wide funds.
| 2018–19 Planned full-time equivalents |
2018–19 Actual full-time equivalents |
2018–19 Difference (Actual full-time equivalents minus Planned full‑time equivalents) |
|---|---|---|
| 316 | 309 | -7 |
Financial, human resources and performance information for TBS’s Program InventoryFootnote 9 is available in the GC InfoBase.
Administrative Leadership
Description
- Lead government‑wide initiatives
- Develop policies and set the strategic direction for government administration related to:
- service delivery
- access to government information
- the management of assets, finances, information, and technology
Results
In 2018–19, TBS aimed to achieve 5 results in exercising its Administrative Leadership responsibility:
- Canadians have timely access to government information
- Government service delivery meets the needs of Canadians
- Government promotes good asset and financial management
- Technology enhances the effectiveness of government operations
- Government demonstrates leadership in making its operations low‑carbon
The following provides details on those results.
Departmental result 1 for Administrative Leadership: Canadians have timely access to government information
Context
TBS works with federal government organizations to add datasets to open.canada.ca, the open government portal. In 2018, Canada ranked number 1 in the world on the Open Data Barometer (tied with the United Kingdom).
In addition, in support of government institutions’ efforts to provide Canadians with information that they specifically request, TBS tracks the degree to which institutions respond to Canadians’ access to information requests and personal information requests within legislated timelines.
2018–19 actual results
To measure its progress toward achieving this result, TBS uses indicators that relate to open data and to personal information requests and access to information requests.
Open data
In 2018–19, 3,168 new datasets were published on open.canada.ca, up from 1,807 the previous year and surpassing the target of 2,000.
Personal information requests and access to information requests
In 2018–19, the percentage of personal information requests responded to within legislated timelines was 77%, up from 75% the previous year. At the same time, the percentage of access to information requests responded to within legislated timelines was 73%, down from 76% the previous year. The targets for these indicators are, respectively, 85% and 90%, by .
Although the percentage of access to information requests responded to within legislated timelines dropped in 2018–19, the number of requests closed increased substantially, from 97,705 in 2017–18 to 125,067 in 2018–19, with fewer requests being carried over to the next fiscal year (25,746 compared with 27,375 the previous year). The downward trend in the percentage of access to information requests responded to within legislated timelines reflects the pressures on the access to information program from the continuing increase in the number of requests the government receives each year.
As noted in the 2019–20 Departmental Plan, TBS continues to explore ways to increase support to the offices that respond to access to information and personal information requests by, for example, coordinating staffing and training.
In addition, the new Access to Information and Privacy Online Request Service, launched in 2018, is expected to contribute to better results in this area. The new service is helping reduce misdirected requests for government information by helping requesters determine which institution is most likely to have the information they want. As well, the service collects the $5 fee for access to information requests submitted electronically. As a result, institutions have a lighter administrative burden and can focus on responding to requests. By 2021, all government institutions that are subject to the Access to Information Act and the Privacy Act will receive requests through this service.
To further support improved access to government information, Bill C‑58, which received Royal Assent in , included a number of measures intended to improve access to information services. For example, the Access to Information Act now provides the Information Commissioner with the power to make binding orders to government institutions, transforming the role from an ombudsperson to an authority with the ability to order government to release records. The act also puts into practice the principle of “open by default” in the digital age by making key information available proactively, without the need to make a request.
| Performance indicators | Target | Date to achieve target | 2018–19 Actual results |
2017–18 Actual results |
2016–17 Actual results |
|---|---|---|---|---|---|
| Number of datasets available to the public | At least 2,000 new non-geospatial datasets | 3,168 new datasets published (11,340 total non‑geospatial datasets available in 2018–19 on open.canada.ca)Footnote 10 |
1,807 new datasets published (12,039 total non‑geospatial datasets available in 2017–18 on open.canada.ca) |
2,079 new datasets published (10,232 total non‑geospatial datasets available in 2016–17 on open.canada.ca) |
|
| Percentage of personal information requests responded to within established timelines | At least 85% | 77% | 75% | 80.4% | |
| Percentage of access to information requests responded to within established timelines | At least 90% | 73% | 76% | 80.7% |
Departmental result 2 for Administrative Leadership: government service delivery meets the needs of Canadians
Context
TBS sets the strategic direction for government service design and delivery. The objective is for departments to make:
- services across all channels (for example, in person, phone, online) easy to use and responsive to the needs of Canadians
- more services available online
In 2018–19, this strategic direction was provided by the Policy on Service.
As well, the Canadian Digital Service, within TBS, offers hands‑on assistance to departments to help them design simple, easy‑to‑use services.
2018–19 actual results
In 2018–19, 74% of Government of Canada priority servicesFootnote 11 were available online, up from 62% the previous year. This increase aligns with the Policy on Service, which requires departments to annually increase the proportion of their services that are available online.
In 2018–19, the percentage of priority services that met their service standard (69%) was about the same as in the previous year (70%). Departments adjust their service standards annually, in some cases setting more challenging standards. These adjustments align with the Guideline on Service Standards, which advises that standards should be relevant to clients, ambitious but realistic, and continually updated. The target is 80% by .
To foster improvement in this area, TBS is expanding requirements for departments to report performance information for their services. The aim is to help departments more easily see where they are meeting service standards and where they should increase their efforts.
| Performance indicators | Target | Date to achieve target | 2018–19 Actual results |
2017–18 Actual results |
2016–17 Actual results |
|---|---|---|---|---|---|
| Percentage of Government of Canada priority services available onlineFootnote 12 | No target set for 2018–19 as baseline data was being collectedFootnote 13 | 74% | 62% | Not assessed | |
| Degree to which clients are satisfied with the delivery of Government of Canada services (expressed as a score between 1 and 100)Footnote 14 | At least 60 | Footnote 15 |
Canadians were not asked this question in 2018–19 Results of the next survey expected by |
58 | Canadians were not asked this question in 2016–17 |
| Percentage of priority services that meet service standard | At least 80% | 69% | 70% | 85% | |
Departmental result 3 for Administrative Leadership: government promotes good asset and financial management
Context
TBS sets the strategic direction for financial and asset management practices in the federal government, and provides guidance, tools, and advice to departments. In 2018–19, the strategic direction for financial management was provided by the Policy on Financial Management, and the strategic direction for asset management was provided by the Policy Framework for the Management of Assets and Acquired Services.Footnote 16
2018–19 actual results
Financial management
TBS assesses departments’ financial management practices, including their management of their internal controls, through the Management Accountability Framework.
By 2017–18, 97% of assessed departments had tested their internal controls over financial reporting and had plans to implement ongoing monitoring of the controls. This percentage represented all assessed departments except for one. TBS will continue to review the remaining department’s progress until it starts ongoing monitoring.
Asset management
In 2018–19, TBS assessed 11 departments that, together, are responsible for the majority of federal assets, to determine whether they effectively maintain and manage their assets over their life cycle.Footnote 17 The assessment was done through the Management Accountability Framework using a composite indicator.
TBS found that 55% of these departments (6 out of 11) met the criteria for the indicator, down from 80% in 2017–18 (which represented 8 of the 10 departments assessed that year). This decline resulted from a general increase in reports of assets being in poor or critical condition, as well as from other issues, such as a lack of data from some departments on the rate at which they reinvest in their built assets.
Given that real property makes up most of the value of federal assets, to support improvement in this area, TBS is developing a directive to introduce new requirements for departments. For example, TBS is considering including requirements in the directive for departments to have in place:
- a portfolio-level real property strategy that takes into account considerations such as program demands; the nature and condition of built assets; and financial, policy, and regulatory constraints
- a senior designated official for real property, who will create and oversee the department’s real property management framework, support staff, and advise the deputy on real property practices
The aim is to increase strategic decision-making and accountability in this area.
| Performance indicators | Target | Date to achieve target | 2018–19 Actual results |
2017–18 Actual results |
2016–17 Actual results |
|---|---|---|---|---|---|
| Percentage of departments that have assessed all internal controls over financial reporting in high‑risk areas and annually realign, implement and monitor systems on internal control | 100% | 97% | 97% | 94% | |
| Percentage of departments that effectively maintain and manage their assets over their life cycle | No target set for 2018–19 as baseline data was being collectedFootnote 18 | 55% | 80% | Not assessed | |
Departmental result 4 for Administrative Leadership: technology enhances the effectiveness of government operations
Context
TBS sets the strategic direction for developing and delivering secure and reliable information technology (IT) in the federal government. In 2018–19, strategic direction in this area was provided by the Policy Framework for Information and Technology, and the more specific policies that fall under it.
2018–19 actual results
To measure this departmental result, TBS uses indicators that relate to the security, reliability, and overall health of IT.
IT security
Cyber risks were managed effectively for 94% of key IT systems in the federal government, which means that, for each system, the responsible department had assessed the risks and had granted the system formal authority to operate. This was up 1 percentage point from the previous year, but did not reach the target of 100%.
TBS will work with the departments that are responsible for the remaining 6% of IT systems to find out why some of them are operating without formal authority (for example, perhaps they are being phased out) and to identify appropriate measures to further improve on this result.
IT reliability
This indicator measures the percentage of departments that experienced a high degree of IT reliability. More specifically, it measures the percentage of departments supported by Shared Services Canada (SSC) that had fewer than 3 significant outages (longer than 4 hours) that affected key systems.
In 2018–19, 14% of departments supported by SSC had fewer than 3 significant outages, down from 48% the previous year. In other words, in 2018–19, fewer departments had a high degree of IT reliability (as defined by this indicator).
This decline may stem from 2 factors:
- an increase in the number of key systems that SSC supports (each additional system has the potential to have outages, which can then increase the total outages experienced by departments)
- an increase in the number of outages related to the Enterprise Mobile Device Management Service, which provides mobile services to all 44 departments supported by SSC (each outage may affect multiple departments)
SSC is implementing a new 3‑year strategy to improve how it manages its services. More information about this strategy and related initiatives may be found in SSC’s 2019–20 Departmental Plan. In future, TBS will not report on this indicator because it falls within the role of SSC and because SSC reports on similar indicators.
Overall health of IT
Overall, the degree to which departments are satisfied with the health of government IT has steadily increased, from 37% in 2016–17 to 59% in 2018–19. This result is based on a survey of departments and is a composite of four questions about departments’ perceptions of the service, security, value, and agility of government IT.
| Performance indicators | Target | Date to achieve target | 2018–19 Actual results |
2017–18 Actual results |
2016–17 Actual results |
|---|---|---|---|---|---|
| Percentage of information technology systems for which cyber risks are managed effectivelyFootnote 19 | 100% | 94% | 93% | 82% | |
| Percentage of departments that have fewer than 3 significant outages impacting key systems in a year | No target set for 2018–19 as baseline data was being collected | 14% | 48%Footnote 20 | Not assessed | |
| Degree to which departments are satisfied with the health of government’s information technology, expressed as a percentage | Year‑over-year improvement | Annually | 59% | 51% | 37% |
Departmental result 5 for Administrative Leadership: government demonstrates leadership in making its operations low‑carbon
Context
Through the Greening Government Strategy, TBS sets the strategic direction for the federal government’s transition to low‑carbon, climate‑resilient, and green operations; and for the reduction of the government’s greenhouse gas emissions. This work aligns with the Federal Sustainable Development Strategy.
2018–19 actual results
By the end of 2018–19, the government’s overall reduction in greenhouse gas emissions was 32.6% below 2005 levels, compared to 32% the previous year. The result indicates that departments took significant steps to reduce their emissions, particularly given that in 2018–19:
- more departments reported because the requirement was extended to include all departments that own significant numbers of vehicles and buildingsFootnote 21
- Canada experienced a hotter‑than‑average summer and a colder‑than‑average winter
The federal government continues to aim to achieve the target of reducing its overall greenhouse gas emissions by 40% below 2005 levels by 2030 (with an aspiration to achieve this target by 2025), and by 80% by 2050. In pursuit of this target, TBS is working with departments to implement the Greening Government Strategy. For example, it is coordinating federal efforts to reduce emissions from real property and fleet.
TBS is also funding the first group of projects under the Greening Government Fund, an initiative that aims to:
- provide funding for innovative projects in departments to reduce greenhouse gases in their operations
- promote and share innovative approaches to reducing greenhouse gas emissions
| Performance indicator | Target | Date to achieve target | 2018–19 Actual results |
2017–18 Actual results |
2016–17 Actual results |
|---|---|---|---|---|---|
| The level of overall government greenhouse gas emissions | Reduce greenhouse gas emissions by 40% below 2005 levels by , with an aspiration to achieve this target by , and by 80% by | (stretch target 2025) and |
32.6% below 2005 levels | 32% below 2005 levels | 28% below 2005 levels |
Budgetary financial and human resources for Administrative Leadership
| 2018–19 Main Estimates |
2018–19 Planned spending |
2018–19 Total authorities available for use |
2018–19 Actual spending (authorities used) |
2018–19 Difference (Actual spending minus Planned spending) |
|---|---|---|---|---|
| 74,523,877 | 74,523,877 | 107,908,627 | 106,239,277 | 31,715,400 |
| 2018–19 Planned full‑time equivalents |
2018–19 Actual full‑time equivalents |
2018–19 Difference (Actual full‑time equivalents minus Planned full‑time equivalents) |
|---|---|---|
| 509 | 669 | 160 |
Financial, human resources and performance information for TBS’s Program Inventory is available in the GC InfoBase.
Employer
Description
- Develop policies and set the strategic direction for people management in the public service
- Manage total compensation (including pensions and benefits) and labour relations
- Undertake initiatives to improve performance in support of recruitment and retention
Results
In 2018–19, TBS aimed to achieve 4 results in exercising its Employer responsibility:
- Public service is high‑performing
- Public service attracts and retains a diverse workforce
- Employee wellness is improved
- Modernized employment conditions
Departmental result 1 for Employer: public service is high‑performing
Context
TBS works with key stakeholders, including the Public Service Commission of Canada and the Canada School of Public Service, to support the Treasury Board as the employer of the public service. Although deputy heads are responsible for managing their own human resources, TBS monitors the progress against the policy objectives set by the employer and strives to ensure an appropriate degree of consistency in people management practices across the public service.
In support of a high‑performing public service, TBS sets the strategic direction for:
- managing employee performance and professional development in the public service
- delivering services in full compliance with the Official Languages Act, including communicating with Canadians in the official language of their choice in designated bilingual offices
2018–19 actual results
To measure progress toward achieving this departmental result, TBS uses indicators that relate to employee performance, career development, and bilingual service.
Employee performance
Of all public service employees who were assessed against a performance management agreement, 95.6% met or exceeded their performance objectives. This result met the target of 95% for 2018–19 and exceeded the result for the previous year (94.9%).
Career development
According to the results of the 2018 Public Service Employee Survey, about half (53%) of employees believe that their organization does a good job of supporting employee career development, down from 57% the previous year and missing the target of year‑over‑year improvement.
The Directive on Performance Management requires that departments have an employee performance management program. TBS is gathering information on how departments are using these programs to support their employees’ career development. TBS will use this information to promote best practices and determine needs for new guidance for departments.
In addition, departments are responsible for implementing the Policy on Learning, Training, and Development, which requires deputy heads to:
- strengthen organizational leadership and promote innovation through the adoption of leading-edge management practices
- ensure that their employees have the knowledge, skills, and competencies required to do their work
Bilingual service
In 2018–19, 83% percent of the federal institutions surveyed reported that communications in designated bilingual offices nearly always occurred in the official language chosen by the public. This result is lower than the performance target of 90% and lower than the results in the previous 2 years. That said, most federal institutions are assessed on a rotating basis, usually every 3 years, so most of the institutions assessed in 2018–19 were last assessed in 2015–16, when the result was 84.5%.
TBS will continue to provide institutions with guidance on applying the Official Languages (Communications with and Services to the Public) Regulations. TBS will also work with institutions to focus their efforts on improving leadership and language training, and to increase awareness of language rights and obligations, by facilitating the sharing of best practices, and by organizing outreach and learning events for institutions.
| Performance indicators | Target | Date to achieve target | 2018–19 Actual results |
2017–18 Actual results |
2016–17 Actual results |
|---|---|---|---|---|---|
| Percentage of eligible employees who meet performance objectives | At least 95% | 95.6% | 94.9% | 94.9% | |
| Percentage of employees who believe their department does a good job of supporting employee career development | Year‑over‑ year improvement | Annually | 53% | 57% | Employees were not asked this question in 2016–17 |
| Percentage of institutions where communications in designated bilingual offices “nearly always” occur in the official language chosen by the public | At least 90% | 83%Footnote 22 | 92.5%Footnote 23 | 90.2%Footnote 24 |
Departmental result 2 for Employer: public service attracts and retains a diverse workforce
Context
TBS supports departments in:
- maintaining a diverse and inclusive public service, that is representative of the population it serves (for example, by providing guidance to departments on diversity and inclusion)
- improving accessibility in the public service by setting the conditions for the public service to identify, prevent, and remove barriers to participation for persons with disabilities
2018–19 actual results
To measure this departmental result, TBS uses indicators that relate to recruitment, retention, and diversity.
Recruitment
The federal public service is trying to recruit talent from diverse groups, including youth. In 2018–19, 36.5% of new indeterminate hires were under the age of 30. This result is slightly higher than the previous year’s result of 36% but does not meet the target of workforce availability of 37.5%.
Departments carry out recruitment in collaboration with the Public Service Commission. TBS works with partners to promote and improve activities aimed at youth. It will continue to review survey results (including the Student Exit Survey and the Public Service Employee Survey) and data from youth recruitment pilot projects to inform recruitment initiatives aimed at youth and to promote their integration with broader inclusive recruitment processes.
Retention
One way the federal government predicts future trends in employee retention is by looking at their sense of satisfaction from their work. About 75% of all employees reported, through the 2018 Public Service Employee Survey, that they receive a sense of satisfaction from their work. The result was the same when looking specifically at employees under the age of 30. These results were slightly lower than the 2017–18 results (77% for all employees and 78% for employees under 30).
Job satisfaction is influenced by factors discussed elsewhere in this report, specifically, career development and wellness:
- Employees are more likely to get a sense of satisfaction from their work when they have opportunities to develop in their careers. As mentioned above, TBS is working to improve support for employee career development.
- Practices that support workplace wellness also tend to contribute to job satisfaction (for example, asking employees for input on decisions that affect their work and assigning manageable workloads). Through the Centre for Wellness, Inclusion and Diversity, launched in , TBS is supporting departments in their efforts to create healthy workplaces by raising awareness of best practices in this area.
These efforts are expected to lead to increased job satisfaction in the public service.
Diversity
With respect to recruiting and retaining a diverse public service, the federal government aims to meet the current workforce availabilityFootnote 25 of employment equity groups in the Canadian executive workforce.
As of , representation at the executive levels of the public service of 3 of the 4 designated employment equity groups (members of visible minorities, women, and persons with disabilities) exceeded the targets set in the 2018–19 Departmental Plan.
Although the representation of AboriginalFootnote 26 persons at the executive levels increased from 3.7% in 2018 to 4.1% in 2019, it did not achieve the target of 5.2%.
A Career Pathway Initiative for Indigenous Employees is being developed in response to the report Many Voices One Mind: A Pathway to Reconciliation. The initiative will aim to support the retention and career development of Indigenous employees by:
- addressing the barriers faced by Indigenous employees at the executive, mid‑career and entry levels, when it comes to onboarding, employment retention and career development
- increasing the engagement and accountability of managers and the role they play in fostering a culturally competent and supportive workplace
Although the representation of executive employees who self-identify as persons with disabilities exceeded the target (2.3%), it decreased from 5.2% in 2017 to 4.6% in 2019. The Government of Canada has adopted a new Accessibility Strategy for the Public Service of Canada that includes actions that aim to improve recruitment, retention, and promotion of persons with disabilities in the public service.
| Performance indicator | Target | Date to achieve target | 2018–19 Actual results |
2017–18 Actual results |
2016–17 Actual results |
|---|---|---|---|---|---|
| Percentage of indeterminate hires who are under the age of 30 | At least 37.5% | 36.5% | 36% | 37.3% | |
| Percentage of employees under the age of 30 who receive a sense of satisfaction from their work | At least 78% | 75% | 78% | Employees were not asked this question in 2016–17 | |
| Percentage of all employees who receive a sense of satisfaction from their work | At least 77% | 75% | 77% | Employees were not asked this question in 2016–17 | |
| Percentage of executive employees (compared with workforce availability) who are members of a visible minority group | At least 9.5%Footnote 27 | Annually | 11.1% | 10.1% | 10.2% |
| Percentage of executive employees (compared with workforce availability) who are women | At least 47.8%Footnote 28 | Annually | 50.2% | 49.1% | 48.0% |
| Percentage of executive employees (compared with workforce availability) who are Aboriginal peoples | At least 5.2%Footnote 29 | Annually | 4.1% | 3.7% | 3.9% |
| Percentage of executive employees (compared with workforce availability) who are persons with a disability | At least 2.3%Footnote 30 | Annually | 4.6% | 4.8% | 5.2% |
Departmental result 3 for Employer: employee wellness is improved
Context
To improve employee wellness across the public service, TBS provides resources for creating safe and healthy workplaces. Resources are available for organizations, managers and employees.
TBS also sets strategic direction through the Policy on Harassment Prevention and Resolution, and provides related services, information and guidance to departments.
2018–19 actual results
To measure this departmental result, TBS uses performance indicators that relate to:
- the psychological health of the workplace
- harassment
- long‑term disability leave for mental health reasons
Psychological health of the workplace
In 2018–19, 59% of public service employees indicated, through the 2018 Public Service Employee Survey, that they believe their workplace is psychologically healthy, up from the previous year’s result of 56%. This result meets the target of year‑over‑year improvement.
Harassment
In 2018–19, 15% of employees indicated, through the same survey, that they had been the victim of harassment on the job in the past 12 months. 1.5% of all employees specifically indicated that they had been the victim of sexual harassment on the job in the past 12 months. Although the targets were year‑over‑year decreases, past versions of the survey asked employees about their experiences with harassment over 2 years. Starting in 2019–20, the survey will be conducted every year, which means that TBS will be able to track year‑to‑year changes.
Long‑term disability for mental health reasons
The average length of time that employees spent on long‑term disability leave for mental health reasons continued to increase. In 2018–19, the average length of an employee’s leave was 3.52 years (a 19% increase over the previous year).
TBS will continue to provide managers with guidance and tools on disability management so that they can support employees who are on leave for health reasons, including mental health reasons, by helping them focus on their recovery and plan for their return to work. TBS will also work with partner bargaining agents, through the Employee Wellness Support Program, to develop recommendations for consideration by the Treasury Board and participating bargaining units. The recommendations will include measures to improve employee wellness and better reintegrate employees into the workplace after periods of leave due to illness or injury.
| Performance indicator | Target | Date to achieve target | 2018–19 Actual results |
2017–18 Actual results |
2016–17 Actual results |
|---|---|---|---|---|---|
| Percentage of employees who believe their workplace is psychologically healthy | Year-over-year improvement | Annually | 59% | 56% | 60% |
| Percentage decrease in the length of time off work on long‑term disability due to mental health issuesFootnote 31 | No target set for 2018–19 as baseline data was being collectedFootnote 32 | Average length of 3.52 years (19% increase over previous year) |
Average length of 2.97 years (12% increase over previous year) |
Average length of 2.65 years | |
| Percentage of employees who indicate that they have been the victim of harassment on the job in the past 2 years | Year-over-year decreases | Annually | 15% (past 12 months) |
18% (past 2 years) |
22% (past 2 years) |
| Percentage of employees who indicate that the nature of harassment experienced is a sexual comment or gesture | Year-over-year decreases | Annually | 1.5% (past 12 months) |
1.8% (past 2 years) |
Employees were not asked this question in 2016–17 |
Departmental result 4 for Employer: modernized employment conditions
Context
TBS works with bargaining agents to modernize employment conditions in the federal public service by, for example:
- setting the strategic direction for compensation, job classification and labour relations
- providing related guidance and advice to departments
- bargaining in good faith when negotiating new collective agreements
2018–19 actual results
Labour relations issues are sometimes brought to the Federal Public Sector Labour Relations and Employment Board, a quasi‑judicial tribunal that resolves such issues through adjudication or mediation. In the past 3 years, in all board decisions related to the issue of good faith bargaining, the Treasury Board was found to have bargained in good faith.
At the same time, problems with the Phoenix pay system continue to affect employees. In the 2018 Public Service Employee Survey:
- 70% of public service employees indicated that their pay or other compensation had been affected by system issues (69% in the 2017 survey)
- 35% of affected employees reported that all their pay issues had been resolved (employees were not asked this question in the 2017 survey)
To help address pay issues, TBS is:
- working with Public Services and Procurement Canada (PSPC) to stabilize the Phoenix pay system
- working with PSPC and bargaining agents to introduce a new process for implementing collective agreements that will minimize issues with employee pay and lessen the burden on the pay system
- leading efforts to develop options for a new human resources and pay solution, as part of the government’s plans to replace the Phoenix pay system
- helping departments prepare to transition to a new solution, by redesigning processes, managing change, and training the human resources community
| Performance indicator | Target | Date to achieve target | 2018–19 Actual results |
2017–18 Actual results |
2016–17 Actual results |
|---|---|---|---|---|---|
| Percentage of Federal Public Sector Labour Relations and Employment Board outcomes that confirm that the Government of Canada is bargaining in good faith | 100% | Annually | 100% | 100% | 100% |
Budgetary financial and human resources for Employer
| 2018–19 Main Estimates |
2018–19 Planned spending |
2018–19 Total authorities available for use |
2018–19 Actual spending (authorities used) |
2018–19 Difference (Actual spending minus Planned spending) |
|---|---|---|---|---|
| 2,798,285,112 | 2,798,285,112 | 6,136,195,302 | 5,915,647,071 | 3,117,361,959 |
| 2018–19 Planned full‑time equivalents |
2018–19 Actual full‑time equivalents |
2018–19 Difference (Actual full‑time equivalents minus Planned full‑time equivalents) |
|---|---|---|
| 453 | 469 | 16 |
Financial, human resources and performance information for TBS’s Program Inventory is available in the GC InfoBase.
Regulatory Oversight
Description
- Develop and oversee policies to promote good regulatory practices
- Review proposed regulations to ensure they adhere to the requirements of government policy
- Advance regulatory cooperation across jurisdictions
Results
In 2018–19, TBS aimed to achieve 2 results in exercising its Regulatory Oversight responsibility:
- Government regulatory practices and processes are open, transparent, and informed by evidence
- Regulatory cooperation among jurisdictions is advanced
Departmental result 1 for Regulatory Oversight: government regulatory practices and processes are open, transparent, and informed by evidence
Context
TBS promotes open, transparent, and evidence‑based regulatory practices and processes to protect and advance Canadians’ health, safety, and environment, and to help create the conditions for an innovative and prosperous economy. It does this by, for example:
- setting out, in the Cabinet Directive on Regulation, requirements and expectations for the development, management, and review of federal regulations
- modernizing Canada’s regulatory policy framework to be more efficient and agile, and less burdensome for business
2018–19 actual results
In 2017–18, the OECD Regulatory Policy Outlook 2018 ranked Canada’s regulatory system 3rd for stakeholder engagement, 4th for regulatory impact analysis, and 5th for ex‑post evaluation. The results of the OECD’s next assessment will be published in 2021. The target is for Canada to continue to rank in the top 5.
TBS also maintained its strong results for the two other indicators under this departmental result:
- 97% of applicable regulatory initiatives reported that early public consultation was undertaken prior to first publication
- 100% of applicable regulatory proposals had an appropriate impact assessment
| Performance indicators | Target | Date to achieve target | 2018–19 Actual results |
2017–18 Actual results |
2016–17 Actual results |
|---|---|---|---|---|---|
| Ranking of Canada’s regulatory system by the Organisation for Economic Co‑operation and Development (OECD) | Maintain Canada’s ranking in the top 5 of participating OECD countries |
In the 2018 report, out of 38 OECD jurisdictions, and the European Union, Canada ranked:
|
In the 2018 report, out of 38 OECD jurisdictions, and the European Union, Canada ranked:
|
The OECD ranking is on a 3‑year cycle. No ranking done this year. | |
| Percentage of regulatory initiatives that report on early public consultation undertaken prior to first publication | No target set for 2018–19 as baseline data was being collectedFootnote 33 | 97%Footnote 34 | 97% | Not assessed | |
| Percentage of regulatory proposals that have an appropriate impact assessment (for example, cost‑benefit analysis) | No target set for 2018–19 as baseline data was being collectedFootnote 35 | 100%Footnote 36 | 99% | Not assessed | |
Departmental result 2 for Regulatory Oversight: regulatory cooperation among jurisdictions is advanced
Context
Regulatory cooperation is a process where governments work together to:
- reduce unnecessary regulatory differences
- eliminate duplicative requirements and processes
- harmonize or align regulations
- share information and experiences
- adopt international standards
Regulatory cooperation benefits Canadians in many ways. Consumers benefit from timely access to products with consistent quality and safety standards, while businesses benefit from the removal of unnecessary costs and duplicate requirements, as well as better market access.
TBS promotes regulatory cooperation among jurisdictions, both domestically (between provinces and territories) and internationally.
2018–19 actual results
Between 2015–16 and 2017–18, the number of federal regulatory programs that had a regulatory cooperation work planFootnote 37 remained steady, at 23.
In 2017–18, TBS established 2 new regulatory cooperation forums:
- the Regulatory Cooperation Forum, established under the Canada‑European Union Comprehensive Economic Trade Agreement
- the Regulatory Reconciliation and Cooperation Table, established under the Canadian Free Trade Agreement to address regulatory barriers to trade, investment, and labour mobility within Canada
As a result of these efforts, the number of federal regulatory programs that have a regulatory cooperation work plan increased to 38 in 2018–19, exceeding the target of 29.
As well, for the second year in a row, 100% of significant regulatory proposals (for which regulatory cooperation would be relevant) provided an explanation of the regulatory cooperation considerations that were taken into account when developing the Regulatory Impact Analysis Statements that are published with each regulation.
| Performance indicators | Target | Date to achieve target | 2018–19 Actual results |
2017–18 Actual results |
2016–17 Actual results |
|---|---|---|---|---|---|
| Number of federal regulatory programs that have a regulatory cooperation work plan | At least 29 | Work plans are in place for 38 federal regulatory programs | Work plans are in place for 23 federal regulatory programs | Work plans are in place for 23 federal regulatory programs | |
| Percentage of significant regulatory proposalsFootnote 38 that promote regulatory cooperation considerations, when relevantFootnote 39 | No target set for 2018–19 as baseline data was being collectedFootnote 40 | 100%Footnote 41 | 100% | Not assessed | |
Budgetary financial and human resources for Regulatory Oversight
| 2018–19 Main Estimates |
2018–19 Planned spending |
2018–19 Total authorities available for use |
2018–19 Actual spending (authorities used) |
2018–19 Difference (Actual spending minus Planned spending) |
|---|---|---|---|---|
| 6,361,066 | 6,361,066 | 9,091,527 | 7,725,977 | 1,364,911 |
| 2018–19 Planned full‑time equivalents |
2018–19 Actual full‑time equivalents |
2018–19 Difference (Actual full‑time equivalents minus Planned full‑time equivalents) |
|---|---|---|
| 43 | 52 | 9 |
Financial, human resources and performance information for TBS’s Program Inventory is available in the GC InfoBase.
Internal Services
Description
Internal Services are those groups of related activities and resources that the federal government considers to be services in support of programs and/or required to meet corporate obligations of an organization. Internal Services refers to the activities and resources of the 10 distinct service categories that support Program delivery in the organization, regardless of the Internal Services delivery model in a department. The 10 service categories are:
- Acquisition Management Services
- Communications Services
- Financial Management Services
- Human Resources Management Services
- Information Management Services
- Information Technology Services
- Legal Services
- Materiel Management Services
- Management and Oversight Services
- Real Property Management Services
Results
In 2018–19, TBS allocated 27% of its operating spending and 29% of its full‑time equivalents to Internal Services, to support the department’s operations and its ability to fulfill its 4 Core Responsibilities.
TBS is a knowledge‑based organization and is committed to enabling its professional workforce to achieve results. In 2018–19, TBS continued to support, and build the capacity of, its workforce (for example, by conducting targeted recruitment, by introducing a learning roadmap, by developing and approving a 3-year people management plan and a 3-year employment equity and diversity action plan, and by continuing to implement a 3-year wellness action plan). The 2018 Public Service Employee Survey indicated that TBS is making progress in these areas. For example:
- 71% of TBS employees feel they get the training to do their jobs, up from 69% the previous year, and surpassing the overall public service result of 70%
- 84% of TBS employees reported that the department respects individual differences (for example, culture, work styles, ideas), up from 82% the previous year, and surpassing the overall public service result of 78%
- 67% of TBS employees would describe their workplace as being psychologically healthy, up from 62% the previous year, and surpassing the overall public service result of 59%
TBS also continued to support employees who are affected by problems with the Phoenix pay system. In the 2018 survey, 43% of employees felt satisfied with the support they received from their department to help resolve their pay or other compensation issues, down slightly from 47% the previous year, but higher than the overall public service result of 36%. TBS will continue to support its employees affected by pay and compensation issues.
In 2018–19, TBS completed its Workspace Renewal Initiative, which reduced TBS’s footprint from 11 locations across the National Capital Region to 2 modern workplaces. Between 2016–17 and 2018–19, TBS reduced its space utilization rate by 11%.
In the area of information management and information technology (IMIT), TBS developed the Access to Information and Privacy Online Request Service. This service enables the public to transmit secure information requests to the Government of Canada institutions that are subject to the Access to Information Act and the Privacy Act. In addition, a new cloud‑based environment was established to support the Office of the Chief Information Officer’s oversight function for the Government of Canada’s $6.6 billion investment in IMIT projects and activities.
TBS also continued to improve both internal and government-wide capacity to experiment in order to generate evidence about how best to achieve results. For example, in 2018–19, TBS:
- facilitated an interdepartmental community that shares information, expertise, and lessons learned related to departments’ experiments
- managed a web domain for experimental and prototype websites and services
| 2018–19 Main Estimates |
2018–19 Planned spending |
2018–19 Total authorities available for use |
2018–19 Actual spending (authorities used) |
2018–19 Difference (Actual spending minus Planned spending) |
|---|---|---|---|---|
| 77,268,537 | 77,268,537 | 88,682,359 | 84,098,142 | 6,829,605 |
| 2018–19 Planned full‑time equivalents |
2018–19 Actual full‑time equivalents |
2018–19 Difference (Actual full‑time equivalents minus Planned full‑time equivalents) |
|---|---|---|
| 606 | 612 | 6 |
Analysis of trends in spending and human resources
Actual expenditures
Departmental spending breakdown
In 2018–19, TBS’s total spending was $6,156 million. Figure 2 shows a breakdown of spending, by category. Approximately 5% of spending was for operations. The balance was for public service employer payments, which TBS makes as the employer for the core public administration.
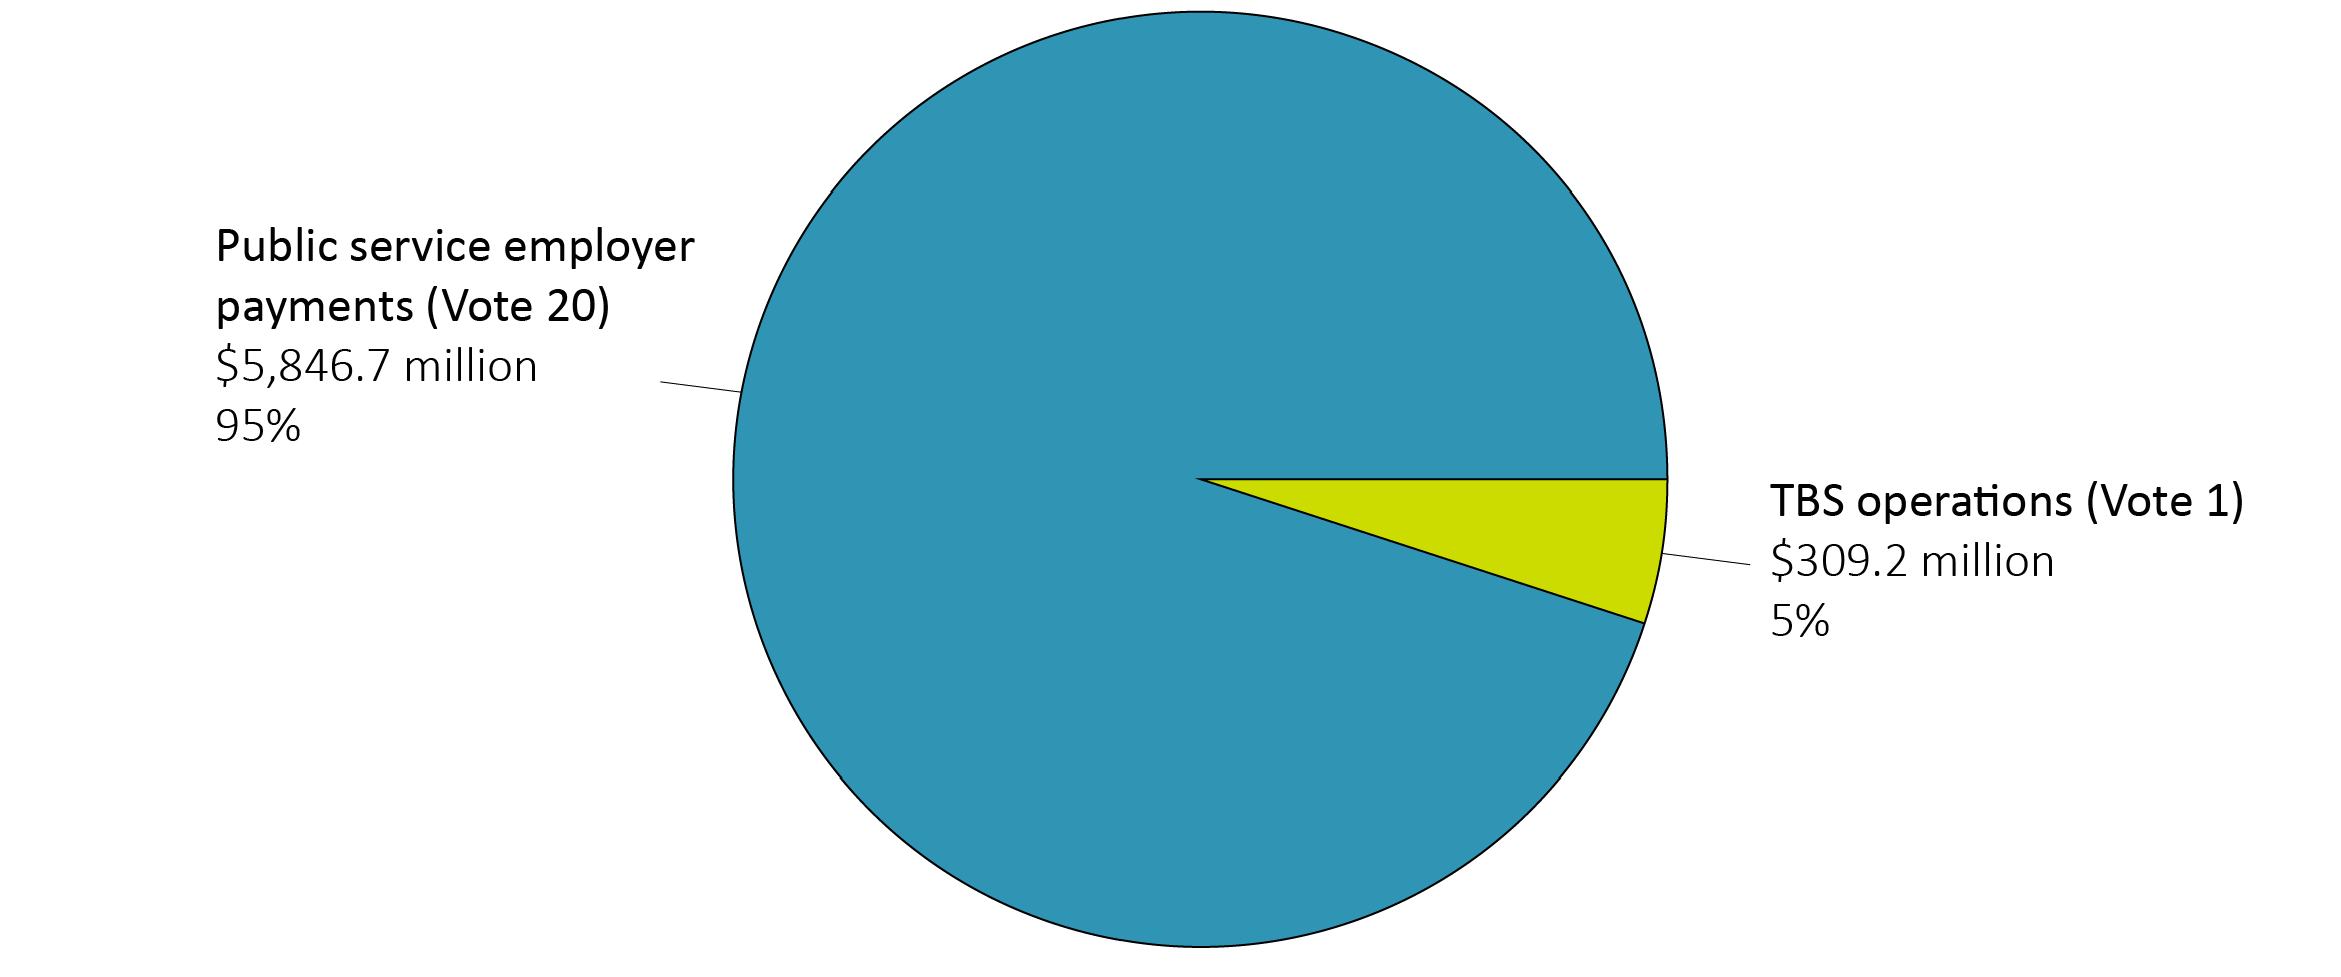
Figure 2 - Text version
This pie chart shows the breakdown of the Treasury Board of Canada Secretariat’s actual spending for 2018–19 in two categories: public service employer payments and various statutory items, which accounted for 95% of actual spending, or $5,846.7 million; and TBS operations, which accounted for 5% of actual spending, or $309.2 million.
Figure 3 shows a breakdown of TBS’s spending of approximately $5,847 million in public service employer payments. These payments cover, for the core public administration, the employer’s share of employee and pensioner benefit plans; the employer’s share of provincial health care premiums and other payroll taxes; statutory payments that cover employer contributions under the Public Service Superannuation Act, the Public Service Pension Adjustment Act and other pension legislation; and employer contributions under the Employment Insurance Act, which relate mostly to pensions.
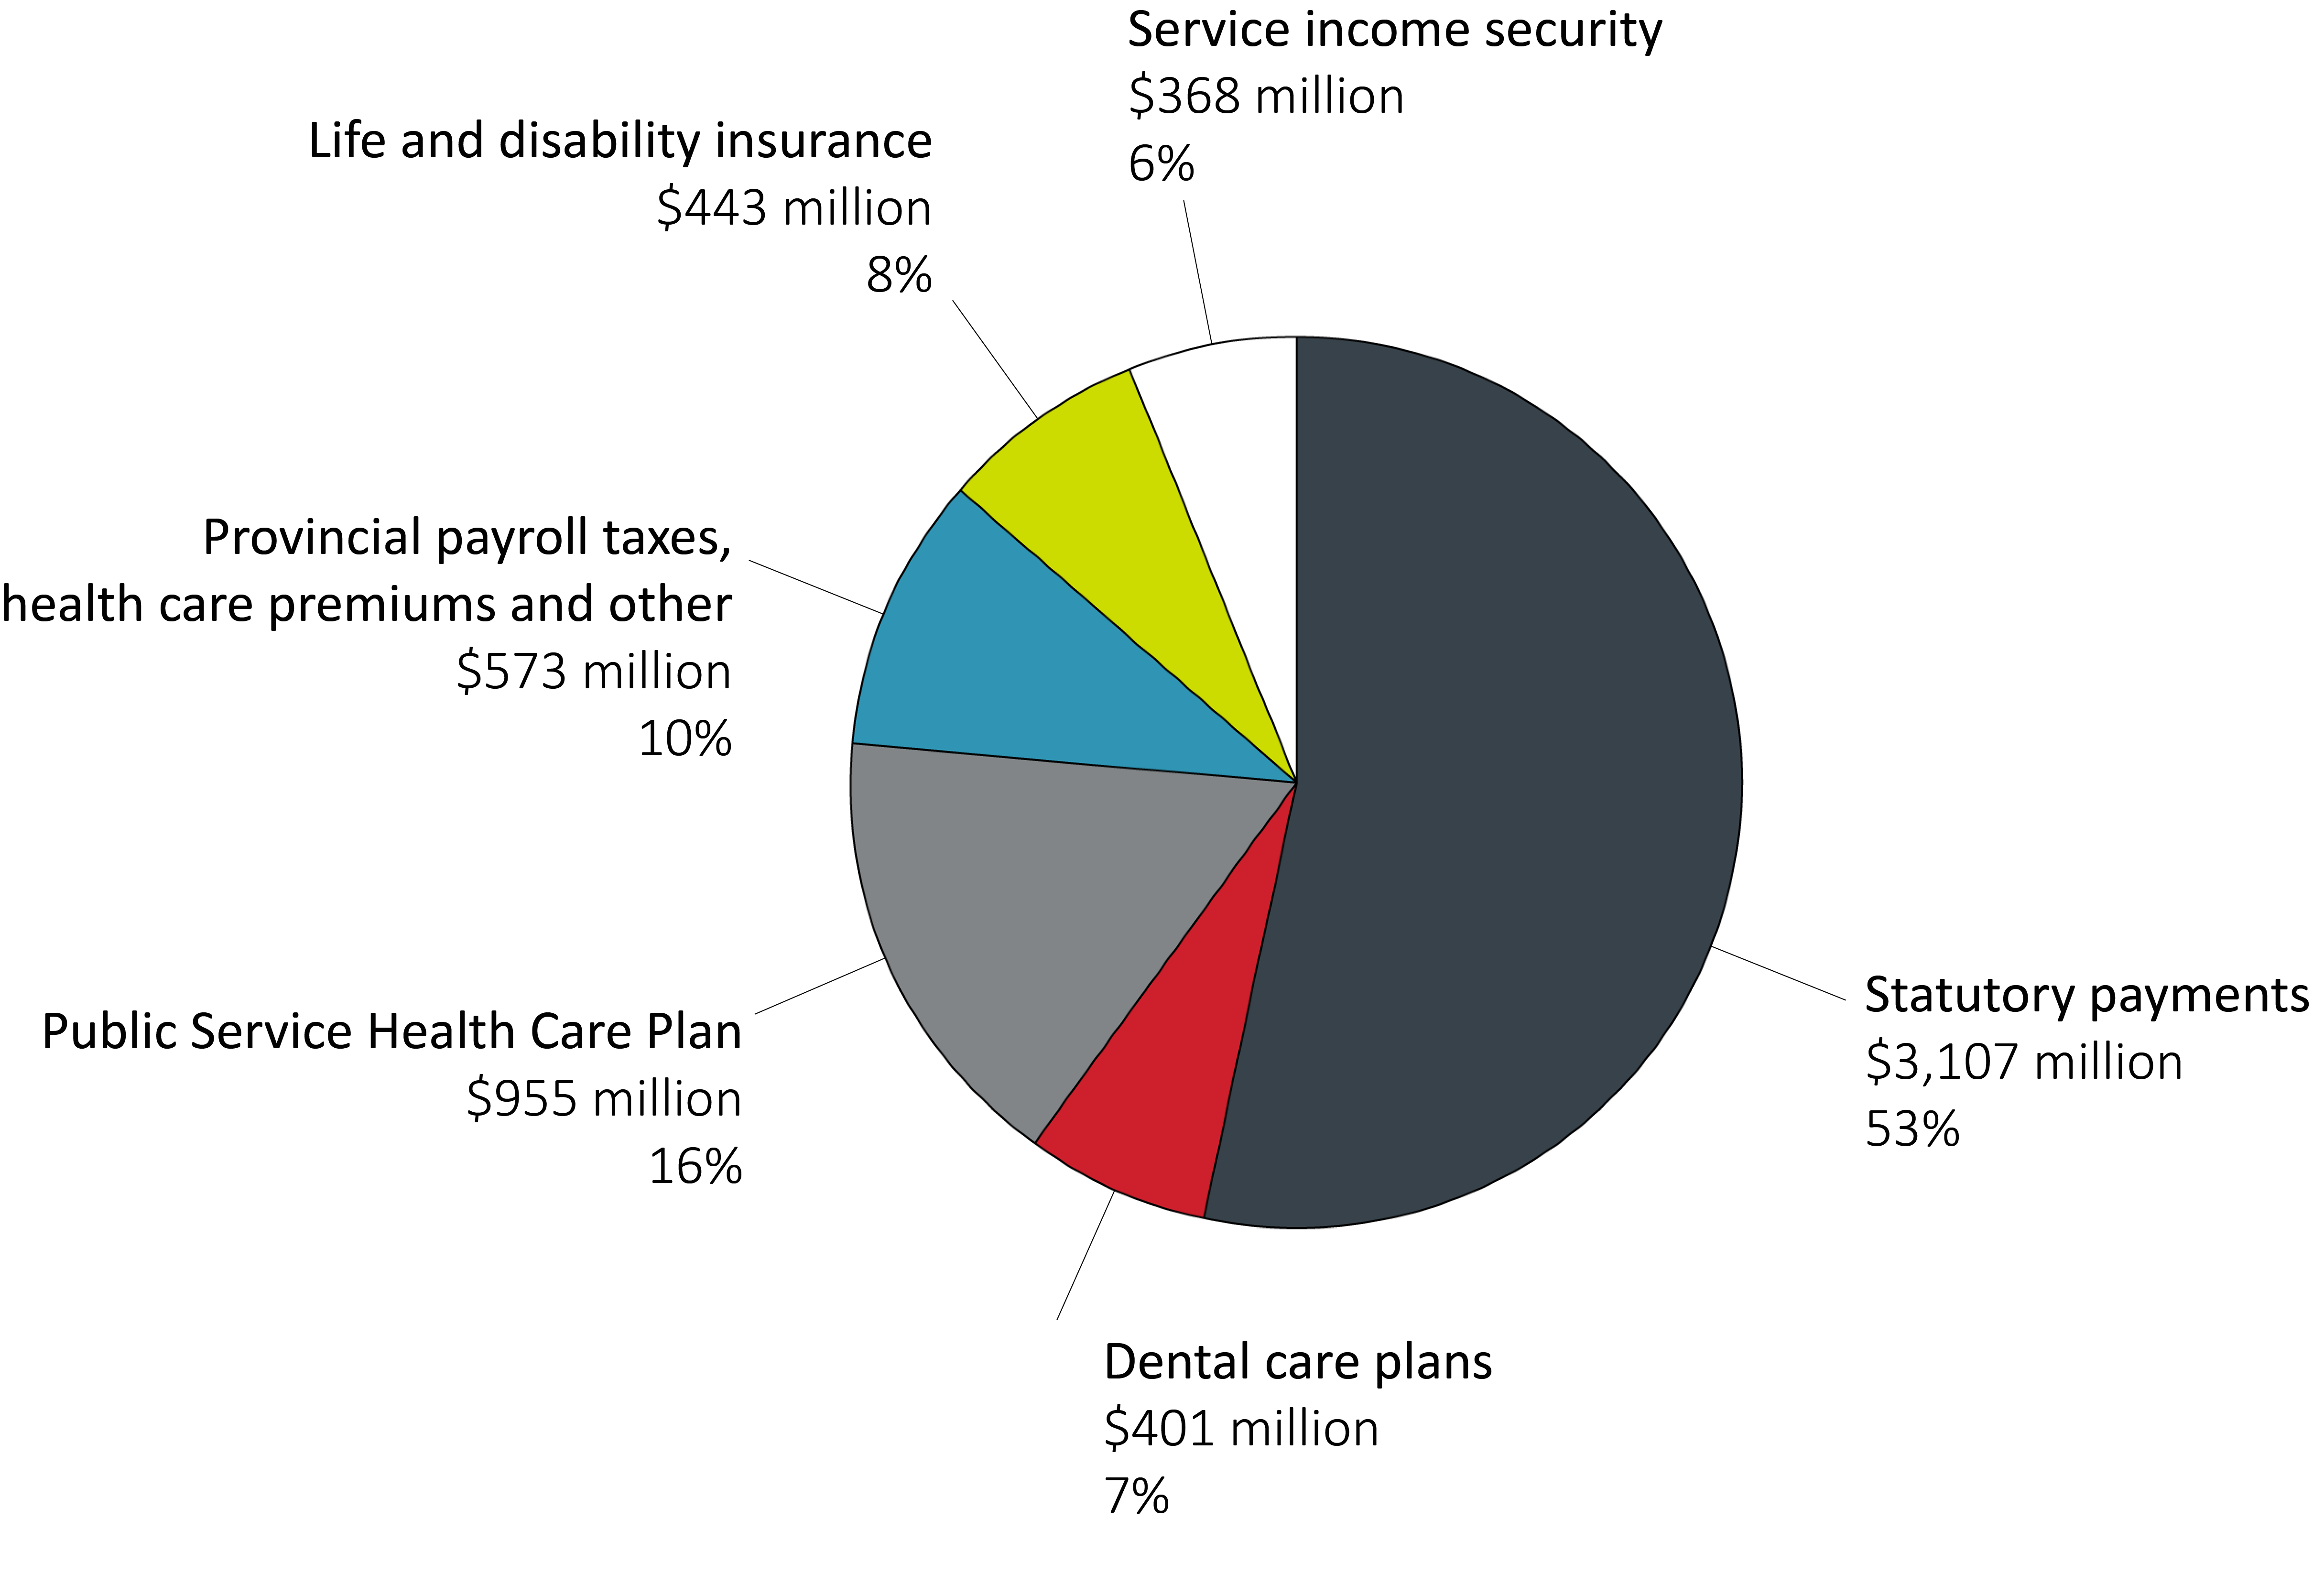
Figure 3 - Text version
This pie chart shows the breakdown of the Treasury Board of Canada Secretariat’s actual spending on public service employer payments and various statutory items for 2018–19. The pie chart is divided into six spending categories, broken down as follows:
| Category | Amount | Percentage of total |
|---|---|---|
| Public Service Health Care Plan | $955 million | 16% |
| Provincial Payroll Taxes / Health Care Premiums and Other | $573 million | 10% |
| Life and disability insurance | $443 million | 8% |
| Dental care plans | $401 million | 7% |
| Statutory payments | $3,107 million | 53% |
| Service income security | $368 million | 6% |
Figure 4 shows TBS’s operating expenditures over time. Operating expenditures include TBS employees’ salaries, non-salary costs to deliver programs, and statutory items relating to the employer’s contributions to TBS employees’ benefit plans.
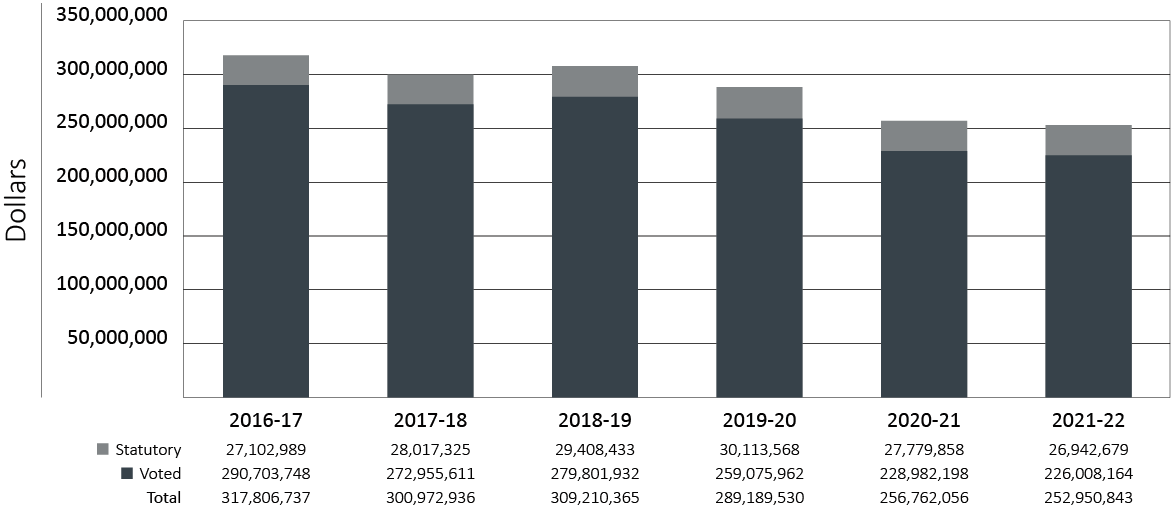
Figure 4 - Text version
This bar graph illustrates TBS’s actual spending (Vote 1) for fiscal years 2016-17, 2017-18 and 2018-19 and planned spending for fiscal years 2019-20, 2020-21 and 2021-22. Financial figures are presented in dollars along the y axis, increasing by $50 million and ending at $350 million. These are graphed against fiscal years 2016-17 to 2021-22 on the x axis.
For each fiscal year, amounts for the TBS’s program expenditures (Vote 1), and statutory vote (largely comprised of contributions to employee benefit plans).
In 2016-17, actual spending was $27,102,989 for statutory items and $290,703,748 for program expenditures for a total of $317,806,737.
In 2017-18, actual spending was $28,017,325 for statutory items and $272,955,611 for program expenditures for a total of $300,972,936.
In 2018-19, actual spending was $29,408,433 for statutory items and $279,801,932 for program expenditures for a total of $309,210,365.
Planned spending for statutory items goes from $30,113,568 in 2019-20, to $27,779,858 in 2020-21, and to $26,942,679 in 2021-22.
Planned spending for program expenditures goes from $259,075,962 in 2019-20, to $228,982,198 in 2020-21, and to $226,008,164 in 2021-22.
Total planned spending goes from $289,189,530 in 2019-20, to $256,762,056 in 2020-21, and to $252,950,843 in 2021-22.
The one‑time Budget 2016 funding to accelerate the Back Office Transformation Initiative sunsetted in 2016–17, which resulted in a decrease of $16.8 million in 2017–18.
Spending for TBS’s program expenditures increased by $8.2 million in 2018–19 as the implementation of Budget 2017 and Budget 2018 initiatives continued.
These initiatives include:
- Web Renewal
- Canadian Digital Service
- Regulatory Cooperation Council
- Next Generation Human Resources and Pay
- Stabilization of the Federal Government’s Pay System (Phoenix)
- Supporting Federal Leadership at the Canadian Free Trade Agreement
- Regulatory and Horizontal Skills Review
For 2019–20 to 2020–21, total planned spending for TBS’s Core Responsibilities is projected to decrease because the following programs are scheduled to sunset. Funding for after 2020–21 is subject to the renewal process.
Sunsetting in 2019–20:
- Regulatory Cooperation CouncilFootnote 42
- Classification Program
- Federal Contaminated SitesFootnote 43
- Canadian Digital ServiceFootnote 44
- Next Generation Human Resources and Pay
- Open Government Partnership Global Summit in Canada
- Supporting Federal Leadership at the Canadian Free Trade AgreementFootnote 45
Sunsetting in 2020–21:
- Regulatory Reviews
- Joint Learning Program
Figure 5 shows TBS’s spending on public service employer payments, over time, for the core public administration.
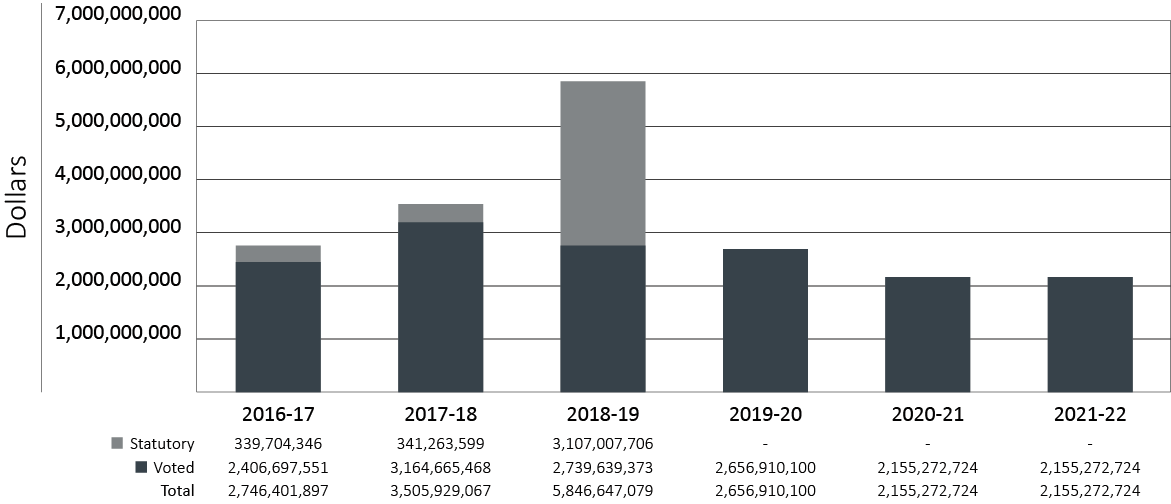
Figure 5 - Text version
This bar graph illustrates TBS’s actual spending for the public service employer payments (Vote 20) and various statutory items for fiscal years 2016-17, 2017-18 and 2018-19 and planned spending for fiscal years 2019-20, 2020-21 and 2021-22. Financial figures are presented in dollars along the y axis, increasing by $1.0 billion and ending at $7.0 billion. These are graphed against fiscal years 2016-17 to 2021-22 on the x axis.
For each fiscal year, amounts for TBS’s public service employer payments (Vote 20), and statutory items (largely comprised of payments under the Public Service Pension Adjustment Act).
In 2016-17, actual spending was $339,704,346 for statutory items and $2,406,697,551 for public service employer payments for a total of $2,746,401,897.
In 2017-18, actual spending was $341,263,599 for statutory items and $3,164,665,468 for public service employer payments for a total of $3,505,929,067.
In 2018-19, actual spending was $3,107,007,706 for statutory items and $2,739,639,373 for public service employer payments for a total of $5,846,647,079.
There are no planned spending for statutory items for fiscal years 2019-20 to 2021-22.
Planned total spending for public service employer payments goes from $2,656,910,100 in 2019-20, to $2,155,272,724 in 2020-21, and will remain the same for fiscal years 2021-22.
Actual spending on public service employer payments increased by $760 million from 2016–17 to 2017–18. This increase reflects a top‑up payment to the Service Income Security Insurance Plan in 2017–18 and higher employer costs following the implementation of collective agreements that were ratified in 2017. These increased employer costs were offset by lower costs for the Royal Canadian Mounted Police (RCMP) life and disability insurance plans as a result of the one-time top‑up payment made in 2016–17.
Actual spending on public service employer payments increased by $2.3 billion from 2017–18 to 2018–19, mainly as a result of a statutory payment of $3.1 billion to the Public Service Superannuation Account. The increase is offset by an ongoing reduction, which starts in 2019–20, of $340 million as a result of the elimination of the special annual payment to the Public Service Pension Fund Account, as well as the decrease in the top‑up payments to the Service Income Security Insurance Plan made in 2017–18.
Approved (voted) reference levels for 2019–20 and beyond for public service employer payments will decrease by $502 million. Budget 2018 provided funding in 2019–20 for these payments, in order to meet price and volume fluctuations. Similar funding requirements for future years will be established annually.
| Core Responsibilities and Internal Services | 2018–19 Main Estimates |
2018–19 Planned spending |
2019–20 Planned spending |
2020–21 Planned spending |
2018–19 Total authorities available for use |
2018–19 Actual spending (authorities used) |
2017–18 Actual spending (authorities used) |
2016–17 Actual spending (authorities used) |
|---|---|---|---|---|---|---|---|---|
| Spending Oversight | 10,662,340,900 | 10,662,340,900 | 4,116,924,204 | 3,628,008,445 | 3,852,437,596 | 42,146,978 | 42,055,064 | 40,721,685 |
| Administrative Leadership | 74,523,877 | 74,523,877 | 100,107,686 | 76,812,232 | 107,908,627 | 106,239,277 | 103,822,405 | 121,470,940 |
| Employer | 2,798,285,112 | 2,798,285,112 | 2,713,952,385 | 2,205,315,597 | 6,136,195,302 | 5,915,647,071 | 3,568,437,380 | 2,823,956,155 |
| Regulatory Oversight | 6,361,066 | 6,361,066 | 9,076,639 | 6,672,687 | 9,091,527 | 7,725,977 | 5,983,551 | 4,704,732 |
| Subtotal | 13,541,510,955 | 13,541,510,955 | 6,940,060,914 | 5,916,808,961 | 10,105,633,052 | 6,071,759,303 | 3,720,298,400 | 2,990,853,512 |
| Internal Services | 77,268,537 | 77,268,537 | 82,864,572 | 83,418,819 | 88,682,359 | 84,098,142 | 86,603,603 | 73,355,122 |
| Total | 13,618,779,492 | 13,618,779,492 | 7,022,925,486 | 6,000,227,780 | 10,194,315,411 | 6,155,857,445 | 3,806,902,003 | 3,064,208,634 |
The Government‑Wide Funds and Public Service Employer Payments programFootnote 46 represents the largest portion of TBS’s planned spending. On average, the Treasury Board approves transfers of approximately 56% of this program’s funding to other federal organizations for items such as government contingencies, government‑wide initiatives, compensation requirements, operating and capital budget carry forward, and paylist expenditures (central votes 5, 10, 15, 25, 30, and 35). TBS’s total funding available for use, in its reference levels, is reduced accordingly. The remaining 44% of this program’s funding pertains to public service employer payments.
As shown in the “Budgetary performance summary for Core Responsibilities and Internal Services” table, total planned spending is expected to decrease by $6.6 billion in 2019–20, mainly because of the budget implementation vote (Vote 40). This vote was added in 2018–19 to facilitate timely availability of funding for activities carried out in that fiscal year as part of new measures approved in Budget 2018.Footnote 47
Total planned spending is also expected to decrease in 2019–20 because of the elimination of the $340 million under the employer contributions made under the Public Service Superannuation Act, and because of the transfer of the Service Income Security Insurance Plan from TBS to the Department of National Defence.
Actual spending increased by $743 million from 2016–17 to 2017–18. Most of the increase relates to a top‑up payment to the Service Income Security Insurance Plan in 2017–18 and higher employer costs following the implementation of collective agreements that were ratified in 2017.
For additional details on planned spending, see the section “Supporting information on the Program Inventory” in Supplementary Information.
Actual human resources
| Core Responsibilities and Internal Services | 2016–17 Actual full‑time equivalents |
2017–18 Actual full‑time equivalents |
2018–19 Planned full‑time equivalents |
2018–19 Actual full‑time equivalents |
2019–20 Planned full‑time equivalents |
2020–21 Planned full‑time equivalents |
|---|---|---|---|---|---|---|
| Spending Oversight | 314 | 302 | 316 | 309 | 295 | 296 |
| Administrative Leadership | 538 | 589 | 509 | 669 | 587 | 474 |
| Employer | 456 | 435 | 453 | 469 | 432 | 387 |
| Regulatory Oversight | 33 | 40 | 43 | 52 | 63 | 47 |
| Subtotal | 1,341 | 1,366 | 1,321 | 1,499 | 1,377 | 1,204 |
| Internal Services | 581 | 605 | 606 | 612 | 618 | 616 |
| Total | 1,922 | 1,971 | 1,927 | 2,111 | 1,995 | 1,820 |
Full‑time equivalents increased by 49 from 2016–17 to 2017–18 as a result of the hiring of new staff for the following initiatives and for the Internal Services to support them:
- Stabilization of the Federal Government’s Pay System (under the Employer Core Responsibility)
- Regulatory Cooperation Council (under the Regulatory Oversight Core Responsibility)
- Web Renewal (under the Administrative Leadership Core Responsibility)
- Canadian Digital Service (under the Administrative Leadership Core Responsibility)
Full‑time equivalents increased by 140 in 2018–19 as a result of the hiring of new staff for the following initiatives and for the Internal Services staff to support them:
- Next Generation Human Resources and Pay
- Stabilization of the Federal Government’s Pay System (Phoenix)
- Supporting Federal Leadership at the Canadian Free Trade Agreement
- Regulatory and Horizontal Skills Reviews
Full‑time equivalents are expected to decrease by 175 from 2019–20 to 2020–21 because the funding related to the following initiatives are scheduled to sunset. Funding for them for after 2020–21 is subject to the renewal process.
- Canadian Digital ServiceFootnote 48
- Regulatory Cooperation CouncilFootnote 49
- Next Generation Human Resources and Pay
- Joint Learning Program
- Classification Program
- Employee Wellness Support
- Regulatory Review
Expenditures by vote
For information on TBS’s organizational voted and statutory expenditures, consult the Public Accounts of Canada 2018–2019.
Government of Canada spending and activities
Information on the alignment of TBS’s spending with the Government of Canada’s spending and activities is available in the GC InfoBase.
Financial statements and financial statements highlights
Financial statements
The TBS financial statements (unaudited) for the year ended , are available on TBS’s website.
Financial statements highlights
The highlights presented in this section are drawn from TBS’s financial statements. The financial statements were prepared using Government of Canada accounting policies, which are based on Canadian public sector accounting standards.
The figures provided in this section were prepared on an accrual basis; the figures in the other sections were prepared on an expenditure basis. The difference between the figures in the different sections is the result of accrual entries, such as the recognition of services provided without charge by other government departments, the acquisition of tangible capital assets and related amortization expenses, and accrued liability adjustments.
| Financial information | 2018–19 Planned resultstable 28 note * |
2018–19 Actual results |
2017–18 Actual results |
Difference (2018–19 Actual results minus 2018–19 Planned results) |
Difference (2018–19 Actual results minus 2017–18 Actual results) |
|---|---|---|---|---|---|
| Total expenses | 3,034,925,039 | 6,125,941,917 | 3,833,411,081 | 3,091,016,878 | 2,292,530,836 |
| Total net revenues | 13,446,208 | 13,472,324 | 14,620,955 | 26,116 | (1,148,631) |
| Net cost of operations before government funding and transfers | 3,021,478,831 | 6,112,469,593 | 3,818,790,126 | 3,090,990,762 | 2,293,679,467 |
Table 28 Notes
|
|||||
TBS’s total expenses of $6.1 billion consist of:
- public service employer payments ($5.8 billion in 2018–19 and $3.5 billion in 2017–18), which TBS makes as the employer for the core public administrationFootnote 50
- departmental program expenses ($0.3 billion in 2018–19 and in 2017–18)
The increase of $2,293 million (59.8%) in total actual expenses from 2017–18 to 2018–19 stems from:
- a net increase of $2,282 million in public service employer payments
- a net increase of $10 million in departmental program expenses, mostly attributable to the stabilization and future transformation of the Government of Canada’s pay administration
The net increase of $2,282 million in public service employer payments is primarily due to a $3,107 million lump‑sum contribution to the Public Service Pension Plan in 2018–19 to address an actuarial shortfall reported in the latest triennial actuarial report on the plan, which was tabled in Parliament in . This contribution replaced a $340 million actuarial adjustment made in 2017–18 based on the previous triennial actuarial report on the plan. The $2,767 million increase was partially offset by a top‑up payment of $623 million made in 2017–18 to address a deficit in the Service Income Security Insurance Plan related to increased disability insurance claims from medically released members of the Canadian Armed Forces.
The difference of $3,091 million in total expenses between planned and actual results for 2018–19 is primarily due to the new actuarial adjustment that was approved for the Public Service Pension Plan in , as well as funding that was subsequently approved for increases in public sector employee benefit plans and for various initiatives such as the Enabling Functions Transformation, Stabilization of the Federal Government’s Pay System (Phoenix), Next Generation Human Resources and Pay and a new Centre on Diversity, Inclusion and Wellness.
TBS’s total net revenues include the recovery of costs that TBS incurs for the administration of the Public Service Pension Plan, and recoveries from other government departments for costs associated with providing internal support services related to financial and human resources management systems, accounting and mail services.
The decrease of $1.1 million (7.9%) in total actual net revenues from 2017–18 to 2018–19 is mostly due to a decrease in recoveries related to internal support services as a result of one‑time costs that Central Agencies Cluster Shared Systems incurred in 2017–18 to implement a new version of the human resources management system and to bring a new member into the cluster.
| Financial information | 2018–19 | 2017–18 | Difference (2018–19 minus 2017–18) |
|---|---|---|---|
| Total liabilities | 502,899,834 | 1,092,603,798 | (589,703,964) |
| Total net financial assets | 472,414,344 | 1,013,247,319 | (540,832,975) |
| Departmental net debt | 30,485,490 | 79,356,479 | (48,870,989) |
| Total non‑financial assets | 61,111,241 | 46,847,721 | 14,263,520 |
| Departmental net financial position | 30,625,751 | (32,508,758) | (63,134,509) |
TBS’s liabilities consist mainly of accounts payable to other government departments and agencies related to employer contributions to employee benefit plans and to accrued employee claims for benefits under the public service health and dental care plans. The decrease of $590 million in total liabilities from 2017–18 to 2018–19 is mostly due to the payment in 2018–19 of an account payable set up in 2017–18 to address a $623 million deficit under the Service Income Security Insurance Plan, as mentioned above.
TBS’s assets consist mainly of accounts receivable from other government departments and agencies to pay for their share of employer contributions to employee benefit plans, as well as amounts due from the Consolidated Revenue Fund (CRF) that may be disbursed without further charges to TBS’s authorities. The decrease of $541 million in total net financial assets from 2017–18 to 2018–19 is mostly the result of a decrease in amounts due from the CRF.
TBS’s departmental net debt consists mainly of accrued liabilities to be paid from authorities in future years. The decrease of $49 million from 2017–18 to 2018–19 is mostly due to a change to the timing when group insurance plans recoveries are credited to authorities.
TBS’s non‑financial assets consist mainly of tangible capital assets. The increase of $14 million from 2017–18 to 2018–19 is mostly due to the capitalization of software development costs related to the Enabling Functions Transformation Initiative, and leasehold improvements and office furniture acquisitions related to the Workspace Renewal Initiative.
The decrease of $63 million in TBS’s departmental net financial position is therefore attributable to the decrease in departmental net debt and increase in tangible capital assets.
Supplementary information
-
In this section
- Corporate information
- Raison d’être, mandate and role: who we are and what we do
- Operating context and key risks
- Reporting Framework
- Supporting information on the Program Inventory
- Supplementary information tables
- Phoenix pay system expenditures
- Federal tax expenditures
- Organizational contact information
Corporate information
Organizational profile
Appropriate ministers in 2018-19: The Honourable Scott Brison, President of the Treasury Board and Minister of Digital Government; the Honourable Jane Philpott, President of the Treasury Board and Minister of Digital Government; the Honourable Carla Qualtrough, Interim President of the Treasury Board and Minister of Digital Government; the Honourable Joyce Murray, President of the Treasury Board and Minister of Digital Government
Institutional head: Peter Wallace, Secretary of the Treasury Board
Ministerial portfolio: The portfolio consists of the Treasury Board of Canada Secretariat and the Canada School of Public Service, as well as the following organizations, which operate at arm’s length and report to Parliament through the President of the Treasury Board: the Public Sector Pension Investment Board, the Office of the Commissioner of Lobbying of Canada, and the Office of the Public Sector Integrity Commissioner of Canada.
Enabling instrument: The Financial Administration Act is the act that establishes the Treasury Board itself and gives it powers with respect to the financial, personnel and administrative management of the public service, and the financial requirements of Crown corporations.
Year of incorporation / commencement: 1966
Raison d’être, mandate and role: who we are and what we do
“Raison d’être, mandate and role: who we are and what we do” is available on TBS’s website.
For more general information about the department, see the “Supplementary information” section of this report.
For more information on the department’s organizational mandate letter commitments, see the Ministers’ mandate letters.
Operating context and key risks
Information on operating context and key risks is available on TBS’s website.
Reporting Framework
TBS’s Departmental Results Framework and Program Inventory of record for 2018–19 are shown below.
Core Responsibility 1: Spending Oversight
Departmental Results Framework
| Departmental Result | Indicator |
|---|---|
| Departments achieve measurable results | Percentage of departmental results indicators for which targets are achieved |
| Treasury Board proposals contain information that helps Cabinet ministers make decisions | Degree to which Treasury Board submissions transparently disclose financial risk |
| Budget initiatives are approved for implementation quickly | Percentage of Budget initiatives included in the next available Estimates |
| Reporting on government spending is clear | Degree to which visitors to online departmental planning and reporting documents found the information useful (on a scale of 1 to 5) |
| Degree to which GC InfoBase users found the spending information they sought (on a scale of 1 to 5) |
Program Inventory
- Oversight and Treasury Board Support
- Expenditure Data, Analysis, and Reviews
- Results and Performance Reporting Policies and Initiatives
- Government‑Wide Funds
Core Responsibility 2: Administrative Leadership
Departmental Results Framework
| Departmental Result | Indicator |
|---|---|
| Canadians have timely access to government information | Number of datasets available to the public |
| Percentage of personal information requests responded to within established timelines | |
| Percentage of access to information requests responded to within established timelines | |
| Government service delivery meets the needs of Canadians | Percentage of Government of Canada priority services available online |
| Degree to which clients are satisfied with the delivery of Government of Canada services, expressed as a score from 1 to 100 | |
| Percentage of priority services that meet service standards | |
| Government promotes good asset and financial management | Percentage of departments that have assessed all internal controls over financial reporting in high-risk areas and annually realign, implement and monitor systems on internal control |
| Percentage of departments that effectively maintain and manage their assets over their life cycle | |
| Departmental Result: Technology enhances the effectiveness of government operations | Percentage of information technology systems that are managing cyber risks effectively |
| Percentage of departments that have fewer than 3 significant outages impacting key systems in a year | |
| Degree to which departments are satisfied with the health of government’s information technology, expressed as a percentage | |
| Government demonstrates leadership in making its operations low‑carbon | Level of overall government greenhouse gas emissions |
Program Inventory
- Comptrollership Policies and Initiatives
- Service Delivery Policies and Initiatives
- Digital Technology and Security Policies and Initiatives
- Management Accountability Framework and Policy Suite Integrity
Core Responsibility 3: Employer
Departmental Results Framework
| Departmental Result | Indicator |
|---|---|
| Departmental Result: Public service is high‑performing | Percentage of eligible employees who meet performance objectives |
| Percentage of employees who believe their department does a good job of supporting employee career development | |
| Percentage of institutions where communications in designated bilingual offices “nearly always” occur in the official language chosen by the public | |
| Public Service attracts and retains a diverse workforce | Percentage of indeterminate hires under the age of 30 |
| Percentage of all employees who receive a sense of satisfaction from their work | |
| Percentage of employees under the age of 30 who receive a sense of satisfaction from their work | |
| Percentage of executive employees (compared with workforce availability) who are members of a visible minority group | |
| Percentage of executive employees (compared with workforce availability) who are women | |
| Percentage of executive employees (compared with workforce availability) who are Aboriginal persons | |
| Percentage of executive employees (compared with workforce availability) who are persons with a disability | |
| Employee wellness is improved | Percentage of employees who believe their workplace is psychologically healthy |
| Percentage decrease in the length of time off work on long-term disability due to mental health issues | |
| Percentage of employees who indicate that they have been the victim of harassment on the job in the past 2 years | |
| Percentage of employees who indicate that the nature of the harassment experienced is a sexual comment or gesture | |
| Modernized employment conditions | Percentage of Federal Public Service Labour Relations and Employment Board outcomes that confirm that the Government of Canada is bargaining in good faith |
Program Inventory
- People Management and Executive Policies and Initiatives
- Collective Bargaining and Labour Relations
- Pension and Benefits Management
- Public Service Employer Payments
Core Responsibility 4: Regulatory Oversight
Departmental Results Framework
| Departmental Result | Indicator |
|---|---|
| Government regulatory practices and processes are open, transparent, and informed by evidence | Ranking of Canada’s regulatory system by the Organisation for Economic Co‑operation and Development |
| Percentage of regulatory initiatives that report on early public consultation undertaken prior to first publication | |
| Percentage of regulatory proposals that have an appropriate impact assessment (for example, cost‑benefit analysis) | |
| Regulatory cooperation among jurisdictions is advanced | Number of federal regulatory programs that have a regulatory cooperation work plan |
| Percentage of significant regulatory proposals that promote regulatory cooperation considerations, when relevant |
Program Inventory
- Regulatory Policy and Oversight
- Regulatory Cooperation
Internal Services
Supporting information on the Program Inventory
Financial, human resources and performance information for TBS’s Program Inventory is available in the GC InfoBase.
Supplementary information tables
The following supplementary information tables are available on TBS’s website:
- Departmental Sustainable Development Strategy
- Gender‑based analysis plus
- Horizontal initiatives
- Status report on projects operating with specific Treasury Board approval
- Response to parliamentary committees and external audits
The “Response to parliamentary committees and external audits” supplementary information table includes a summary of the government response to the 32nd report of the Standing Senate Committee on National Finance: The Phoenix Pay Problem: Working Toward a Solution. In that response, TBS committed to providing, in its Departmental Results Reports, annual updates on the government’s total expenditures associated with the Phoenix pay system.
Based on information provided by departments, the following table outlines Phoenix pay system expenditures for 2018–19.
Phoenix pay system expenditures
| Activity | Expenditures |
|---|---|
| Public Services and Procurement Canada (PSPC) | |
| Regular pay operations | 78.2 |
| Extra capacity (includes the Pay Centre, satellite offices and client support) |
143.5 |
| Systems (system fixes and improvements to achieve a stable system, improve compensation advisor efficiencies, and enhance employee user experience) |
126.6 |
| Integrated team (supports government-wide improvements to the system that links human resources and pay information, known as the HR‑to‑pay system) |
23.3 |
| Subtotal | 371.6 |
| Departmental compensation function | |
| Incremental compensation for all departments (incremental compensation expenditures attributable to Phoenix issues, for example, additional compensation advisors) |
104.2 |
| Existing compensation for departments not supported by the Pay Centre (expenditures for regular or ongoing compensation functions) |
33.2 |
| Subtotal | 137.4 |
| Treasury Board of Canada Secretariat (TBS) | |
| HR‑to‑pay stabilization (stakeholder engagement, governance, change management, training, systems changes, data and reporting) |
10.6 |
| Claims office (a temporary office to provide a mechanism for employees who have incurred out‑of‑pocket expenses as a result of not being accurately paid due to the implementation of the Phoenix pay system to file a claim for such expenses) |
1.0 |
| Miscellaneous (includes litigation, communications, and cost estimates) |
1.7 |
| Subtotal | 13.4 |
| Canada Revenue Agency | |
| T4 processing (additional staff to process federal government employee income tax reassessment requests) |
2.1 |
| Subtotal | 2.1 |
| Total | 524.5 |
Table 34 Notes
|
|
The above costs include $27.2 million for employee benefit plans for PSPC ($26.4 million) and TBS ($0.8 million).
The above costs exclude:
- expenditures related to the Next Generation Human Resources and Pay solution
- damages or other claims against the Crown
- opportunity costs for deferred work within departments
Federal tax expenditures
The tax system can be used to achieve public policy objectives through the application of special measures such as low tax rates, exemptions, deductions, deferrals and credits. The Department of Finance Canada publishes cost estimates and projections for these measures each year in the Report on Federal Tax Expenditures. This report also provides detailed background information on tax expenditures, including descriptions, objectives, historical information and references to related federal spending programs. The tax measures presented in this report are the responsibility of the Minister of Finance.
Organizational contact information
Treasury Board of Canada Secretariat
90 Elgin Street
Ottawa, Canada K1A 0R5
Telephone: 613-369-3200
Toll-free: 1-877-636-0656
Teletypewriter (TTY): 613-369-9371
Email: questions@tbs-sct.gc.ca
Website: https://www.canada.ca/en/treasury-board-secretariat.html
Appendix: definitions
- appropriation (crédit)
- Any authority of Parliament to pay money out of the Consolidated Revenue Fund.
- budgetary expenditures (dépenses budgétaires)
- Operating and capital expenditures; transfer payments to other levels of government, organizations or individuals; and payments to Crown corporations.
- Core Responsibility (responsabilité essentielle)
- An enduring function or role performed by a department. The intentions of the department with respect to a Core Responsibility are reflected in one or more related Departmental Results that the department seeks to contribute to or influence.
- Departmental Plan (plan ministériel)
- A report on the plans and expected performance of an appropriated department over a three‑year period. Departmental Plans are tabled in Parliament each spring.
- Departmental Result (résultat ministériel)
- A Departmental Result represents the change or changes that the department seeks to influence. A Departmental Result is often outside departments’ immediate control, but it should be influenced by program‑level outcomes.
- Departmental Result Indicator (indicateur de résultat ministériel)
- A factor or variable that provides a valid and reliable means to measure or describe progress on a Departmental Result.
- Departmental Results Framework (cadre ministériel des résultats)
- Consists of the department’s Core Responsibilities, Departmental Results and Departmental Result Indicators.
- Departmental Results Report (rapport sur les résultats ministériels)
- A report on an appropriated department’s actual accomplishments against the plans, priorities and expected results set out in the corresponding Departmental Plan.
- experimentation (expérimentation)
- Activities that seek to explore, test and compare the effects and impacts of policies, interventions and approaches, to inform evidence‑based decision‑making, by learning what works and what does not.
- full‑time equivalent (équivalent temps plein)
- A measure of the extent to which an employee represents a full person‑year charge against a departmental budget. Full‑time equivalents are calculated as a ratio of assigned hours of work to scheduled hours of work. Scheduled hours of work are set out in collective agreements.
- gender-based analysis plus (GBA+) (analyse comparative entre les sexes plus [ACS+])
- An analytical process used to help identify the potential impacts of policies, Programs and services on diverse groups of women, men and gender differences. We all have multiple identity factors that intersect to make us who we are; GBA+ considers many other identity factors, such as race, ethnicity, religion, age, and mental or physical disability.
- government‑wide priorities (priorités pangouvernementales)
- For the purpose of the 2018–19 Departmental Results Report, those high‑level themes outlining the government’s agenda in the 2015 Speech from the Throne, namely: Growth for the Middle Class; Open and Transparent Government; A Clean Environment and a Strong Economy; Diversity is Canada’s Strength; and Security and Opportunity.
- horizontal initiative (initiative horizontale)
- An initiative where two or more departments are given funding to pursue a shared outcome, often linked to a government priority.
- non‑budgetary expenditures (dépenses non budgétaires)
- Net outlays and receipts related to loans, investments and advances, which change the composition of the financial assets of the Government of Canada.
- performance (rendement)
- What an organization did with its resources to achieve its results, how well those results compare to what the organization intended to achieve, and how well lessons learned have been identified.
- performance indicator (indicateur de rendement)
- A qualitative or quantitative means of measuring an output or outcome, with the intention of gauging the performance of an organization, program, policy or initiative respecting expected results.
- performance reporting (production de rapports sur le rendement)
- The process of communicating evidence‑based performance information. Performance reporting supports decision making, accountability and transparency.
- plan (plan)
- The articulation of strategic choices, which provides information on how an organization intends to achieve its priorities and associated results. Generally a plan will explain the logic behind the strategies chosen and tend to focus on actions that lead up to the expected result.
- planned spending (dépenses prévues)
-
For Departmental Plans and Departmental Results Reports, planned spending refers to those amounts presented in Main Estimates.
A department is expected to be aware of the authorities that it has sought and received. The determination of planned spending is a departmental responsibility, and departments must be able to defend the expenditure and accrual numbers presented in their Departmental Plans and Departmental Results Reports.
- priority (priorité)
- A plan or project that an organization has chosen to focus and report on during the planning period. Priorities represent the things that are most important or what must be done first to support the achievement of the desired Strategic Outcome(s) or Departmental Results.
- program (programme)
- Individual or groups of services, activities or combinations thereof that are managed together within the department and focus on a specific set of outputs, outcomes or service levels.
- result (résultat)
- An external consequence attributed, in part, to an organization, policy, program or initiative. Results are not within the control of a single organization, policy, program or initiative; instead they are within the area of the organization’s influence.
- statutory expenditures (dépenses législatives)
- Expenditures that Parliament has approved through legislation other than appropriation acts. The legislation sets out the purpose of the expenditures and the terms and conditions under which they may be made.
- target (cible)
- A measurable performance or success level that an organization, program or initiative plans to achieve within a specified time period. Targets can be either quantitative or qualitative.
- voted expenditures (dépenses votées)
- Expenditures that Parliament approves annually through an Appropriation Act. The Vote wording becomes the governing conditions under which these expenditures may be made.
© Her Majesty the Queen in Right of Canada, represented by the President of the Treasury Board, 2020,
ISSN: 2561-3561