
Employment Equity in the Public Service of Canada for Fiscal Year 2021 to 2022
On this page
Message from the President of the Treasury Board
I am pleased to present the annual report to Parliament on employment equity in the public service of Canada for the fiscal year 2021–22, the 30th publication of this report.
The year was marked by the evolving COVID-19 pandemic as workplaces began to reopen and restrictions began to be lifted. It was also a year when we continued to reflect and act on the unjust treatment of Black people, Indigenous peoples, and other racialized and marginalized groups in our society. Within the federal public service, the Clerk of the Privy Council’s Call to Action on Anti-Racism, Equity, and Inclusion in the Federal Public Service has seen organizations take additional efforts to appoint more Indigenous, Black, and other racialized employees to leadership positions, as well as establish anti-racism secretariats, as examples.
We are continuing to collect and share data that gives a more accurate depiction of our diverse workforce and this annual report provides an overview of the progress we have made this past fiscal year. For example, we have seen an increase in employment equity representation compared to the previous year. At the aggregate level, women, Indigenous peoples, and members of visible minorities in the public service meet or exceed their workforce availability. And although there is still work needed to increase the number in the general public service population, the number of persons with disabilities exceeds the workforce availability in executive positions. This data shows us encouraging progress and what can be done when everyone comes together in collaboration to support an inclusive and diverse public service.
In our efforts to support persons with disabilities, we continue to develop tools, such as the GC Workplace Accessibility Passport, to improve the recruitment, retention, and advancement of employees with disabilities in support of the Government of Canada’s commitment to hire 5,000 persons with disabilities by 2025.
In the 30 years since Canada’s Employment Equity Act was applied to the federal public service, we have seen greater representation of designated employment equity groups in federal organizations. However, we know there is still work to do. In the next year, for instance, we will launch a government-wide self-identification application for public servants. This application will help us better understand and address representation gaps within organizations through improved programs and policy, hiring, and enhanced career development.
Important progress has been made in the last 30 years, but creating an inclusive and diverse federal public service is an ongoing journey—and one to which the Government of Canada is committed. As the country’s largest employer, we know that strength lies in our diversity, which is why we must continue to work to create a workplace that is truly inclusive and one that better reflects the diverse communities we serve.
I encourage you to read this report to learn how we are building a stronger public service to better serve all Canadians.
Original signed by
Mona Fortier, P.C., M.P.
President of the Treasury Board of Canada
Employment equity in the public service
In this section
The Employment Equity Act is a key element of the legislative authority that helps ensure equity and fairness in the public service. Under the Act, the employer is required to measure progress in terms of representation and continually improve employment equity in the workplace. General representation, where designated groups are represented proportionally overall within the public service, is not sufficient; representation must be reflected in a more profound and targeted way through various indicators.
This report highlights key data that point to gaps in representation. In support of the Clerk of the Privy Council’s Call to Action on Anti-Racism, Equity and Inclusion, there is a new section in this year’s report on data for Black employees.
This report also outlines initiatives being taken within the federal public service to create equitable, diverse and inclusive workplaces that value respect for people. These initiatives focus on the five priorities for employment equity that the Treasury Board of Canada Secretariat (TBS) identified in January 2021:
- generating and publishing data to gain a more accurate picture of representation gaps
- increasing the diversity of senior leaders of the public service
- ensuring that the right benchmarks are in place
- addressing systemic barriers
- promoting engagement and awareness
About this report
The Employment Equity Act came into force in 1986 with the goal of achieving equality in workplaces in Canada. The purpose of this Act is to achieve equality in the workplace so that no person shall be denied employment opportunities or benefits for reasons unrelated to ability and, in the fulfilment of that goal, to correct the conditions of disadvantage in employment experienced by women, Indigenous peoples,Footnote 1 persons with disabilities and members of visible minorities,Footnote 2 by giving effect to the principle that employment equity means more than treating persons in the same way but also requires special measures and accommodations to meet the needs of all employees.
The federal public service of Canada has been subject to the Employment Equity Act and its associated regulations since 1996. Each fiscal year, the President of the Treasury Board must:
- table a report in Parliament on the state of employment equity of the four designated groups within the core public administration
- table similar reports in Parliament produced by separate agencies that have 100 or more employees
This annual report for 2021–22 provides the following:
- statistics on the public service’s performance in creating a representative workforce
- examples of recent activities and strategies to identify, prevent and eliminate barriers to the full participation of members of the employment equity groups in all aspects of the workplace and the life cycle of employees within the organization
The statistical tables in this report’s appendix present information as of March 31, 2022, for indeterminate, term employees of three months or more, and seasonal employees of organizations listed in Schedules I and IV of the Financial Administration Act. Notes on the data presented in the tables are available in the About the data section of this report.
Core public administration
Infographic 1: overview of employment equityin the core public administration (2021–22)
The core public administration population number for employment equity purposes includes indeterminate, term employees of three months or more, and seasonal employees of organizations listed in Schedules I and IV of the Financial Administration Act. Employees on leave without pay, term employees less than three months, students and casual workers, Governor in Council appointees, Ministers’ exempt staff, federal judges, and deputy ministers are excluded.
Internal representation is based on those who have voluntarily chosen to self-identify and self-declare to date as an Indigenous person, a person with a disability and/or a person in a visible minority group, while sex information is taken from the pay system.
Workforce availability (WFA) is calculated based on the 2016 Census and the 2017 Canadian Survey on Disability.
Figures in square brackets represent the change since 2020–21.
Infographic 1 - Text version
Note: Figures in square brackets represent the change since 2020–21.
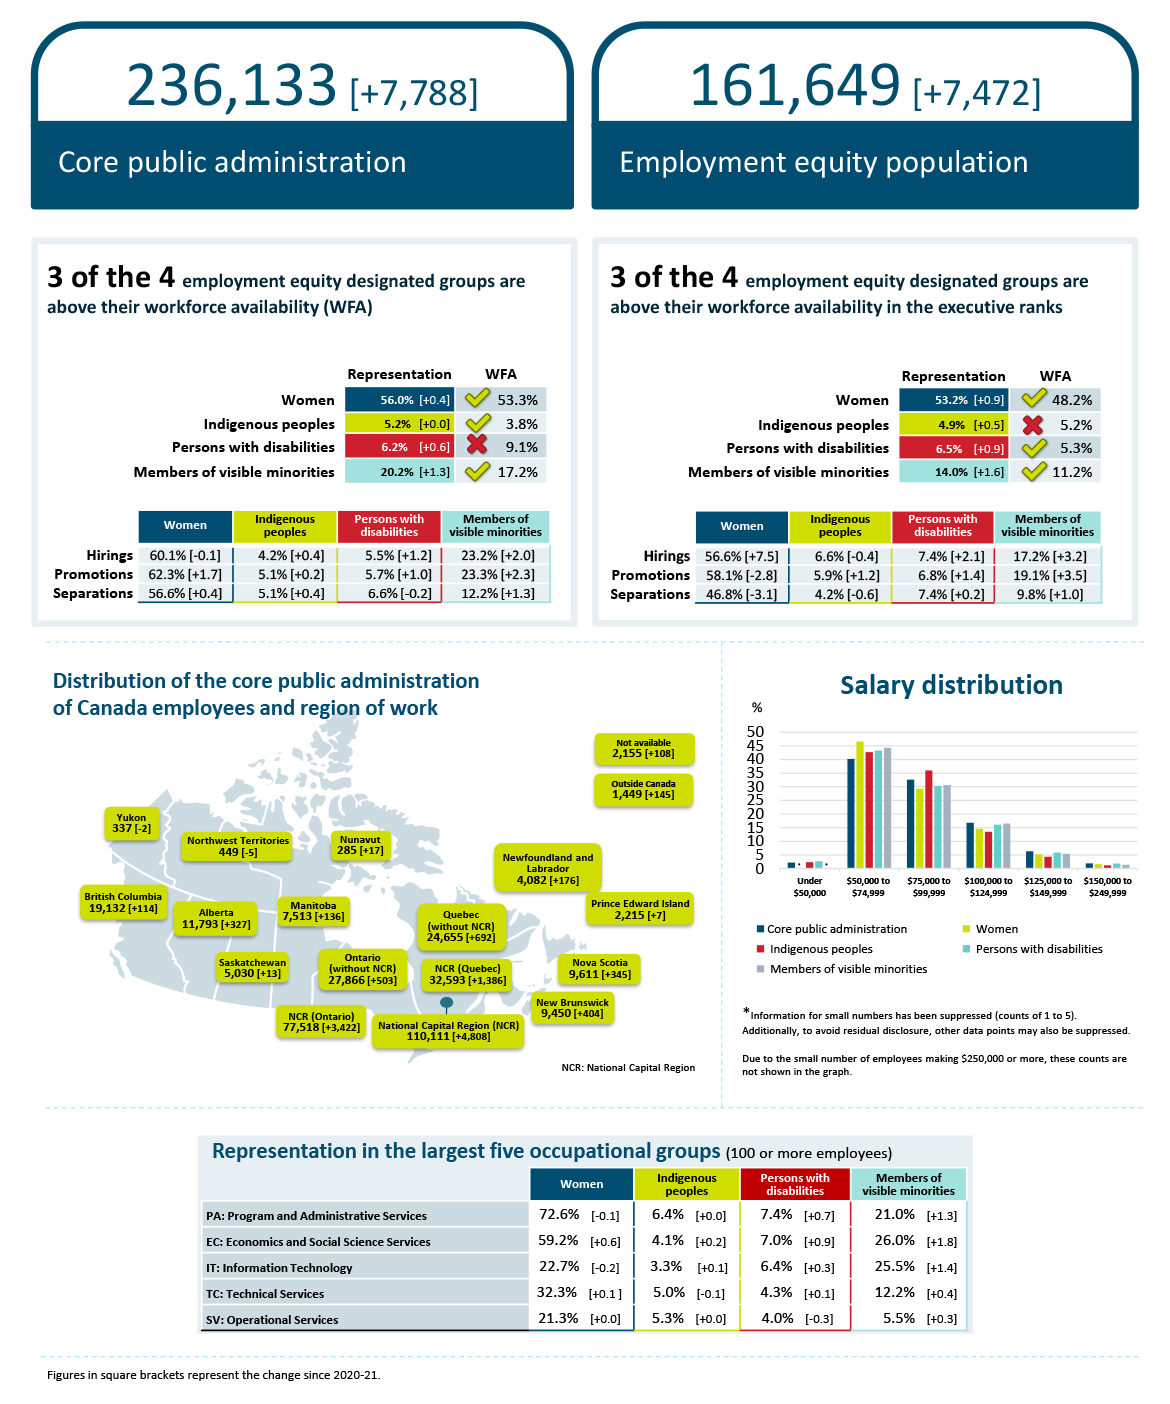
Core public administration representation in numbers: 236,133 [increase of 7,788]
Employment equity population representation in numbers: 161,649 [increase of 7,472]
3 of the 4 employment equity designated groups are above workforce availability.
Core public administration representation and workforce availability
- 56.0% are women, which is higher than their workforce availability of 53.3% and has an increase of 0.4 percentage points from last year’s report
- 5.2% have identified themselves as Indigenous, which is higher than their workforce availability of 3.8% and is at the same representation rate from last year’s report
- 6.2% have identified themselves as a person with a disability, which is lower than their workforce availability of 9.1% and has an increase of 0.6 percentage points from last year’s report
- 20.2% have identified themselves as a member of visible minorities, which is higher than their workforce availability of 17.2% and has an increase of 1.3 percentage points from last year’s report
Degree of representation for hirings, promotions and separations
| Action type | Women | Indigenous peoples | Persons with disabilities | Members of visible minorities |
|---|---|---|---|---|
Hirings |
60.1% [decrease of 0.1 percentage points] |
4.2% [increase of 0.4 percentage points] |
5.5% [increase of 1.2 percentage points] |
23.2% [increase of 2.0 percentage points] |
Promotions |
62.3% [increase of 1.7 percentage points] |
5.1% [increase of 0.2 percentage points] |
5.7% [increase of 1.0 percentage points] |
23.3% [increase of 2.3 percentage points] |
Separations |
56.6% [increase of 0.4 percentage points] |
5.1% [increase of 0.4 percentage points] |
6.6% [decrease of 0.2 percentage points] |
12.2% [increase of 1.3 percentage points] |
Core public administration representation in the executive ranks
3 of the 4 employment equity designated groups are above workforce availability in the executive ranks:
- 53.2% are women, which is higher than their workforce availability of 48.2% and has an increase of 0.9 percentage points from last year’s report
- 4.9% have identified themselves as Indigenous, which is lower than their workforce availability of 5.2% and has an increase of 0.5 percentage points from last year’s report
- 6.5% have identified themselves as a person with a disability, which is higher than their workforce availability of 5.3% and has an increase of 0.9 percentage points from last year’s report
- 14.0% have identified themselves as a member of visible minorities, which is higher than their workforce availability of 11.2% and has an increase of 1.6 percentage points from last year’s report
Degree of representation for hirings, promotions and separations in the executive ranks
| Action type | Women | Indigenous peoples | Persons with disabilities | Members of visible minorities |
|---|---|---|---|---|
Hirings |
56.6% [increase of 7.5 percentage points] |
6.6% [decrease of 0.4 percentage points] |
7.4% [increase of 2.1 percentage points] |
17.2% [increase of 3.2 percentage points] |
Promotions |
58.1% [decrease of 2.8 percentage points] |
5.9% [increase of 1.2 percentage points] |
6.8% [increase of 1.4 percentage points] |
19.1% [increase of 3.5 percentage points] |
Separations |
46.8% [decrease of 3.1 percentage points] |
4.2% [decrease of 0.6 percentage points] |
7.4% [increase of 0.2 percentage points] |
9.8% [increase of 1.0 percentage points] |
Salary distribution
| Salary range | Core public administration | Women | Indigenous peoples | Persons with disabilities | Members of visible minorities |
|---|---|---|---|---|---|
Under $50,000 |
2.2% | Footnote * | 2.3% | 2.7% | Footnote * |
$50,000 to $74,999 |
40.2% | 46.6% | 42.7% | 43.3% | 44.3% |
$75,000 to $99,999 |
32.6% | 29.3% | 36.0% | 30.3% | 30.6% |
$100,000 to $124,999 |
16.8% | 14.6% | 13.5% | 16.1% | 16.5% |
$125,000 to $149,000 |
6.3% | 5.2% | 4.3% | 5.8% | 5.4% |
$150,000 to $249,999 |
1.9% | 1.6% | 1.2% | 1.8% | 1.4% |
Distribution of the core public administration of Canada employees and region of work
Following are subtotals by province, territory and other categories:
- Newfoundland and Labrador: 4,082 [increase of 176]
- Prince Edward Island: 2,215 [increase of 7]
- Nova Scotia: 9,611 [increase of 345]
- New Brunswick: 9,450 [increase of increase of 404]
- Quebec (without the National Capital Region): 24,655 [increase of 692]
- National Capital Region (Quebec): 32,593 [increase of 1,386]
- National Capital Region (Ontario): 77,518 [increase of 3,422]
- National Capital Region: 110,111 [increase of 4,808]
- Ontario (without the National Capital Region): 27,866 [increase of 503]
- Manitoba: 7,513 [increase of 136]
- Saskatchewan: 5,030 [increase of 13]
- Alberta: 11,793 [increase of 327]
- British Columbia: 19,132 [increase of 114]
- Yukon: 337 [decrease of 2]
- Northwest Territories: 449 [decrease of 5]
- Nunavut: 285 [increase of 17]
- Outside Canada: 1,449 [increase of 145]
- Not available: 2,155 [increase of 108]
Representation in the largest 5 occupational groups (100 or more employees)
Note: Includes classifications with 100 or more employees in the given employment equity group
| Occupational group | Women | Indigenous peoples | Persons with disabilities | Members of visible minorities |
|---|---|---|---|---|
PA: Program and Administrative Services |
72.6% [decrease of 0.1 percentage points] |
6.4% [0.0 percentage points] |
7.4% [increase of 0.7 percentage points] |
21.0% [increase of 1.3 percentage points] |
EC: Economics and Social Science Services |
59.2% [increase of 0.6 percentage points] |
4.1% [increase of 0.2 percentage points] |
7.0% [increase of 0.9 percentage points] |
26.0% [increase of 1.8 percentage points] |
IT: Information Technology |
22.7% [decrease of 0.2 percentage points] |
3.3% [increase of 0.1 percentage points] |
6.4% [increase of 0.3 percentage points] |
25.5% [increase of 1.4 percentage points] |
TC: Technical Services |
32.3% [increase of 0.1 percentage points] |
5.0% [decrease of 0.1 percentage points] |
4.3% [increase of 0.1 percentage points] |
12.2% [increase of 0.4 percentage points] |
SV: Operational Services |
21.3% [0.0 percentage points] |
5.3% [0.0 percentage points] |
4.0% [decrease of 0.3 percentage points] |
5.5% [increase of 0.3 percentage points] |
Observations
In 2021–22, the size of the core public administration population increased by 7,788 employees. The number of employees who identified as belonging to employment equity groups also increased, accounting for 161,649 of a total of 236,133 employees.
Representation data of all employees in general, and specifically for executives, shows that members of visible minorities and women both exceed their WFA.
Indigenous representation for all employees, at 5.2%, exceeds their WFA of 3.8%. Their share of hiring (4.2%) increased slightly from the previous year (3.8%). The share of promotions, at 5.1%, is also a slight increase of 0.2 percentage points from the previous year. The share of separations, measured at 5.1%, increased by 0.4 percentage points from the previous year. Further context and analysis for this data is available in Many Voices One Mind: A Pathway to Reconciliation.
Persons with disabilities continue to be under-represented. Their share of hiring, at 5.5%, and promotions, at 5.7%, are below their WFA of 9.1%. The share of separations for this group, at 6.6%, is above their representation within the core public administration. Table 5 in the appendix shows that there were fewer separations (1,097) than hirings (1,601) among this group in 2021–22.
It must be noted that, as indicated in the About the data section of this report, WFA estimates for persons with disabilities increased substantially between the last two censuses and the Canadian Survey on Disability. This increase is because the 2017 Canadian Survey on Disability expanded the definition of “persons with disabilities” to include disabilities related to pain and mental health. The self-identification data collected for the public service prior to 2023 is not based on this expanded definition. A new self-identification questionnaire has been developed and is expected to provide a more accurate picture in relation to this new definition once fully implemented in 2024.
The largest concentration of employees in the core public administration is in the Program and Administrative Services (PA) group, followed by the Economics and Social Science Services (EC) group and the Information Technology (IT) group. Compared with the previous fiscal year, there was an increase of 1.8 percentage points among the visible minority group in the EC group.
The proportion of women is higher in the $50,000 to $74,999 salary range compared with the core public administration and all other equity groups. The proportion of Indigenous peoples is higher in the $75,000 to $99,999 salary range and lower in the salary ranges of $100,000 to $124,999, $125,000 to $149,999, and $150,000 to $249,999 compared with the core public administration and the other three equity groups. For salaries under $50,000, the proportions of Indigenous peoples, persons with disabilities and women are higher compared with the core public administration.
Public service–wide initiatives on diversity and inclusion: five areas of focus
1. Generate and publish data for a more accurate picture of representation gaps
Creating a representative and inclusive workplace that reflects the population it serves begins with improving the availability and reliability of existing data.
Access to disaggregated data is critical to understanding gaps in representation and informing decisions for action. In 2021–22, TBS made it a priority to release an unprecedented amount of disaggregated data on the Diversity and inclusion statistics web page that provide views into the composition of employment equity subgroups. TBS’s Office of the Chief Human Resources Officer (OCHRO) launched an online interactive data visualization tool in April 2021 that allows users to manipulate data on the demographics and employment equity of human resources for the core public administration. This tool is continuously updated with the latest data as it becomes available.
Improving the accuracy and timeliness of data was another TBS priority in 2021–22. Representation numbers are based on employees who have chosen to self-identify, and the effectiveness of the self-identification process is key to measuring progress in rates of representation, hiring, promotion and separation. The Self-Identification Modernization Project, launched in 2020, aims to increase the accuracy, depth and breadth of this data across the Government of Canada. In 2021–22, the project began implementation, with the self-identification questionnaire becoming available on a new, centralized application hosted by TBS. This change will:
- provide more timely and reliable data
- improve accessibility for persons with disabilities
- make updating the questionnaire easier
- eliminate the need for employees to self-identify when they change departments
Privacy considerations also prompted TBS to develop guidance on the proper use of confidential data. The new application will also provide more control over data security and access. It will also enhance privacy.
The new self-identification questionnaire was updated in consultation with equity-seeking groups. It offers an expanded set of identity options (for example, gender, ethnic origin, 2SLGBTQIA+Footnote 3) that enable all employees to see themselves represented within the public service.
In 2021–22, the Public Service Commission of Canada’s (PSC’s) diversity and inclusion research and data focused on three initiatives:
- The PSC created a workforce macrosimulation tool, which can project renewal and representation in the public service using different scenarios that include employment equity representation. Each year or upon request, the PSC provides deputy heads and heads of human resources with customized estimates of the level of recruitment required to meet the goal of hiring 5,000 net new employees with disabilities.
- The PSC also manages a data visualization hub, which offers interactive visualizations of data for departments to explore employment equity information and recruitment trends. This complements TBS’s interactive data visualization tool, which provides the official employment trends and demographic statistics as well as reference data pertaining to employment equity workforce availability benchmarks.
- The Employment Equity Research Working Group, established and chaired by the PSC, is an interdepartmental group for economists, statisticians and experts in the field of employment equity to share information and research on barriers to employment equity groups.
The PSC plans to publish the following updates and new reports on employment equity, diversity and staffing processes:
- a Diversity and Inclusion Scorecard will monitor the progress of diversity and inclusion in federal workplaces by analyzing the career progression of applicants, indeterminate staff and employees leaving the public service by comparing annual trends of related demographic variables
- analyses published every two years on trends in hiring, movement, citizenship and separation for employment equity groups and subgroups
- thematic reports on persons with disabilities and employment equity groups based on Statistics Canada’s 2021 Staffing and Non-Partisanship Survey (SNPS) results, with reports developed in consultation with key stakeholders
- integration of new questions for the SNPS to collect data and explore perceptions of equity-seeking groups, including questions on sexual orientation and religion and on demographics, such as marital status and family status
2. Increase the diversity of senior leaders of the public service
Increasing diversity among senior leaders of the public service is key to establishing a culture of inclusiveness that will help combat racism and address systemic barriers. Efforts include recruitment and promotion through developmental programs that offer mentoring and sponsorship opportunities to high-potential employees who may face barriers. Representation at the senior level matters because when decision-makers have diverse backgrounds, biases and barriers can be identified and broken. Seeing leaders resemble one’s own background also provides inspiration and aspiration. Diversity brings together different ideas, stronger innovation and ultimately better service for Canadians.
In June 2021, the Clerk of the Privy Council sent a Message and guidance for letters on the implementation of the Call to Action on Anti-Racism, Equity and Inclusion to deputy ministers, heads of separate agencies and heads of federal agencies. The Clerk asked them to outline their progress on the Call to Action on Anti-Racism, Equity and Inclusion in the Federal Public Service.
The Clerk subsequently received letters on implementation that detail the actions of federal organizations and early impacts.
Since its release, the Call to Action has helped generate some positive momentum, including:
- a greater number of Indigenous, Black and other racialized employees have been appointed to leadership positions than they have in the past
- the number of anti-racism secretariats and dedicated task teams has more than tripled since the Clerk issued the Call to Action
- departments have put in place targeted initiatives to support the career development of Indigenous, Black and other racialized employees
- new and existing employee networks and communities continue to:
- speak up in their organizations and across the public service
- lead initiatives
- work together to advance the Call to Action and improve workplaces for Indigenous employees, Black and other racialized employees, religious minority employees, 2SLGBTQI+Footnote 4 employees, and employees with disabilities
More examples of early actions can be found in the Clerk’s 29th Annual Report to the Prime Minister on the Public Service of Canada. As work progresses on the Call to Action, there will be increased attention on which activities are translating into results.
Through OCHRO, in 2021–22, TBS established two tailored talent-enabling strategies to increase representation and reduce barriers for Black and Indigenous executives. These strategies, co-developed with partners and employee networks, provide a framework to meet equity, diversity and inclusion commitments that have specific goals and actions in key areas, including succession planning and leadership development. Work continues in supporting a change in culture that is lasting and inclusive. Current challenges are biases in human resources processes and limits to data allowing for continuous monitoring and improvement of implementation of the talent-enabling strategies.
In 2022–23, OCHRO will focus on the development of a performance measurement framework to ensure that progress can be clearly defined when assessing the two tailored talent-enabling strategies.
OCHRO continues to increase diversity through the Executive Leadership Development Program. This program, launched in 2016, had a record year for diversity in 2020:
- 63% of participants were women
- 52% of participants were from at least one other employment equity group
- 7% of participants were Black
The 2021 cohort achieved a new record, with 61% of participants identifying as a member of one or more of three employment equity groups (visible minorities, Indigenous peoples and persons with disabilities).
OCHRO also developed guidance and training for senior managers involved in executive talent management to facilitate the objective assessment of talent. As part of the Assistant Deputy Minister talent management cycle in winter 2022, OCHRO designated Deputy Head Inclusion Stewards for functional clusters of departments to help identify and mitigate unconscious bias and foster inclusion. OCHRO’s expectations of leaders will be reviewed to emphasize a people-first approach, with a particular focus on respect and commitment to diversity. A new iteration of Deputy Head Inclusion Stewards will be implemented as part of the 2022‒23 Assistant Deputy Minister talent management cycle, and an implementation package will be shared with departments to support them in adapting the Inclusion Stewards initiative into talent management for other groups and levels. In addition, the self-identification modernization efforts will continue to progress toward a new questionnaire, which will allow for richer data collection on the career progression of diverse executives.
The Mosaic Leadership Development Program provides equity-seeking employees from under-represented communities with opportunities to overcome barriers and successfully enter the executive group. It has four main components:
- sponsorship
- a multi-dimensional learning curriculum
- experience-building opportunities
- assessment by a diverse selection board against an EX-01 position identified by the organization
In 2021–22, the program was preparing to launch its first cohort of 38 participants from 36 federal organizations.
The Mentorship Plus program supports career progression for equity-seeking groups. This program enhances traditional mentorship by adding the element of sponsorship. Pairing employees with executive mentors and sponsors improves career mobility, provides participants with better visibility, and offers access to development opportunities. In 2021–22, the Mentorship Plus program had been implemented in 48 organizations across the public service.
3. Address systemic barriers
Systemic barriers result from seemingly neutral systems, policies and practices, traditions or cultures that disadvantage certain individuals or groups of people.Footnote 5
Amendments to the Public Service Employment Act received royal assent on June 29, 2021. These amendments:
- reaffirm commitment by the Government of Canada to foster a public service that represents Canada’s diversity
- require that the establishment or review of qualification standards include an evaluation of bias and barriers for members of equity-seeking groups
- require that the design and application of assessment methods include an evaluation of bias and barriers for members of equity-seeking groups, and that reasonable mitigation efforts be made
- provide explicit authorities to investigate and audit bias or barriers that disadvantage members of equity-seeking groups
- expand the preference for Canadian citizens in external advertised staffing processes to include permanent residents
To align with this amendment, the Policy on People Management, which governs the Directive on Student Employment, has been amended to:
- include a definition of “Canadian students”
- provide students who are permanent residents with a preference for appointment equal to those who are Canadian citizens
In 2021, the Government of Canada established the 12-member Employment Equity Act Review Task Force to work at arm’s length from the government and conduct a comprehensive review of the Employment Equity Act. Its mandate is to study, consult and advise on how a renewed employment equity regime could be modernized.
The task force is engaging with stakeholders on renewing the Act and is considering the experiences of:
- women
- 2SLGBTQI+ Canadians
- Indigenous peoples
- Black and racialized Canadians
- persons with disabilities
- other under-represented groups in federally regulated workplaces
The task force’s goal is to ensure that the Act reflects the realities of today’s workplaces. The task force has been asked to make concrete, independent and evidence-based recommendations to the Minister of Labour on how to modernize the Act.
OCHRO has worked closely with the task force’s secretariat to provide its members with the perspectives of employees working in the core public administration. In addition, the Chief Human Resources Officer has made recommendations to the task force on aspirational and pragmatic changes to advance equity, diversity and inclusion in the public service. These recommendations were based on over 100 written submissions and feedback received in 10 engagement sessions with over 600 employees, including:
- equity-seeking employee networks
- managers
- designated senior officials for employment equity, diversity and inclusion
- members of Employment Equity Champions and Chairs Committees and Circle
In 2021–22, to address accessibility issues and to support the Accessibility Strategy for the Public Service of Canada, developed in response to the Accessible Canada Act, TBS’s Office of Public Service Accessibility:
- continued to manage the five-year, $10 million Centralized Enabling Workplace Fund (2019–24) to invest in innovative and experimental ideas, projects and initiatives to improve workplace accommodation practices and remove systemic barriers that create a need for individual accommodation. Examples of projects that the fund supported include:
- the Lending Library Service pilot project, which offers short-term public service employees who have disabilities or injuries access to specialized accessibility services, workplace accommodations, and loans of software and hardware
- a lighting pilot project to test lighting solutions to reduce barriers for public servants who have light sensitivities, in collaboration with Public Services and Procurement Canada and National Research Council Canada
- the Neurodiversity Recruitment Pilot project to recruit and onboard neurodivergent talent into the federal public service in partnership with Shared Services Canada, the Financial Transactions and Reports Analysis Centre of Canada, and the PSC
- supported the launch of the Government of Canada Workplace Accessibility Passport, which streamlines the workplace accommodation process and documents an agreement on the tools and support measures employees need to succeed in their jobs
- launched the Accessibility Self-Assessment Tool to support departments and agencies in drafting their first accessibility plans
To improve accommodation practices, the Management Accountability Framework was used to advance accessibility across government. Although most federal organizations collect some information on their accommodation process, most departments and agencies have more work to do to meaningfully improve their accommodation processes and the experiences of persons with disabilities in the public service.
Published in 2021, English and French: Towards a Substantive Equality of Official Languages in Canada explores modernization of the Official Languages Act through administrative measures to promote the substantive equality of both official languages. OCHRO is exploring options for a new second-language training framework for the public service that would make bilingualism more accessible to all public servants. The framework will:
- be developed to ensure quality instruction and be adapted to learners’ specific needs, including Indigenous people and persons with disabilities
- include options for remote language training to meet the needs of a more dispersed workforce
- establish the principles, objectives and expectations for language training that should be common to all departments, while developing approaches to address specific departmental realities
In 2022 and 2023, OCHRO will discuss barriers to language training with members of employment equity groups for inclusion in the language training framework.
Some departments have taken the lead to ensure that official languages training is available to members of employment equity groups. For example, Public Services and Procurement Canada has been running a bursary program since 2017. Its Second Language Scholarship Program was created to remove barriers to career advancement for Indigenous employees, employees who are visible minorities, employees with disabilities and, since 2022, 2SLGBTQIA+ employees. This initiative provides second language scholarships of up to 250 hours of individual language training to indeterminate employees across the department.
In December 2021, the PSC posted an additional advertisement for Indigenous candidates interested in the Recruitment of Policy Leaders (RPL) program because no candidates who self-declared as Indigenous had qualified in the previous two RPL processes. The assessment of most candidates has been completed, with five Indigenous candidates successfully placed in the RPL pool (EC-05 to EC-07). An additional six Indigenous candidates were offered the opportunity to be included in the Emerging Talent Pool (EC-04), and two candidates accepted. There are plans to launch RPL advertisements that are more focused toward Indigenous peoples and persons with disabilities.
The Audit of Employment Equity Representation in Recruitment, published by the PSC in January 2021, showed that employment equity groups did not remain proportionately represented throughout the five stages of the appointment process. Three recommendations were made to help identify and eliminate potential barriers and biases in appointment processes, with the PSC being responsible for several key deliverables. Eight of 14 PSC deliverables have been closed, and 87% of organizations have initiated a review of their staffing frameworks and practices. To address the audit’s results and recommendations, the PSC developed and updated guidance on staffing options to increase representation. The PSC has taken the following actions, among others:
- requiring training for hiring managers on unconscious bias in recruitment
- encouraging the use of diverse selection boards
- strengthening employment equity obligations for deputy heads, including the need to review their staffing frameworks and practices to ensure barrier-free appointment processes for employment equity groups
- issuing guidance on updating employment systems in collaboration with TBS
- working with the Canadian Association for Supported Employment to identify supports needed for persons with disabilities
- establishing an inventory of persons with disabilities in partnership with the Human Resources Council
- expanding the Assessment Accessibility Ambassadors Network (accessible only on the Government of Canada network) to continue to support the human resources community in improving accessibility of appointment processes
An audit on employment equity representation in acting appointments is underway, as are plans for an audit on biases and barriers in the pre-assessment process.
In response to the Horizontal Audit of Student Hiring Under the Federal Student Work Experience Program, released by the PSC in August 2021, OCHRO is working with the PSC to ensure fair access to employment for students from equity-seeking groups and enhance recruitment and retention support.
TBS and the Professional Institute of the Public Service of Canada both embrace the importance of making the language of collective agreements as gender-neutral and inclusive as possible to avoid bias against a particular sex, social gender or gender identity. The Joint Committee on Gender-Neutral and Inclusive Collective Agreement Language was established and has developed two practical guides to help the parties integrate gender-neutral and inclusive language into existing collective agreements and in future drafting of provisions during collective bargaining.
OCHRO has made contributions to Future of Work initiatives on remote, hybrid and telework arrangements through guidance and direction to organizations, with a focus on the duty to accommodate and accessibility. A refreshed web presence promotes a barrier-free workplace through flexible and equitable working arrangements, including Guidance on Optimizing a Hybrid Workforce, published in May 2022, with guidance effective as of November 2021.
4. Establish the right benchmarks
Benchmarks are used to guide the development of strategies that will strengthen diverse representation throughout the federal public service.
In 2021–22, in support of the Employment Equity Act Review Task Force secretariat, OCHRO continued to work with partners to ensure that the public service applies appropriate benchmarks for assessing representation in the federal public service. The current employment equity benchmark for the public service is workforce availability (WFA). WFA includes Canadian citizens and permanent residents (as of March 2022) who are active in the labour market and are at least 15 years of age and is based on occupations in the Canadian workforce that correspond to the occupations in the public service.
The review of the benchmark stems from three main concerns expressed by stakeholders:
- using WFA to report on representation for employment equity groups may not provide an accurate picture of the workforce and may be too low for what would be required if Labour Market Availability (LMA) were applied
- WFA and LMA are based on census data (the most recent is the 2016 Census), which may not reflect the fast-changing composition of the Canadian labour market
- benchmarks by disaggregated employment equity groups are not currently available
In 2021–22, OCHRO began to review the common understanding of the criteria being applied and consulted with partners to review current practices and potential changes that would improve demographic projections and benchmarks for disaggregated data. OCHRO will conduct further analysis and consultations in 2022–23 and will provide recommendations to the Employment Equity Act Review Task Force.
5. Engagement and awareness
Much of TBS’s work on employment equity is co-developed with the diverse communities it serves. We recognize the importance of valuing the experience and expertise of public servants to complement the data that we are collecting. We want to amplify those voices and connect public servants with the issues and ideas that impact their workplaces. TBS is committed to increasing awareness of diversity and inclusion by leveraging the experiences of community stakeholder groups and fostering ongoing dialogue for positive change.
Through the Centre on Diversity and Inclusion (CDI), TBS engages key partners and stakeholders to co-design initiatives, share information and best practices, and consult on key questions. Stakeholders and partners include:
- the Designated Senior Officials on Employment Equity, Diversity and InclusionFootnote 6 community of practice
- over 20 equity-seeking employee networks
- the Employment Equity Champions and Chairs Committees and Circle
- organizational anti-racism secretariats
- the Human Resources Council
In 2021–22, CDI consulted stakeholders and partners on a variety of initiatives, including:
- the Mosaic leadership development program
- the Maturity Model for Diversity and Inclusion
- developing a model for leadership expectations for the public service
- improving quantitative and qualitative disaggregated data
These CDI initiatives also enabled the PSC to receive feedback on:
- regulatory initiatives that support diversity and inclusion
- topics for future audits on diversity and inclusion
- investigative authorities
The Federal Speakers’ Forum on Diversity and Inclusion gives opportunities to public servants to share their stories and discuss their lived experiences, which raises awareness of diversity and inclusion topics and helps shift mindsets and behaviours by opening hearts and minds. In 2021–22, this program successfully matched 111 speakers with various Government of Canada events.
In fall 2021, in partnership with CDI, Statistics Canada and Canadian Heritage, the Canada School of Public Service (CSPS) hosted a three-day Diversity and Inclusion Conference focused on moving from awareness to action. Attended by over 6,000 participants, this event showcased results of several departments and agencies in response to the Clerk’s Call to Action. Panellists at the conference discussed topics such as:
- how diversity and inclusion lead to culture change
- privilege and unconscious bias
- allyship
- tools and networks to strengthen diversity and inclusion practices
The goals of the conference were to:
- share innovative and functional practices
- outline past accomplishments and plans for future work
- provide data, share tools and discuss the existing support networks to create and sustain a work environment and culture that is diverse and inclusive by default
In 2021–22, the CSPS held 56 virtually facilitated sessions of courses on the Positive Space Initiative:
- “2SLGBTQI+ Awareness” (1,083 registrants)
- 36 virtually facilitated sessions of the course “Positive Space Initiative: Becoming an Ambassador for 2SLGBTQI+ Inclusion” (613 registrants)
CSPS also:
- launched a new job aid called “Being a 2SLGBTQI+ Ally”
- hosted three events on 2SLGBTQI+ inclusion for a total of 3,816 participants
- continued to provide learning sessions on preventing harassment and violence, with over 349,000 registrants on CSPS’s three online self-paced platforms
- developed and launched an online tool to support knowledge retention and engage employees on this topic; the MyHealthyWorkplace.ca site had over 6,000 users in 2021–22
- launched 22 complementary tools and resources for employees, managers, health and safety committees, and designated recipients
- hosted four events on healthy workplaces for a total of 4,354 participants
Designated groups
In this section
- Women
- Indigenous peoples
- Observations
- Initiatives to support Indigenous peoples
- “A place for us too”: Indigenous IT recruitment in the Government of Canada – Employment and Social Development Canada
- Knowledge Circle for Indigenous Inclusion: Canadian Heritage
- Joint Report on the Use of Indigenous Languages: Public Service Alliance of Canada and Treasury Board of Canada Secretariat
- Indigenous learning: Canada School of Public Service
- Indigenous Student Employment Opportunity: Public Service Commission
- Indigenous Career Pathways: Public Service Commission of Canada
- Persons with disabilities
- Observations
- Initiatives for persons with disabilities
- Accessibility Strategy: Office of Public Service Accessibility
- Official Languages Centre of Excellence: Office of the Chief Human Resources Officer
- Public Service Commission recruitment initiatives
- New disability inclusion course and e-learning modules on neurodiversity: Canada School of Public Service
- Members of visible minorities
- Black communities
Women
Infographic 2: women working in the core public administration (2021–22)
The core public administration population number for employment equity purposes includes indeterminate, term employees of three months or more, and seasonal employees of organizations listed in Schedules I and IV of the Financial Administration Act. Employees on leave without pay, term employees less than three months, students and casual workers, Governor in Council appointees, Ministers’ exempt staff, federal judges, and deputy ministers are excluded.
Internal representation is based on those who have voluntarily chosen to self-identify and self-declare to date as an Indigenous person, a person with a disability and/or a person in a visible minority group, while sex information is taken from the pay system.
Workforce availability (WFA) is calculated based on the 2016 Census and the 2017 Canadian Survey on Disability.
Figures in square brackets represent the change since 2020–21.
Infographic 2 - Text version
Note: Figures in square brackets represent the change since 2020–21.
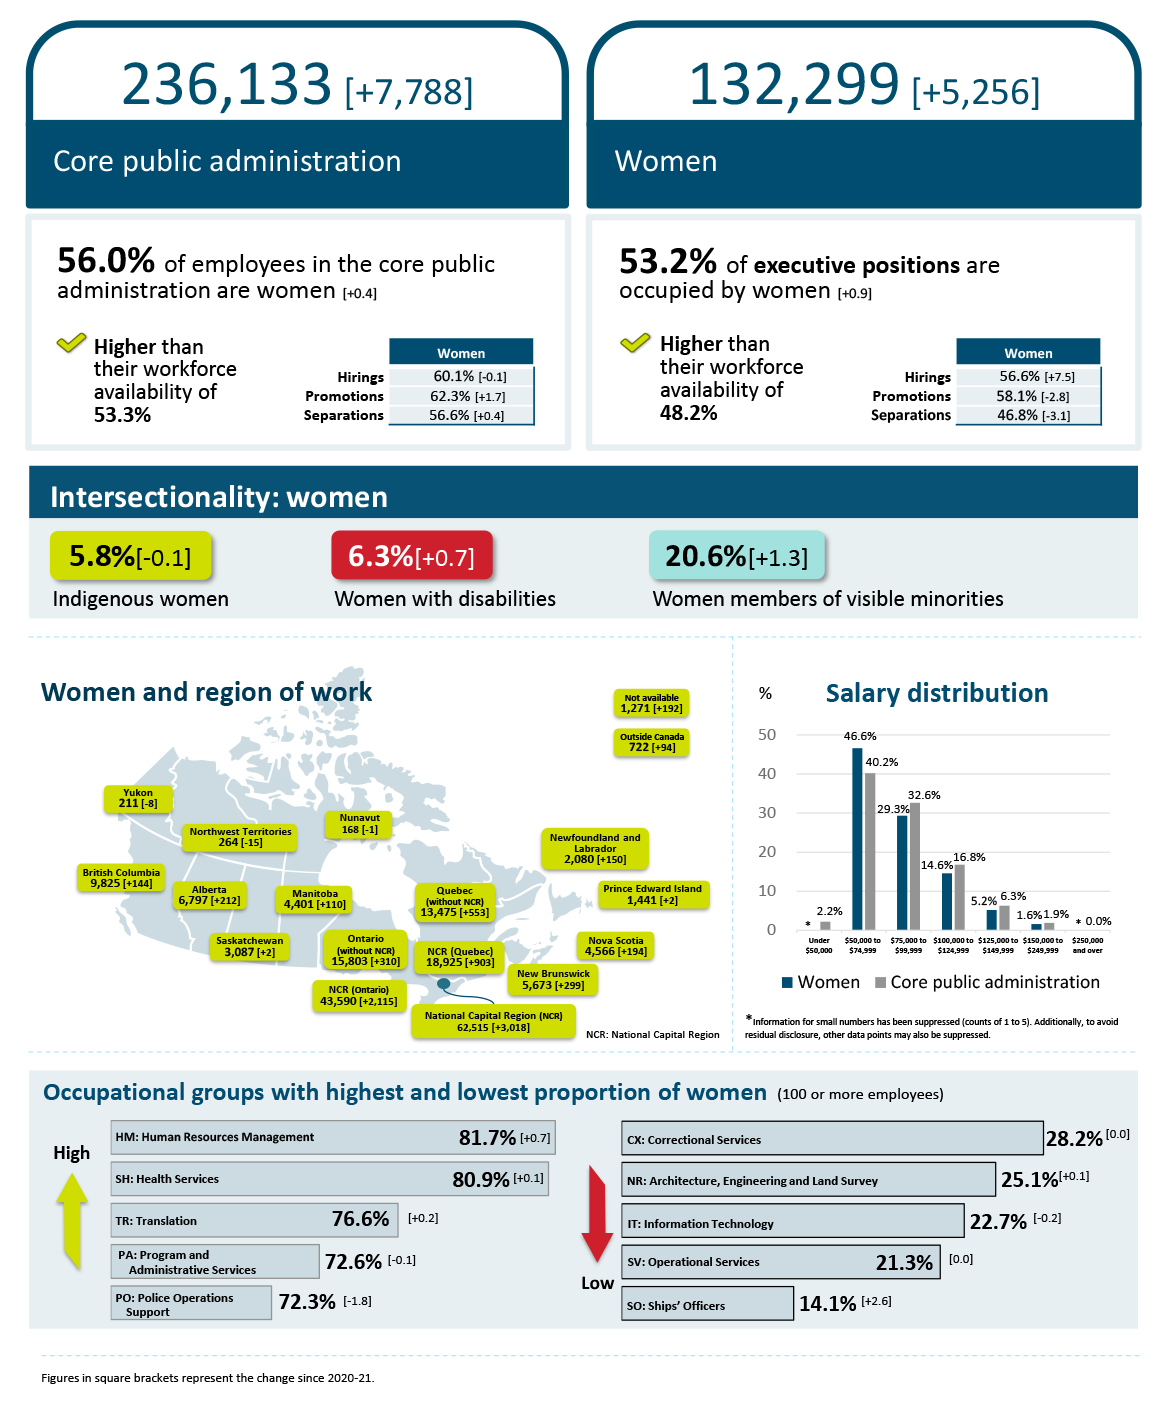
Core public administration population: 236,133 [increase of 7,788]
Women representation in numbers: 132,299 [increase of 5,256]
56.0% of employees in the core public administration are women, an increase of 0.4 percentage points from last year’s report and higher than their workforce availability of 53.3%.
Degree of representation for hirings, promotions and separations
| Action type | Women |
|---|---|
| Hirings | 60.1% [decrease of 0.1 percentage points] |
| Promotions | 62.3% [increase of 1.7 percentage points] |
| Separations | 56.6% [increase of 0.4 percentage points] |
53.2% of executive positions are occupied by women, an increase of 0.9 percentage points from last year’s report and higher than their workforce availability of 48.2%.
| Action type | Women |
|---|---|
| Hirings | 56.6% [increase of 7.5 percentage points] |
| Promotions | 58.1% [decrease of 2.8 percentage points] |
| Separations | 46.8% [decrease of 3.1 percentage points] |
Salary distribution
| Salary range | Women | Core public administration |
|---|---|---|
| Under $50,000 | Footnote * | 2.2% |
| $50,000 to $74,999 | 46.6% | 40.2% |
| $75,000 to $99,999 | 29.3% | 32.6% |
| $100,000 to $124,999 | 14.6% | 16.8% |
| $125,000 to $149,000 | 5.2% | 6.3% |
| $150,000 to $249,999 | 1.6% | 1.9% |
| $250,000 and over | Footnote * | 0.0% |
Intersectionality analysis for women
Of the 56% of employees who are women:
- 5.8% have identified themselves as Indigenous, a decrease of 0.1 percentage points from last year
- 6.3% have identified themselves as a person with a disability, an increase of 0.7 percentage points from last year
- 20.6% have identified themselves as a member of visible minorities, an increase of 1.3 percentage points from last year
Women and region of work
- Newfoundland and Labrador: 2,080 [increase of 150]
- Prince Edward Island: 1,441 [increase of 2]
- Nova Scotia: 4,566 [increase of 194]
- New Brunswick: 5,673 [increase of 299]
- Quebec (without the National Capital Region): 13,475 [increase of 553]
- National Capital Region (Quebec): 18,925 [increase of 903]
- National Capital Region (Ontario): 43,590 [increase of 2,115]
- National Capital Region: 62,515 [increase of 3,018 women]
- Ontario (without the National Capital Region): 15,803 [increase of 310]
- Manitoba: 4,401 [increase of 110]
- Saskatchewan: 3,087 [increase of 2]
- Alberta: 6,797 [increase of 212]
- British Columbia: 9,825 [increase of 144]
- Yukon: 211 [decrease of 8]
- Northwest Territories: 264 [decrease of 15]
- Nunavut: 168 [decrease of 1]
- Outside Canada: 722 [increase of 94]
- Not available: 1,271 [increase of 192]
Occupational groups with highest proportion of women (100 and more employees)
Note: Includes classifications with 100 or more employees in the given employment equity group
Highest proportion of women
- HM: Human Resources Management: 81.7% [increase of 0.7 percentage points]
- SH: Health Services: 80.9% [increase of 0.1 percentage points]
- TR: Translation: 76.6% [increase of 0.2 percentage points]
- PA: Program and Administrative Services: 72.6% [decrease of 0.1 percentage points]
- PO: Police Operations Support: 72.3% [decrease of 1.8 percentage points]
Lowest proportion of women
- CX: Correctional Services: 28.2% [0.0 percentage points]
- NR: Architecture, Engineering and Land Survey: 25.1% [increase of 0.1 percentage points]
- IT: Information Technology: 22.7% [decrease of 0.2 percentage points]
- SV: Operational Services: 21.3% [0.0 percentage points]
- SO: Ships’ Officers: 14.1% [increase of 2.6 percentage points]
Observations
In 2021–22, women in executive positions had a share of hires (56.6%) and promotions (58.1%) that exceeded their WFA (48.2%). There was a slight increase in the share of separations for women employees in general of 0.4 percentage points compared with the previous year and a 3.1 percentage point decrease in the share of separations in the executive group.
Data on compensation shows that, overall, women earned less salary compared with the whole of the core public administration and are under-represented in the salary ranges of $75,000 or more. There were 132,299 women in the core public administration, an increase of 5,256 compared with the previous year, with the largest concentration of women being in the Human Resources Management (HM) occupational group (81.7%) and the Health Services (SH) group (80.9%). The lowest concentration was in the Ships’ Officers (SO) group (14.1%). However, considering the bottom five occupational groups, the SO group had the largest increase of representation (2.6 percentage points) compared with the previous year. For occupational groups that had a population of women that numbered more than 100, the Law Management (LC) group had the largest percentage increase (from 209 to 238 employees).
Of the 56% of all employees who are women:
- 5.8% were Indigenous women
- 6.3% were women with a disability
- 20.6% were visible minorities
Initiatives to support women
Equal pay for work of equal value: the Treasury Board of Canada Secretariat
The Government of Canada is committed to creating an inclusive public service where women receive equal pay for work of equal value. Amendments to the Pay Equity Act were adopted and came into effect on August 31, 2021. The Act introduces a new proactive pay equity regime for federally regulated workplaces that have 10 or more employees. Such workplaces include:
- federally regulated private and public sectors, including the federal public service
- parliamentary workplaces
- the prime minister’s office and ministers’ offices
Under this regime, employers must proactively examine their compensation practices to ensure that they are providing equal pay to men and women doing work of equal value.
For additional information on the new pay equity regime, see the Government of Canada’s Equal pay for work of equal value web page.
Indigenous peoples
Infographic 3: Indigenous peoples working in the core public administration (2021–22)
The core public administration population number for employment equity purposes includes indeterminate, term employees of three months or more, and seasonal employees of organizations listed in Schedules I and IV of the Financial Administration Act. Employees on leave without pay, term employees less than three months, students and casual workers, Governor in Council appointees, Ministers’ exempt staff, federal judges, and deputy ministers are excluded.
Internal representation is based on those who have voluntarily chosen to self-identify and self-declare to date as an Indigenous person, a person with a disability and/or a person in a visible minority group, while sex information is taken from the pay system.
Workforce availability (WFA) is calculated based on the 2016 Census and the 2017 Canadian Survey on Disability.
Figures in square brackets represent the change since 2020–21.
Infographic 3 - Text version
Note: Figures in square brackets represent the change since 2020–21.
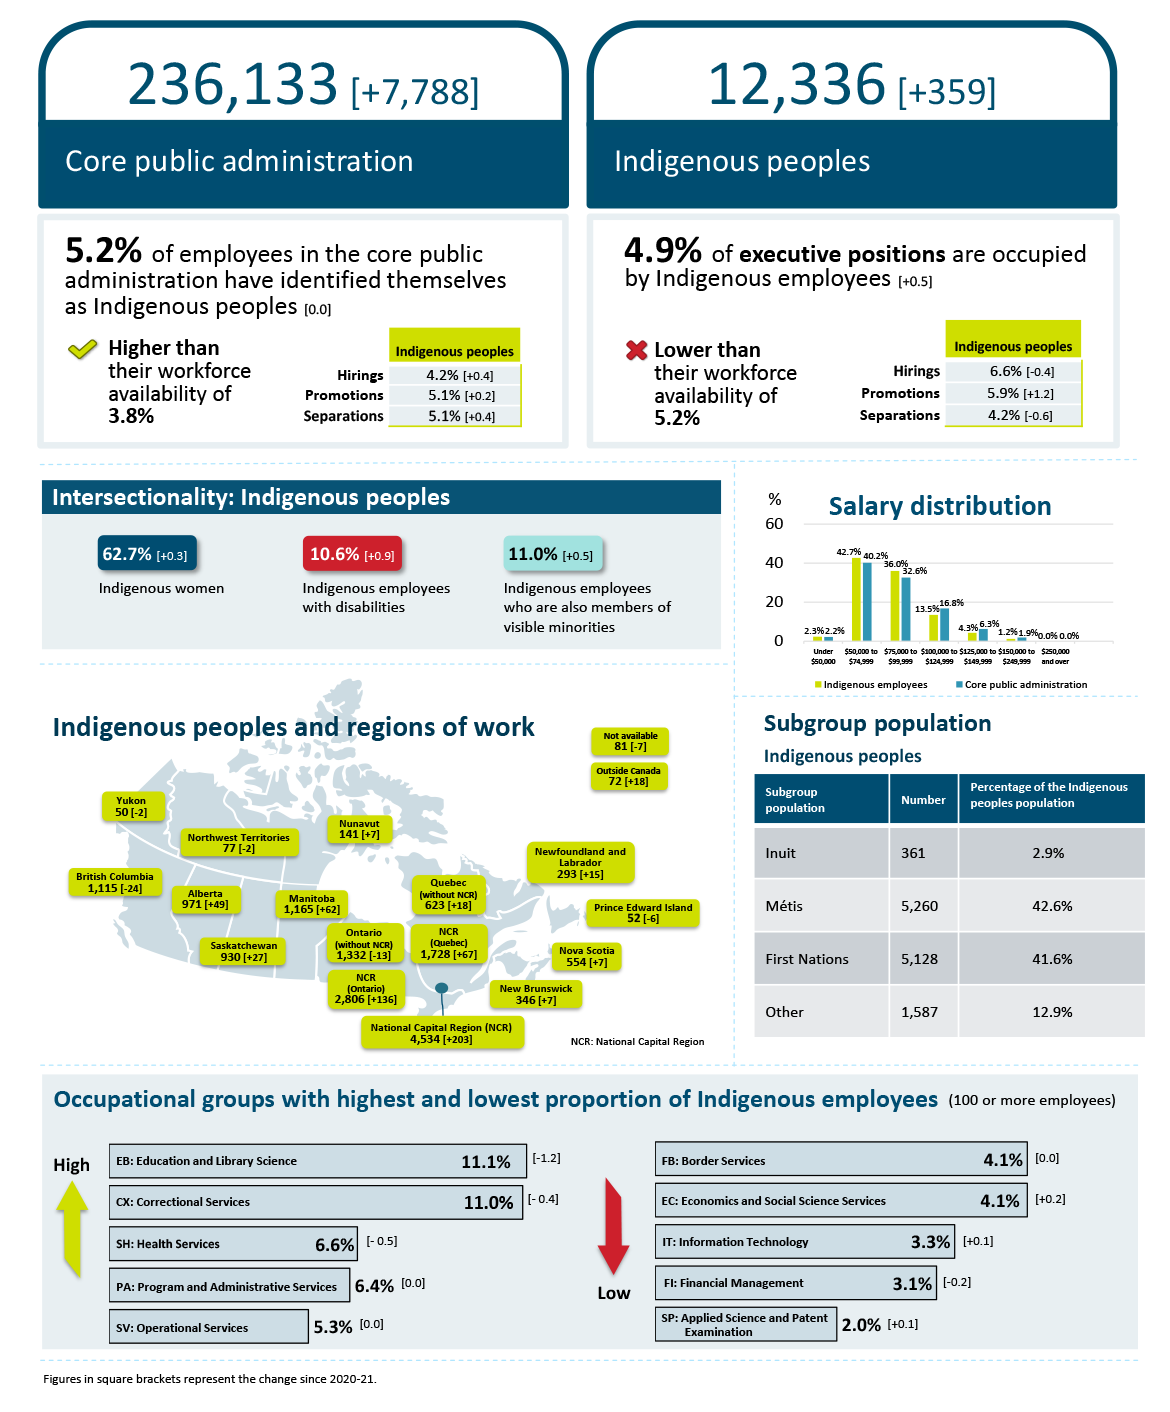
Core public administration population: 236,133 [increase of 7,788]
Indigenous peoples representation in numbers: 12,336 [increase of 359]
5.2% of employees in the core public administration have identified themselves as Indigenous peoples, unchanged from last year’s report and higher than their workforce availability of 3.8%.
Degree of representation for hirings, promotions and separations
| Action type | Degree of representation |
|---|---|
| Hirings | 4.2% [increase of 0.4 percentage points] |
| Promotions | 5.1% [increase of 0.2 percentage points] |
| Separations | 5.1% [increase of 0.4 percentage points] |
4.9% of executive positions are occupied by Indigenous peoples, an increase of 0.5 percentage points from last year’s report and lower than their workforce availability of 5.2%.
| Action type | Degree of representation |
|---|---|
| Hirings | 6.6% [decrease of 0.4 percentage points] |
| Promotions | 5.9% [increase of 1.2 percentage points] |
| Separations | 4.2% [decrease of 0.6 percentage points] |
Salary distribution
| Salary range | Indigenous peoples | Core public administration |
|---|---|---|
| Under $50,000 | 2.3% | 2.2% |
| $50,000 to $74,999 | 42.7% | 40.2% |
| $75,000 to $99,999 | 36.0% | 32.6% |
| $100,000 to $124,999 | 13.5% | 16.8% |
| $125,000 to $149,000 | 4.3% | 6.3% |
| $150,000 to $249,999 | 1.2% | 1.9% |
| $250,000 and over | 0.0% | 0.0% |
Subgroup population for Indigenous peoples
| Subgroup population | Number | % of the Indigenous peoples population |
|---|---|---|
| Inuit | 361 | 2.9% |
| Métis | 5,260 | 42.6% |
| First Nations | 5,128 | 41.6% |
| Other | 1,587 | 12.9% |
Intersectionality analysis for Indigenous peoples
Of the 5.2% of employees who identified themselves as Indigenous peoples:
- 62.7% are women, an increase of 0.3 percentage points from last year
- 10.6% have identified themselves as employees with disabilities, an increase of 0.9 percentage points from last year
- 11.0% have identified themselves as a member of visible minorities, an increase of 0.5 percentage points from last year
Indigenous peoples and region of work
- Newfoundland and Labrador: 293 [increase of 15]
- Prince Edward Island: 52 [decrease of 6]
- Nova Scotia: 554 [increase of 7]
- New Brunswick: 346 [increase of 7]
- Quebec (without the National Capital Region): 623 [increase of 18]
- National Capital Region (Quebec): 1,728 [increase of 67]
- National Capital Region (Ontario): 2,806 [increase of 136]
- National Capital Region: 4,534 [increase of 203]
- Ontario (without the National Capital Region): 1,332 [decrease of 13]
- Manitoba: 1,165 [increase of 62]
- Saskatchewan: 930 [increase of 27]
- Alberta: 971 [increase of 49]
- British Columbia: 1,115 [decrease of 24]
- Yukon: 50 [decrease of 2]
- Northwest Territories: 77 [decrease of 2]
- Nunavut: 141 [increase of 7]
- Outside Canada: 72 [increase of 18]
- Not available: 81 [decrease of 7]
Occupational groups with highest and lowest proportion of Indigenous peoples (100 and more employees)
Note: Includes classifications with 100 or more employees in the given employment equity group
Highest proportion of Indigenous peoples
- EB: Education and Library Science: 11.1% [decrease of 1.2 percentage points]
- CX: Correctional Service: 11.0% [decrease of 0.4 percentage points]
- SH: Health Services: 6.6% [decrease of 0.5 percentage points]
- PA: Program and Administrative Services: 6.4% [0.0 percentage points]
- SV: Operational Services: 5.3% [0.0 percentage points]
Lowest proportion of Indigenous peoples
- FB: Border Services: 4.1% [0.0 percentage points]
- EC: Economics and Social Science Services: 4.1% [increase of 0.2 percentage points]
- IT: Information Technology: 3.3% [increase of 0.1 percentage points]
- FI: Financial Management: 3.1% [decrease of 0.2 percentage points]
- SP: Applied Science and Patent Examination: 2.0% [increase of 0.1 percentage points]
Observations
In 2021–22, the representation of Indigenous employees at 5.2% was higher than its WFA rate at 3.8%. With a representation rate of 4.9% in executive positions, Indigenous employees remained under-represented compared with their WFA of 5.2%. The share of hires (6.6%) and promotions (5.9%) in executive positions were above this group’s WFA, and separations (4.2%) were below the WFA of 5.2%. Overall, the share of hires (4.2%) and promotions (5.1%) of Indigenous employees were both above WFA (3.8%).
The National Capital Region had the largest increase of 203 Indigenous employees, contrasted with British Columbia, where there was a decrease of 24.
Most Indigenous employees were First Nations or Métis, at 41.6% and 42.6%, respectively, of the Indigenous peoples’ population. Inuit employees represented 2.9% of the Indigenous peoples’ population; 12.9% were in the “other” category.
Salaries of Indigenous employees vary in comparison with employees in general. The proportion of Indigenous employees was over-represented in the $50,000 to $74,999 salary range and in the $75,000 to $99,999 salary range. Indigenous peoples remained under-represented in the salary range of $100,000 or more.
Initiatives to support Indigenous peoples
“A place for us too”: Indigenous IT recruitment in the Government of Canada – Employment and Social Development Canada
The IT Apprenticeship Program for Indigenous Peoples, led by the Office of Indigenous Initiatives of Employment and Social Development Canada, is a Government of Canada initiative for First Nations, Inuit and Métis peoples. It is a pathway to employment in the federal public service for Indigenous peoples who are interested in information technology (IT).
By focusing on a person’s potential instead of their educational attainment, the program removes one of the biggest barriers to employment in the digital economy. The program was developed by, with and for Indigenous peoples from across Canada. It incorporates the preferences and needs of Indigenous learners while recognizing the importance of community.
Indigenous apprentices are hired at the entry level of the IT group (IT-01 or equivalent) for a 24-month term, during which they gain on-the-job work experience and receive formal training and mentorship. At the end of the program, successful apprentices receive a recognized digital certificate. In 2021–22, the program received more than 100 applications from Indigenous peoples across Canada, and 25 Indigenous IT apprentices were hired. By September 1, 2022, the numbers had grown to 200 applications and 45 Indigenous IT apprentices hired. The program has a goal of 75 Indigenous IT apprentices hired in 2022–23 and 150 Indigenous IT apprentices hired in 2023–24.
Knowledge Circle for Indigenous Inclusion: Canadian Heritage
To support departments with implementing the Many Voices One Mind: A Pathway to Reconciliation action plan, the Knowledge Circle for Indigenous Inclusion (Knowledge Circle) was launched in 2018. The Knowledge Circle acts as a focal point and a source of expertise that:
- supports Canadian Heritage’s Deputy Minister Champion of Indigenous employees to create transformational change for Indigenous inclusion
- provides support and guidance to Indigenous employees and public service executives and managers
- provides safe spaces for conversations about well-being in the workplace
In 2021–22, Canadian Heritage’s Deputy Minister Champion provided the following:
- oversight of tracking, monitoring and reporting on implementing the action plan
- support for the Clerk’s Call to Action by measuring the department’s progress and driving improvements in employees’ workplace experience
The 2019–20 Departmental Progress Scorecard Summary Report was published in October 2021. It shows some progress in hiring of Indigenous peoples, but it also shows that Indigenous peoples continue to face multiple barriers to employment, career development and advancement opportunities. The 2021–22 scorecard’s statistical analysis indicates:
- inconsistencies in departmental recruitment and retention practices
- a need to strengthen cultural competency
- a need for enhanced efforts in addressing data gaps when tracking Indigenous inclusion
The Knowledge Circle launched the following new initiatives in July 2021:
- the Career Roadmap and Learning Chart for Indigenous employees, which was integrated with OCHRO’s Career Pathways for Indigenous Employees web portal and CSPS courses
- the Indigenous Speakers and Ambassadors Circle in collaboration with OCHRO’s Federal Speakers’ Forum on Diversity and Inclusion
- 27 wellness Talking and Sharing Circles that had a total of 350 participants, with guidance to support access to safe spaces grounded in culturally relevant and respectful guiding principles; these gatherings were particularly timely following the tragic revelation of unmarked graves of Indigenous children that had attended Indian residential schools
The Knowledge Circle also worked with a variety of Indigenous departmental collaborators on other initiatives for Indigenous inclusion, including:
- the Indigenous Wellness Strategy to provide wellness resources to:
- promote Indigenous mental health and well-being
- complement existing human resources programs, departmental Indigenous lodges programming, Elders services and the Employee Assistance Program
- the Executive Coaching and Counselling Circle
- the Indigenous Career Navigators Circle to support First Nation, Inuit and Métis employees’ career progression, the Career Navigators recruitment poster, and hiring managers who seek Indigenous candidates
- training of 15 Indigenous employees as facilitators for the Talking and Sharing Circles
- a National Advisory Circle of Elders and Knowledge Keepers to provide culturally competent guidance and safe spaces for conversations about policies and programs that aim to enhance Indigenous inclusion
Joint Report on the Use of Indigenous Languages: Public Service Alliance of Canada and the Treasury Board of Canada Secretariat
The Public Service Alliance of Canada and TBS are finalizing a Joint Report on the Use of Indigenous Languages in the federal public service that stems from memorandums of understanding in the collective agreements for the PAFootnote 7 and EBFootnote 8 groups and Parks Canada employees to:
- review the use of Indigenous languages in the public service
- examine Indigenous language skills in the performance of employees’ duties
- consider the advantages that Indigenous language speakers bring to the public service
The report will present the results of this first inquiry into the use of Indigenous languages in the federal public service. Information was gathered using two questionnaires, one for organizations and another for teams. Data was collected between October 21, 2021, and January 10, 2022. Twenty-five organizations were selected to participate based on their mandates, their interaction with Indigenous communities, or their impact on Indigenous communities.
Indigenous learning: Canada School of Public Service
In 2021–22, CSPS offered various learning products in its “Indigenous Learning” series, including seven self-paced courses and five instructor-led courses in virtual classrooms, on the history, cultures and perspectives of First Nations, Inuit and Métis in Canada. Course registration increased from 73,270 in 2020–21 to 93,895 in 2021–22.
CSPS Indigenous Learning events partnered with Elders, Knowledge Keepers, and Indigenous and non-Indigenous experts to hold 12 events for more than 54,000 participants on a number of topics, including:
- reconciliation
- cultural safety
- Canadian policies toward Indigenous peoples and their impact
- lived experience of First Nations, Inuit and Métis peoples
For example, CSPS’s Indigenous Learning team partnered with the Prairie Federal Council to offer a high-profile event to mark the first National Day for Truth and Reconciliation, which attracted over 16,000 participants from across the federal public service. The Indigenous Learning team also partnered with the BC Federal Council to host an event to deepen knowledge of the legacy of residential schools and reconciliation.
Indigenous Student Employment Opportunity: Public Service Commission of Canada
The Indigenous Student Employment Opportunity (ISEO) supports Federal Student Work Experience Program (FSWEP) participants who self-declare as Indigenous by providing:
- support services such as mentorship and coaching
- tools and guidance to managers to help provide a culturally appropriate workplace experience for Indigenous students
In 2021–22, 230 students registered for ISEO activities, which included onboarding, training and mentoring events with Indigenous federal employees from diverse backgrounds. In addition, the PSC implemented a new marketing and outreach campaign, which resulted in a significant increase of FSWEP applicants who self-declared as Indigenous. The Government of Canada’s Indigenous Centre of Expertise will continue to work with its partners to promote the ISEO with outreach and advertising.
Indigenous Career Pathways: Public Service Commission of Canada
Indigenous Career Pathways (accessible only on the Government of Canada network) facilitates matching between hiring managers and Indigenous candidates who have participated in the ISEO. Candidates build a profile that outlines their field of study, preferred work locations, spoken and written languages, and competencies, and managers review and choose suitable candidates for potential employment opportunities. Indigenous Career Pathways offers continuous intake; as of March 31, 2022, there were 16 Indigenous graduates and 12 Indigenous employees prequalified in departmental pools. In 2021–22, efforts to promote Indigenous Career Pathways as a tool for hiring managers resulted in over 200 referral requests from hiring managers. In 2022–23, the PSC will:
- conduct additional outreach, advertising and marketing to promote employment opportunities for Indigenous peoples
- continue to support departments in hiring Indigenous peoples through its inventories
- continue to promote its Indigenous Recruitment Toolbox (accessible only on the Government of Canada network), which provides resources to equip managers to hire Indigenous peoples and increase human resources professionals’ knowledge of how to provide guidance
Persons with disabilities
Infographic 4: persons with disabilities working in the core public administration (2021–22)
The core public administration population number for employment equity purposes includes indeterminate, term employees of three months or more, and seasonal employees of organizations listed in Schedules I and IV of the Financial Administration Act. Employees on leave without pay, term employees less than three months, students and casual workers, Governor in Council appointees, Ministers’ exempt staff, federal judges, and deputy ministers are excluded.
Internal representation is based on those who have voluntarily chosen to self-identify and self-declare to date as an Indigenous person, a person with a disability and/or a person in a visible minority group, while sex information is taken from the pay system.
Workforce availability (WFA) is calculated based on the 2016 Census and the 2017 Canadian Survey on Disability.
Figures in square brackets represent the change since 2020–21.
Infographic 4 - Text version
Note: Figures in square brackets represent the change since 2020–21.
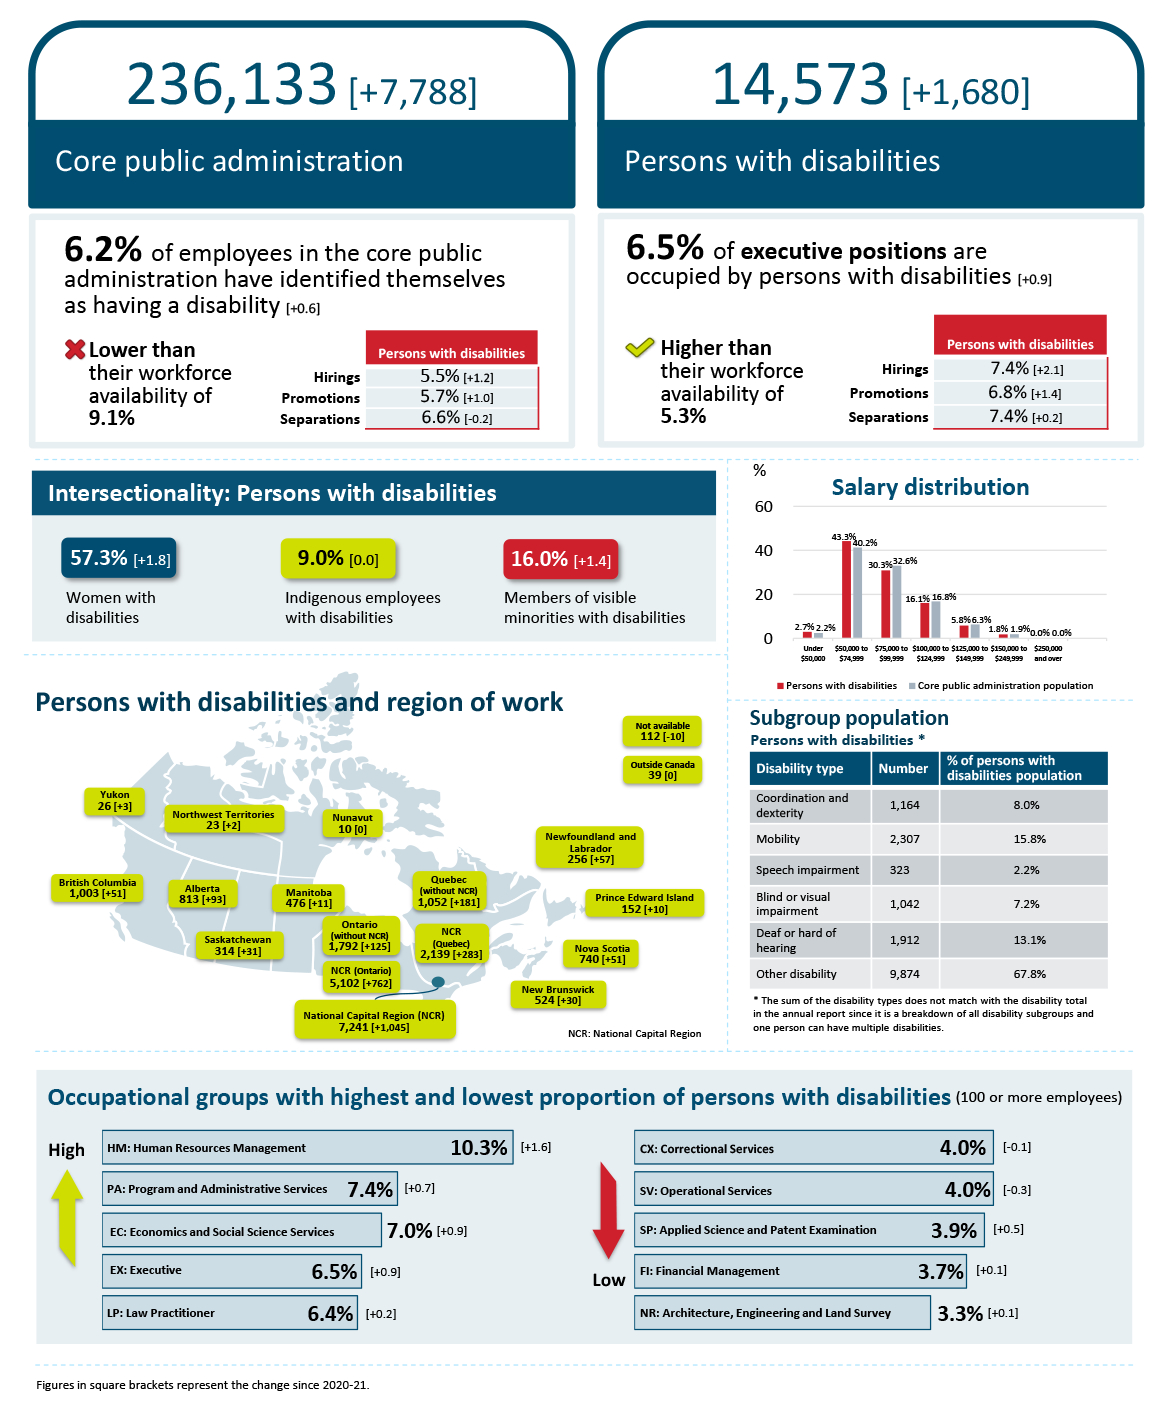
Core public administration population: 236,133 [increase of 7,788]
Persons with disabilities representation in numbers: 14,573 [increase of 1,680]
6.2% of employees in the core public administration have identified themselves as having a disability, an increase of 0.6 percentage points from last year’s report and lower than their workforce availability of 9.1%.
Degree of representation for hirings, promotions and separations
| Action type | Degree of representation |
|---|---|
| Hirings | 5.5% [increase of 1.2 percentage points] |
| Promotions | 5.7% [increase of 1.0 percentage points] |
| Separations | 6.6% [decrease of 0.2 percentage points] |
6.5% of executive positions are occupied by persons with disabilities, an increase of 0.9 percentage points from last year’s report and higher than their workforce availability of 5.3%.
| Action type | Degree of representation |
|---|---|
| Hirings | 7.4% [increase of 2.1 percentage points] |
| Promotions | 6.8% [increase of 1.4 percentage points] |
| Separations | 7.4% [increase of 0.2 percentage points] |
Salary distribution
| Salary range | Persons with disabilities | Core public administration |
|---|---|---|
| Under $50,000 | 2.7% | 2.2% |
| $50,000 to $74,999 | 43.3% | 40.2% |
| $75,000 to $99,999 | 30.3% | 32.6% |
| $100,000 to $124,999 | 16.1% | 16.8% |
| $125,000 to $149,000 | 5.8% | 6.3% |
| $150,000 to $249,999 | 1.8% | 1.9% |
| $250,000 and over | 0.0% | 0.0% |
Subgroup population for persons with disabilities
| Disability type | Number | % of persons with disabilities population |
|---|---|---|
Coordination and dexterity |
1,164 | 8.0% |
Mobility |
2,307 | 15.8% |
Speech impairment |
323 | 2.2% |
Blind or visual impairment |
1,042 | 7.2% |
Deaf or hard of hearing |
1,912 | 13.1% |
Other disability |
9,874 | 67.8% |
Note: The sum of the disability types does not match with the disability total in the annual report since it is a breakdown of all disability subgroups and one person can have multiple disabilities.
Intersectionality analysis for persons with disabilities
Of the 6.2% of employees who identified themselves as having disabilities:
- 57.3% are women, an increase of 1.8 percentage points from last year
- 9.0% have identified themselves as Indigenous peoples, unchanged from last year
- 16.0% have identified themselves as a member of visible minorities, an increase of 1.4 percentage points from last year
Persons with disabilities and region of work
- Newfoundland and Labrador: 256 [increase of 57]
- Prince Edward Island: 152 [increase of 10]
- Nova Scotia: 740 [increase of 51]
- New Brunswick: 524 [increase 30]
- Quebec (without the National Capital Region): 1,052 [increase of 181]
- National Capital Region (Quebec): 2,139 [increase of 283]
- National Capital Region (Ontario): 5,102 [increase of 762]
- National Capital Region: 7,241 [increase of 1,045]
- Ontario (without the National Capital Region): 1,792 [increase of 125]
- Manitoba: 476 [increase of 11]
- Saskatchewan: 314 [increase of 31]
- Alberta: 813 [increase of 93]
- British Columbia: 1,003 [increase of 51]
- Yukon: 26 [increase of 3]
- Northwest Territories: 23 [increase of 2]
- Nunavut: 10 [0]
- Outside Canada: 39 [0]
- Not available: 112 [decrease of 10]
Occupational groups with highest and lowest proportion of persons with disabilities (100 and more employees)
Highest proportion of persons with disabilities
- HM: Human Resources Management: 10.3% [increase of 1.6 percentage points]
- PA: Program and Administrative Services: 7.4% [increase of 0.7 percentage points]
- EC: Economics and Social Science Services: 7.0% [increase of 0.9 percentage points]
- EX: Executive: 6.5% [increase of 0.9 percentage points]
- LP: Law Practitioner: 6.4% [increase of 0.2 percentage points]
Lowest proportion of persons with disabilities
- CX: Correctional Services: 4.0% [decrease of 0.1 percentage points]
- SV: Operational Services: 4.0% [decrease of 0.3 percentage points]
- SP: Applied Science and Patent Examination: 3.9% [increase of 0.5 percentage points]
- FI: Financial Management: 3.7% [increase of 0.1 percentage points]
- NR: Architecture, Engineering and Land Survey: 3.3% [increase of 0.1 percentage points]
Observations
In 2021–22, the representation of employees in the core public administration who identified as having a disability increased 0.6 percentage points from the previous year to 6.2%. With this group’s WFA of 9.1%, there continues to be a significant gap.
The share of hirings for all employees with disabilities, at 5.5%, shows an increase of 1.2 percentage points compared with 2020–21; however, this increase has not been sufficient to close the availability gap. The percentage of separations for this group, at 6.6%, is lower than in 2020–21 by 0.2 percentage points, and the number of separations (1,097) is lower than the number of hirings (1,601).
The representation of executive employees with disabilities, at 6.5%, is higher than this group’s WFA (5.3%). The share of hirings for this group (7.4%) for executive positions is at par with separations (7.4%). Compared with 2020–21, there was an increase of 2.1 percentage points for hirings and 1.4 percentage points for promotions, which is a positive sign.
The highest concentration of employees with a disability is found in the “other disability” category (67.8%). Mobility (15.8%) and deaf or hard of hearing (13.1%) are the other two most prevalent disability types.
Among the 6.2% of employees who identified as having a disability, 57.3% were women, 9.0% were Indigenous peoples and 16.0% were members of visible minorities.
Compared with the core public administration, the proportion of employees with disabilities is over-represented in the $50,000 to $74,999 salary range and under-represented in all salary ranges above $75,000.
The highest concentration of person with disabilities is found in the Human Resources Management (HM) group; the lowest concentration is in the Architecture, Engineering and Land Survey (NR) group.
Initiatives for persons with disabilities
Accessibility Strategy: Office of Public Service Accessibility
The Office of Public Service Accessibility undertook the following activities in 2021–22:
- expanded the Accessibility Hub, a centralized online repository where employers can find information and best practices on various accessibility initiatives, including those for employing persons with disabilities and for accessibility of the workplace
- encouraged dialogue and capacity-building for accessibility in the public service by organizing learning events open to all public servants to mark the International Day of Persons with Disabilities and National AccessAbility Week
- worked to improve measurement by collaborating with Statistics Canada to develop a pilot project to create a hub for departments to share data on persons with disabilities hired into the public service
- supported shared leadership across the public service through a multi-level governance structure to drive and sustain the removal of barriers to accessibility
The President of the PSC, TBS’s Deputy Minister of Public Service Accessibility and the Chief Human Resources Officer sent a letter to all deputy heads of federal departments to:
- highlight the representation gap of persons with disabilities in their organizations and the estimated level of recruitment required to close this gap
- provide tools to improve the hiring and retention of persons with disabilities in support of the Government of Canada’s commitment to hire 5,000 persons with disabilities by 2025
Official Languages Centre of Excellence: Office of the Chief Human Resources Officer
The Directive on Official Languages for People Management was reviewed to identify and remove barriers for employees who are not able to meet the linguistic requirements of EX-02 to EX-05 bilingual positions because of language-related disabilities. The amended directive went into effect in September 2021.
Public Service Commission of Canada recruitment initiatives
The Federal Internship Program for Canadians with Disabilities (FIPCD) supports the Government of Canada’s commitment to hire 5,000 new people with disabilities by 2025 through 125 two-year internships over five years (2019–24). The FIPCD contributes to increased diversity through intersectionality given that many interns also self-identify as visible minorities, Indigenous peoples and/or women. In 2021–22, the program worked to identify candidates across Canada in collaboration with 21 employment agencies and the Canadian Association for Supported Employment. Interns and their managers receive support from these agencies throughout their two-year program, which has been instrumental in hiring and integrating interns. Onboarding, integration and development is a collaboration between managers, interns, their supported employment specialist and the program.
- In Cohort 1 (internship from September 2020 to 2022), 20 interns were hired by eight organizations in entry-level positions. Fourteen are now indeterminate employees, and four have had their terms extended.
- In Cohort 2 (internship from August 2021 to 2023), 55 interns were hired by 28 organizations. Four interns have already been hired indeterminately.
- In Cohort 3 (internship from September 2022 to 2024), 14 interns were hired by 12 organizations.
- Cohort 4 will consist of 36 interns to be hired by 20 organizations for entry-level positions in the AS, BI, CR, EC, EG, FB, GT, IS, IT, PM, RE and SP occupational groups.Footnote 9
Internships will take place across Canada in 17 cities (12 of which were new to the program in 2021–22) in British Columbia, Alberta, Ontario, Quebec, and Newfoundland and Labrador.
The Employment Opportunity for Students with Disabilities (accessible only on the Government of Canada network) (EOSD) supports Federal Student Work Experience Program (FSWEP) students who self-declare as having a disability by:
- providing student employees with supports such as mentorship and coaching
- providing tools and guidance to managers to help them provide an inclusive and accessible workplace experience for students with disabilities
In 2021–22, 573 students with disabilities were hired through FSWEP. Of these, 110 registered to participate in EOSD summer activities, which included onboarding, training, a mentorship program and networking events.
The Virtual Door to Talent with Disabilities (accessible only on the Government of Canada network) is an inventory of graduates who have participated in the EOSD. It facilitates hiring of former EOSD students who can be hired through student bridging after graduation. Candidates create a profile that outlines their field of study, preferred work locations, spoken and written languages, and competencies. Hiring managers can review these profiles and choose suitable candidates for potential opportunities.
In 2021–22, the inventory had 71 referral requests from 50 departments. The inventory offers continuous intake and, as of March 31, 2022, included 51 graduates. The PSC will:
- conduct further outreach, advertising and marketing to promote employment opportunities
- continue to support departments in hiring persons with disabilities through its inventories
The Government of Canada’s resources for post-secondary recruitment (PSR) provide recent graduates with access to jobs in the public service. Recruitment campaigns have evolved over the years to adapt to legislative changes, government priorities and the staffing environment. The 2021 PSR campaign included an inventory that had an area of selection for persons with disabilities at the PM-01 level, which yielded 200 qualified candidates with disabilities who are ready for hire. The 2022 PSR campaign was not restricted to any employment equity group and will continue to align programming with lessons learned through various initiatives to ensure a diversified pool of candidates.
To attract the talent of people with disabilities to federal positions, the PSC implemented a new marketing strategy in 2021–22 that used paid advertising and marketing campaigns to promote self-declaration among job seekers with disabilities. The campaign resulted in a 30% increase in applicants from the previous year who self-declared when they applied to government positions. The PSC will also continue to promote its Hiring persons with disabilities: Managers Toolkit (accessible only on the Government of Canada network), which provides resources to help managers hire persons with disabilities and increase human resources professionals’ competence in providing advice and guidance.
A joint Human Resources Council and PSC working group was established following the coming into force of the Accessible Canada Act to develop inventories of persons with disabilities available for hire to federal organizations. This working group has launched three inventories and is creating a fourth:
- Careers in policy and data analysis (EC-01 to EC-05): Advertised from March 31, 2021, to March 31, 2022. As of September 1, 2022, 279 candidates have been added to the pool of partially assessed candidates; 23 candidates have been hired.
- Digital careers (IT-01 to IT-04): Advertised from March 31, 2021, to March 31, 2022, the PSC has referred 773 applicants to the IT functional community. This community works within TBS and is responsible for assessing and referring candidates. As of September 1, 2022, 12 candidates have been added to the list of partially assessed candidates; three candidates have been hired.
- Senior financial analysts (FI-03): Advertised from October 29, 2021, to November 24, 2021, the financial management functional community has completed the assessment of all 85 candidates. As of September 1, 2022, 10 candidates have been added to the pool of fully assessed candidates.
- Career in sciences (BI-02): The PSC is working with seven departments to launch a BI-02 staffing process in late fall 2022. As of September 2022, these departments have developed their recruitment and assessment strategies, and information sessions with interpretation in American Sign Language and subject matter experts are being organized to answer applicants’ questions.
The working group is also exploring the feasibility of establishing an interdepartmental database of previously assessed candidates with disabilities who could be considered for job opportunities across the public service without having to reapply. The PSC will:
- continue to support departments in hiring persons with disabilities through outreach and engagement and through the PSC’s recruitment programs and services
- continue to work with organizations that represent persons with disabilities to promote employment opportunities and the importance of self-declaration
To support federal organizations with guidance on accessible and inclusive assessment, the PSC and 33 ambassadors from 24 departments and agencies met regularly in 2021–22 to discuss cases, issues and best practices. The PSC provides consultations and services on assessment accommodations and inclusive assessment on an ongoing basis.
In July 2021, the PSC communicated the Changes to the Appointment Delegation and Accountability Instrument for deputy heads that took effect on April 1, 2022. The changes are to:
- ensure that a review of systems, policies and practices that are related to appointments takes place where under-representation has been identified
- establish training prerequisites for sub-delegation, which must include training on unconscious bias
- confirm that completion of the CSPS course “Inclusive Hiring Practices for a Diverse Workforce” (H205) is mandatory for employees who have been sub-delegated with staffing responsibilities
To support accessibility in assessing candidates, the PSC developed its Guide on Biases and Barriers in Assessments (accessible only on the Government of Canada network) to remove or mitigate biases and barriers in the assessment process. In addition, the Assessment Accessibility Ambassadors Network will continue to:
- support the human resources community in applying best practices in accessible and inclusive assessment
- support the community in mitigating barriers and biases when assessing candidates
New disability inclusion course and e-learning modules on neurodiversity: Canada School of Public Service
In 2021–22, CSPS:
- produced a video in collaboration with Accessibility, Accommodation and Adaptive Computer Technology program of Shared Services Canada on how to make documents accessible (3,500 unique page views)
- piloted a new course, “Disability Inclusion Course and Identifying Barriers to Accessibility” (INC 115), in collaboration with the Office of Public Service Accessibility
- hosted seven events on accessibility that had a total of 10,544 participants
- continued its work on redesigning the course on workplace accommodation for federal public service employees and worked with the Office of Public Service Accessibility on piloting e‑learning modules on neurodiversity
Members of visible minorities
Infographic 5: members of visible minorities working in the core public administration (2021–22)
The core public administration population number for employment equity purposes includes indeterminate, term employees of three months or more, and seasonal employees of organizations listed in Schedules I and IV of the Financial Administration Act. Employees on leave without pay, term employees less than three months, students and casual workers, Governor in Council appointees, Ministers’ exempt staff, federal judges, and deputy ministers are excluded.
Internal representation is based on those who have voluntarily chosen to self-identify and self-declare to date as an Indigenous person, a person with a disability and/or a person in a visible minority group, while sex information is taken from the pay system.
Workforce availability (WFA) is calculated based on the 2016 Census and the 2017 Canadian Survey on Disability.
Figures in square brackets represent the change since 2020–21.
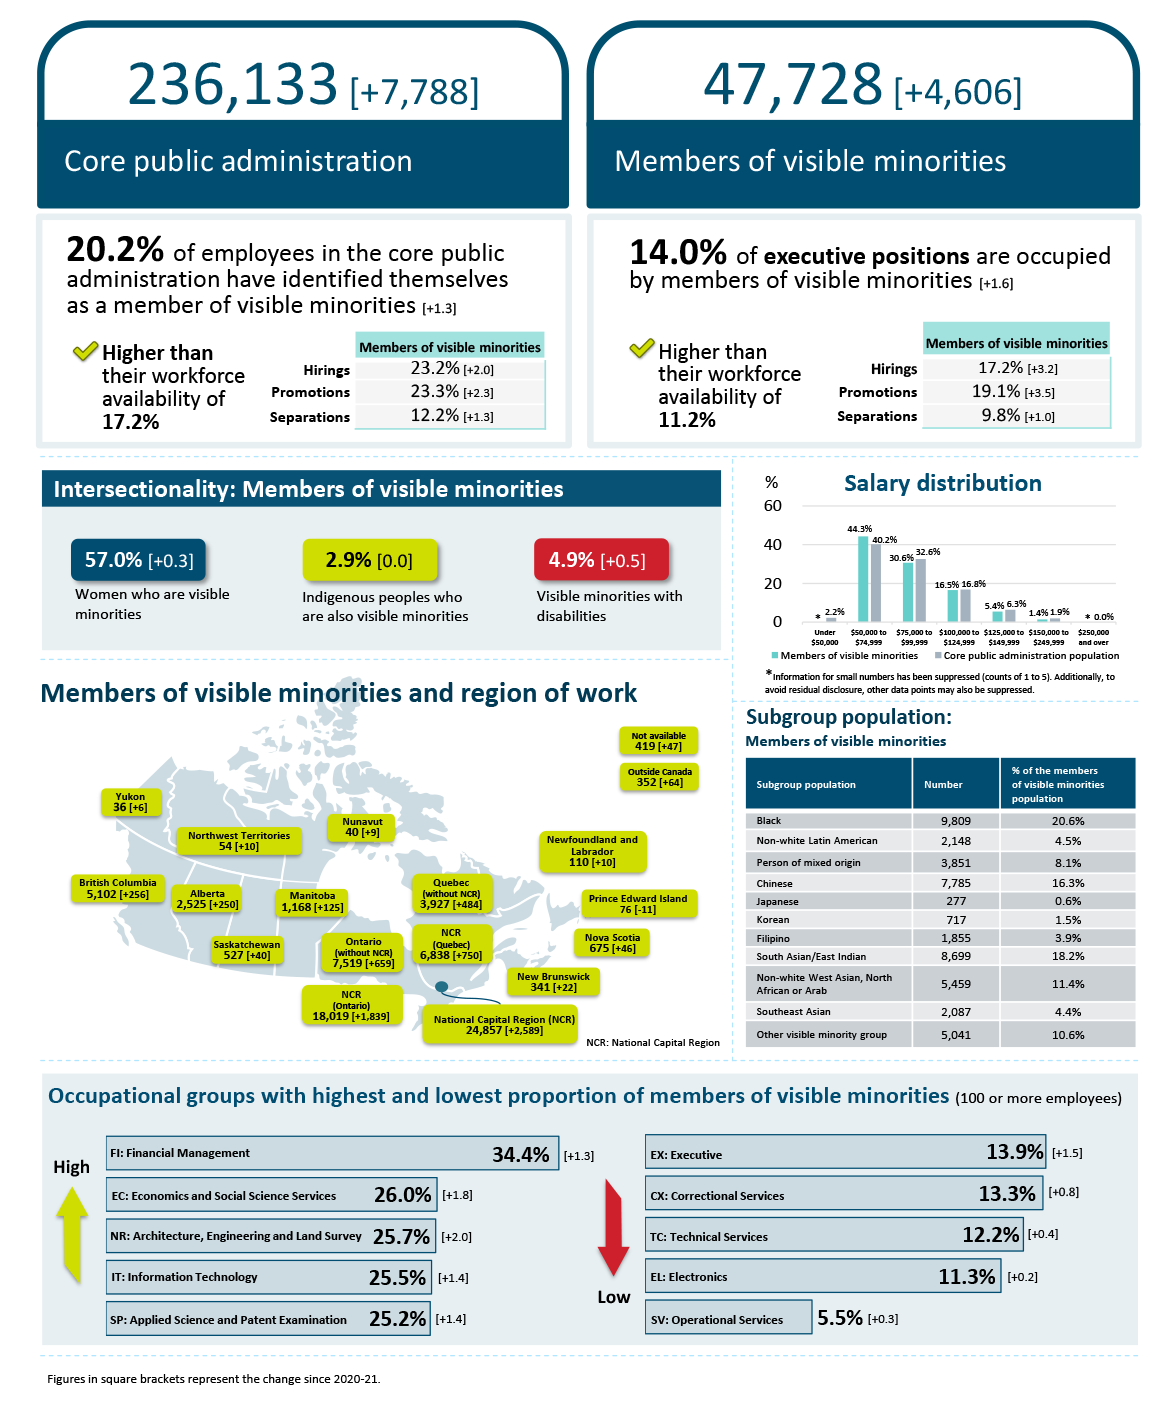
Infographic 5 - Text version
Note: Figures in square brackets represent the change since 2020–21.
Core public administration population: 236,133 [increase of 7,788]
Members of visible minorities representation in numbers: 47,728 [increase of 4,606]
20.2% of employees in the core public administration have identified themselves as members of visible minorities, an increase of 1.3 percentage points from last year’s report and higher than their workforce availability of 17.2%.
Degree of representation for hirings, promotions and separations
| Action type | Degree of representation |
|---|---|
| Hirings | 23.2% [increase of 2.0 percentage points] |
| Promotions | 23.3% [increase of 2.3 percentage points] |
| Separations | 12.2% [increase of 1.3 percentage points] |
14.0% of executive positions are occupied by members of visible minorities, an increase of 1.6 percentage points from last year’s report and higher than their workforce availability of 11.2%.
| Action type | Degree of representation |
|---|---|
| Hirings | 17.2% [increase of 3.2 percentage points] |
| Promotions | 19.1% [increase of 3.5 percentage points] |
| Separations | 9.8% [increase of 1.0 percentage points] |
Salary distribution
| Salary range | Members of visible minorities | Core public administration |
|---|---|---|
| Under $50,000 | Footnote * | 2.2% |
| $50,000 to $74,999 | 44.3% | 40.2% |
| $75,000 to $99,999 | 30.6% | 32.6% |
| $100,000 to $124,999 | 16.5% | 16.8% |
| $125,000 to $149,000 | 5.4% | 6.3% |
| $150,000 to $249,999 | 1.4% | 1.9% |
| $250,000 and over | Footnote * | 0.0% |
Subgroup population for members of visible minorities
| Subgroup population | Number | % of members of visible minorities population |
|---|---|---|
Black |
9,809 | 20.6% |
Non-white Latin American |
2,148 | 4.5% |
Person of mixed origin |
3,851 | 8.1% |
Chinese |
7,785 | 16.3% |
Japanese |
277 | 0.6% |
Korean |
717 | 1.5% |
Filipino |
1,855 | 3.9% |
South Asian / East Indian |
8,699 | 18.2% |
Non-white West Asian, North African or Arab |
5,459 | 11.4% |
Southeast Asian |
2,087 | 4.4% |
Other visible minority group |
5,041 | 10.6% |
Intersectionality analysis for members of visible minorities
Of the 20.2% of employees who identified themselves as a member of visible minorities:
- 57.0% are women, an increase of 0.3 percentage points from last year
- 2.9% have identified themselves as Indigenous peoples, unchanged from last year
- 4.9% have identified themselves as having disabilities, an increase of 0.5 percentage points from last year
Members of visible minorities and region of work
- Newfoundland and Labrador: 110 [increase of 10]
- Prince Edward Island: 76 [decrease of 11]
- Nova Scotia: 675 [increase of 46]
- New Brunswick: 341 [increase of 22]
- Quebec (without the National Capital Region): 3,927 [increase of 484]
- National Capital Region (Quebec): 6,838 [increase of 750]
- National Capital Region (Ontario): 18,019 [increase of 1,839]
- National Capital Region: 24,857 [increase of 2,589]
- Ontario (without the National Capital Region): 7,519 [increase of 659]
- Manitoba: 1,168 [increase of 125]
- Saskatchewan: 527 [increase of 40]
- Alberta: 2,525 [increase of 250]
- British Columbia: 5,102 [increase of 256]
- Yukon: 36 [increase of 6]
- Northwest Territories: 54 [increase of 10]
- Nunavut: 40 [increase of 9]
- Outside Canada: 352 [increase of 64]
- Not available: 419 [increase of 47]
Occupational groups with highest proportion of members of visible minorities (100 and more employees)
Highest proportion of members of visible minorities
- FI: Financial Management: 34.4% [increase of 1.3 percentage points]
- EC: Economics and Social Science Services: 26.0% [increase of 1.8 percentage points]
- NR: Architecture, Engineering and Land Survey: 25.7% [increase of 2.0 percentage points]
- IT: Information Technology: 25.5% [increase of 1.4 percentage points]
- SP: Applied Science and Patent Examination: 25.2% [increase of 1.4 percentage points]
Lowest proportion of members of visible minorities
- EX: Executive: 13.9% [increase of 1.5 percentage points]
- CX: Correctional Services: 13.3% [increase of 0.8 percentage points]
- TC: Technical Services: 12.2% [increase of 0.4 percentage points]
- EL: Electronics: 11.3% [increase of 0.2 percentage points]
- SV: Operational Services: 5.5% [increase of 0.3 percentage points]
Observations
In 2021–22, there was an increase of 4,606 employees who identified as members of visible minorities.
In the same period, the share of hirings for visible minorities as a whole and for executive positions was significantly higher than the share of separations for this group. The representation of employees who occupy an executive position, at 14.0%, is an increase of 1.6 percentage points from the previous fiscal year and is higher than this group’s WFA (11.2%).
When broken down by subgroups, data show that the Black employees (20.6%) and South Asian / East Indians (18.2%) have the highest percentage of the visible minorities’ population.
Compared with the core public administration, the proportion of members of visible minorities continued to be over-represented in the $50,000 to $74,999 salary range and under-represented in all salary ranges above $75,000.
Among the 20.2% of employees of the core public administration who identified as members of visible minorities, more than half (57.0%) are women.
The National Capital Region has seen an increase of 2,589 visible minority employees in 2021–22 compared with the previous fiscal year. Prince Edward Island is the only region of work where the population for this group had a decrease (of 11 employees).
Initiatives in support of visible minorities
Audit on the representation of racialized people in the federal public service: Canadian Human Rights Commission
The Canadian Human Rights Commission launched its Employment Equity Horizontal Audit on the Employment of Racialized People in Management and Executive Positions in the Public Service in July 2020. The commission surveyed 47 departments and agencies that have 500 or more employees on each organization’s employment equity programs and randomly selected a sample of 18 organizations for the full employment equity audit. The commission will issue confidential individual employment equity reports to departments and agencies on its findings. In cases where the organization has not or only partially met the requirements of the Employment Equity Act, the audit report will:
- include a Management Action Plan that will set out what the department or agency must do to comply
- indicate deadlines for compliance
The commission expects to publish a sector-wide report on its findings in fall 2023.
Recruitment strategy: Visible Minorities Champions and Chairs Committee
The vision of the Visible Minorities Champions and Chairs Committee (VMCCC) is to be responsive and relevant to the needs of racialized employees in the federal public service. In 2021–22, the VMCCC worked on revitalizing its membership by developing a recruitment strategy. This revitalization work included:
- developing a new questionnaire for committee members
- reviewing the terms of reference for the VMCCC’s Steering Committee
- developing an engagement strategy to promote the work of the VMCCC
- maintaining a continued focus on increasing membership
The VMCCC’s Steering Committee researched and advocated for adding anti-racism as an additional factor to the 13 factors set out by the National Standard of Canada for Psychological Health and Safety in the Workplace. Anti-racism would fall under the category of any other chronic stressor that may be identified by workers. The Deputy Minister Champion, who chairs the VMCCC, approved this proposal.
The VMCCC’s Steering Committee also hosted a focus group as part of its review of the Employment Equity Act in 2022. This was to ensure that the national committee had a dedicated platform to receive feedback, separate from the broad consultations, as the Act is what informs the committees’ existence.
Federal Internship for Newcomers Program: Immigration, Refugees and Citizenship Canada
Immigration, Refugees and Citizenship Canada (IRCC) has managed the Federal Internship for Newcomers (FIN) Program since 2010. The program provides qualified newcomers to Canada with work experience, training and mentorship to help them overcome the challenges of integrating into federal government workplaces. This year, over 77% of candidates are from racialized backgrounds, and 82% are from all employment equity groups. In 2021–22, the program:
- provided support to more than 1,000 newcomers through IRCC-funded organizations that serve immigrants, including application and interview preparation, on-the-job training, and mentorship:
- this support has helped enhance newcomers’ success in employment outcomes, with:
- 92% of interns who responded to surveys indicating that they found employment within three months of their internship
- 88% of managers indicating that they extended their candidates’ short-term employment
- this support has helped enhance newcomers’ success in employment outcomes, with:
- created candidate pools of over 180 newcomers through a process that removed or mitigated as many biases and barriers in assessments as possible in line with amendments to the Public Service Employment Act:
- these candidate pools led to placements for 94 candidates (79% of available candidates) in over 27 federal government organizations
- helped managers create inclusive workplaces by analyzing their needs, providing support and connecting them with the suitable candidates:
- IRCC developed four tip sheets on cross-cultural communication, virtual work, providing feedback and unconscious bias to support managers as they increase diversity in the workplace; IRCC will develop additional tip sheets on inclusive onboarding and fostering a sense of inclusion and belonging in the workplace
- provided training to hundreds of public servants in more than 20 departments and agencies who participated in the FIN Program’s human resource process and volunteered to mentor FIN candidates:
- training included aspects of screening applications of newcomers and conducting culturally competent interviews; participants also learned about newcomers’ skills, developed leadership and intercultural competencies, and became ambassadors for the FIN Program
In 2022–23, the FIN Program will continue to enhance processes and provide additional opportunities to newcomers.
Black communities
Infographic 6: Black employees working in the core public administration (2021–22)
The core public administration population number for employment equity purposes includes indeterminate, term employees of three months or more, and seasonal employees of organizations listed in Schedules I and IV of the Financial Administration Act. Employees on leave without pay, term employees less than three months, students and casual workers, Governor in Council appointees, Ministers’ exempt staff, federal judges, and deputy ministers are excluded.
Internal representation is based on those who have voluntarily chosen to self-identify and self-declare to date as an Indigenous person, a person with a disability and/or a person in a visible minority group, while sex information is taken from the pay system.
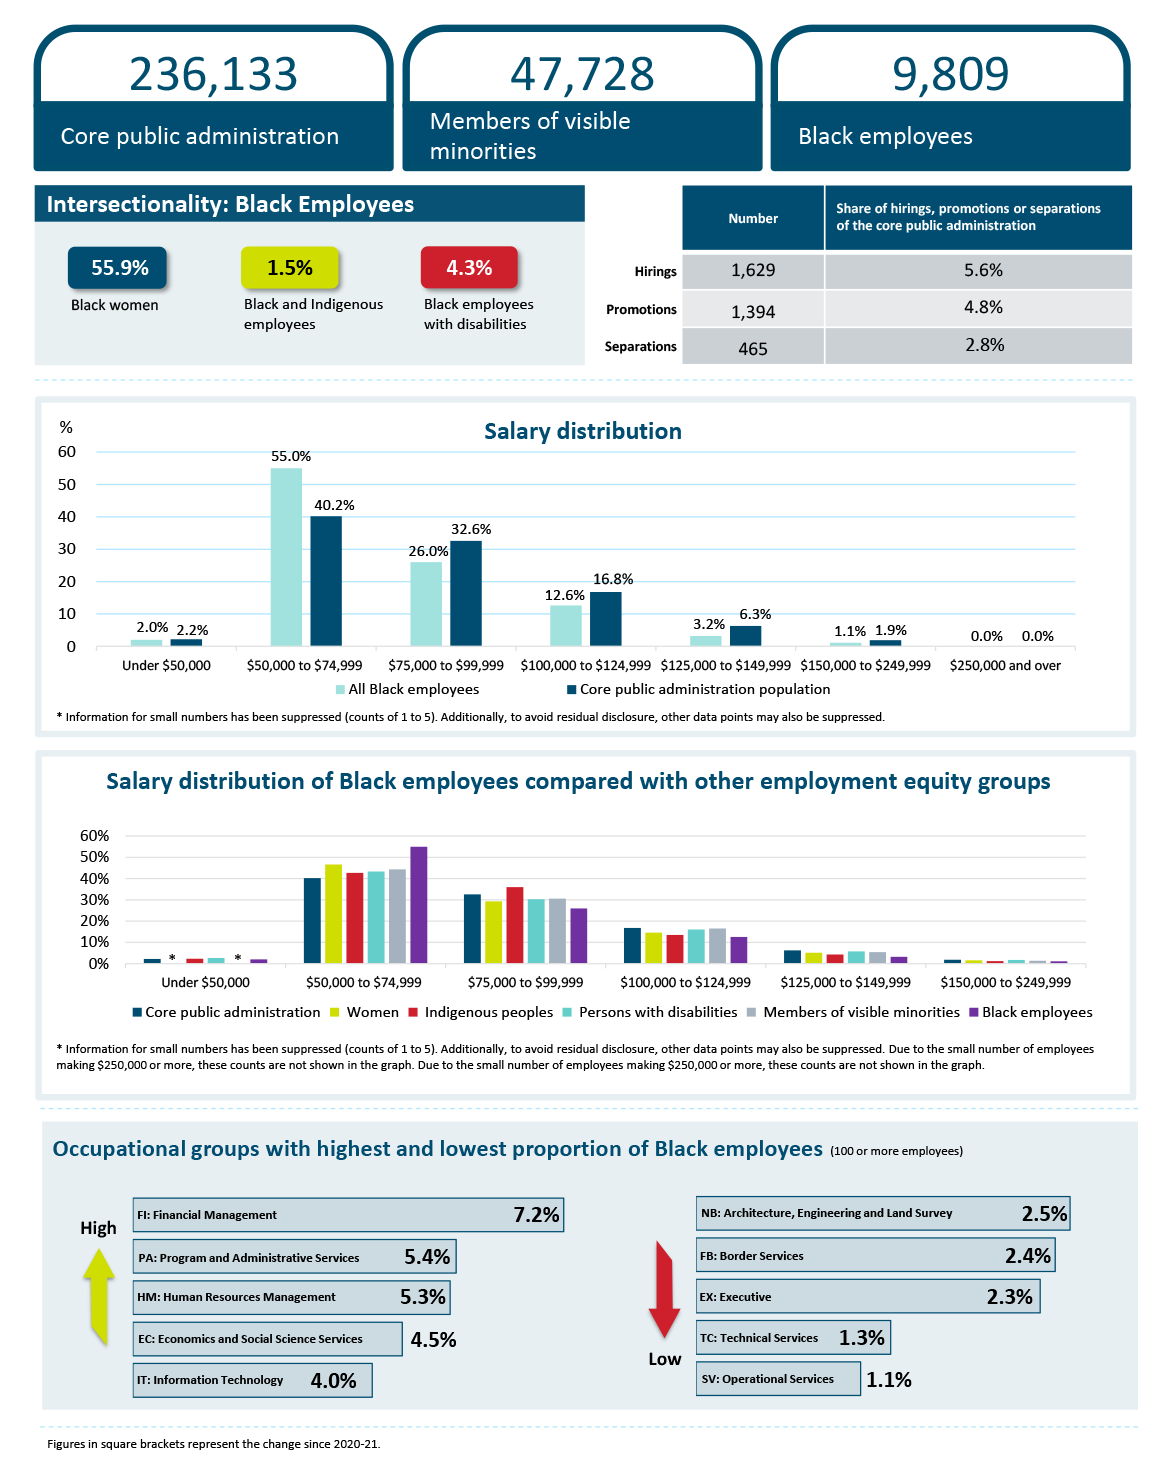
Infographic 6 - Text version
Core public administration population: 236,133
Members of visible minorities representation in numbers: 47,728
Black employees representation in numbers: 9,809
Number and share of representation for hirings, promotions and separations
| Action type | Number | Share of hirings, promotion or separations of the core public administration |
|---|---|---|
| Hirings | 1,629 | 5.6% |
| Promotions | 1,394 | 4.8% |
| Separations | 465 | 2.8% |
Intersectionality analysis for Black employees
Among the 4.2% of employees who identified as a Black person:
- 55.9% are women
- 1.5% have identified themselves as Indigenous peoples
- 4.3% have identified themselves as having disabilities
Salary distribution
| Salary range | Black employees | Core public administration |
|---|---|---|
| Under $50,000 | 2.0% | 2.2% |
| $50,000 to $74,999 | 55.0% | 40.2% |
| $75,000 to $99,999 | 26.0% | 32.6% |
| $100,000 to $124,999 | 12.6% | 16.8% |
| $125,000 to $149,000 | 3.2% | 6.3% |
| $150,000 to $249,999 | 1.1% | 1.9% |
| $250,000 and over | 0.0% | 0.0% |
Salary distribution of Black employees compared to other employment equity groups
| Salary range | Core public administration | Women | Indigenous peoples | Persons with disabilities | Members of visible minorities | Black Employees |
|---|---|---|---|---|---|---|
| Under $50,000 | 2.2% | Footnote * | 2.3% | 2.7% | Footnote * | 2.0% |
| $50,000 to $74,999 | 40.2% | 46.6% | 42.7% | 43.3% | 44.3% | 55.0% |
| $75,000 to $99,999 | 32.6% | 29.3% | 36.0% | 30.3% | 30.6% | 26.0% |
| $100,000 to $124,999 | 16.8% | 14.6% | 13.5% | 16.1% | 16.5% | 12.6% |
| $125,000 to $149,000 | 6.3% | 5.2% | 4.3% | 5.8% | 5.4% | 3.2% |
| $150,000 to $249,999 | 1.9% | 1.6% | 1.2% | 1.8% | 1.4% | 1.1% |
Occupational groups with highest and lowest proportion of Black employees (100 and more employees)
Highest proportion of Black employees
- FI: Financial Management: 7.2%
- PA: Program and Administrative Services: 5.4%
- HM: Human Resources Management: 5.3%
- EC: Economics and Social Science Services: 4.5%
- IT: Information Technology: 4.0%
Lowest proportion of Black employees
- NR: Architecture, Engineering and Land Survey: 2.5%
- FB: Border Services: 2.4%
- EX: Executive: 2.3%
- TC: Technical Services: 1.3%
- SV: Operational Services: 1.1%
Observations
Black employees represent 4.2% of the core public administration and 20.6% of the visible minority population.
In 2021–22, there were 1,629 hirings of Black employees, representing a share of 5.6% of overall hirings in the core public administration. There were 465 separations, representing a share of 2.8%. Among the Black executive group, there were 6 hirings, 41 promotions and 7 separations.
Among the 4.2% of employees of the core public administration who identified as a Black person, more than half (55.9%) are women and 4.3% have a disability.
When compared with the other employment equity groups, the proportion of Black employees is the highest in the $50,000 to $74,999 salary range and lowest in all other salary ranges between $75,000 and $250,000. In the range of salaries below $50,000, the proportion of Black employees is 2.0%, a difference of 0.2 percentage points from the core public administration at 2.2%. The proportion of persons with disabilities (2.7%) is higher than the proportion of Black employees by 0.7 percentage points.
The highest number of Black employees is in the Financial Management (FI) occupational group (7.2%). Black employees occupy 2.3% (168) of executive positions.
Initiatives to support Black employees
Recognizing that Black public servants can face barriers in career advancement and have distinct mental health challenges, the Government of Canada committed $3.7 million in Budget 2022 to support Black employees and create a Black Mental Health Fund and a plan to address barriers to career advancement in the workplace.
In 2021–22, CSPS:
- continued to provide courses on anti-racism and equity topics
- invited Dr. Rachel Zellars as the inaugural scholar of the Jocelyne Bourgon Visiting Scholar Initiative to facilitate learning sessions for public servants, with a focus on executives; 17 sessions were held for central agencies, federal departments, executives and all-employee forums, reaching over 4,800 participants
- in collaboration with the Federal Black Employee Caucus and Canadian Heritage, hosted six events and rebroadcast two events on anti-Black racism, with a total of 18,361 participants
- launched the Anti-Racism Learning Series, which includes resources for managers and other public servants to address systemic racism and discrimination in the workplace
- piloted the virtually facilitated course “Advancing the Conversation on Systemic Racism” (INC 117)
Final word
Overall, three of the four designated employment equity groups in the federal public service exceeded their WFA in 2021–22. However, evidence shows that disparities in salaries persist, even though such disparities were reported to the Government of Canada in the Report of the Commission on Equality in Employment of 1984.
Nevertheless, it is encouraging to see the increase in the number of initiatives to remove barriers, advance diversity and inclusion, and close gaps, particularly for Indigenous peoples, persons with disabilities and Black employees.
Achieving representation goals for greater diversity and, more importantly, cultivating a culture of inclusion, requires a shift in our intention and mindset. TBS and its partners remain committed to ensuring that:
- employment equity considerations are built into policies, programs and recruitment strategies
- education and awareness initiatives provide safe spaces for difficult conversations and instill greater appreciation of the richness that equity-seeking groups bring to the workplace
In 2021, the Government of Canada established the Employment Equity Act Review Task Force to conduct a review of the Employment Equity Act. To date, the task force has:
- comprehensively reviewed the Employment Equity Act and its supporting programs
- engaged with stakeholder organizations, partners and Canadians
- obtained views about employment equity and the promotion of equity, diversity and inclusion in federal workplaces
The task force’s final report to the Minister of Labour will include:
- results of its research and key findings
- advice based on the task force’s own expertise, engagement with session participants and written submissions
- recommendations to modernize and improve the employment equity framework for the federal jurisdiction
It is expected that the task force’s recommendations will cover a range of workplace equity, diversity and inclusion issues. OCHRO looks forward to the renewal of the Employment Equity Act and is committed to continue working with the Labour Program of Employment and Social Development Canada to ensure that its employment equity policy framework and programs align with the renewed legislative framework.
About the data
In this section
Population covered
The statistical tables in this report’s appendix present information as of March 31, 2022, for indeterminate, term employees of three months or more, and seasonal employees of organizations listed in Schedules I and IV of the Financial Administration Act (the core public administration).
Notes on terms and data sources
- The source of representation data is the TBS Employment Equity Data Bank, which contains self-identification and self-declaration information (from the Public Service Resourcing System) provided by employees.
- The sum of designated groups does not equal the total (“all employees”) because employees may have voluntarily chosen to self-identify in more than one designated group, and men are included in the total.
- “Hirings” refers to employees who were added to the public service of Canada payroll between April 1, 2021, and March 31, 2022.
- Data on promotions are obtained from the PSC and include information from departments and agencies that fall under both the Financial Administration Act, Schedules I and IV, and the Public Service Employment Act.
- “Separations” refers to employees who left the public service of Canada payroll between April 1, 2021, and March 31, 2022.
Workforce availability
Workforce availability (WFA) estimates are used as a benchmark to assess the representativeness of employment equity designated groups within the core public administration (organizations listed in Schedule I and IV of the Financial Administration Act) in accordance with the Employment Equity Act. The dynamics of hiring depend on the availability of designated group members for public service employment. The WFA varies geographically (national or by province or territory) or by the specific qualifications that organizations must fill. Four filters are considered:
- citizenship: this filter is applied because the Public Service Employment Act gives preference to the hiring of Canadian citizens (section 39.1.c); this preference was extended to permanent residents as of June 29, 2021
- classification: this filter narrows consideration to occupations that the government deems relevant to the public service
- education: this filter is used for some classifications to include only persons who have an educational degree for scientific and professional occupations, taking into account the public service qualification standards for jobs (educational requirements)
- geography: this filter assumes that most organizational hiring will be done locally for most occupational groups rather than from wider geographic areas
WFA estimates are derived from the Labour Market Availability, which is derived from the 2016 CensusFootnote 10 and the Canadian Survey on Disability, which is performed every five years. Changes to the Public Service Employment Act came into effect in June 2021, including broadening the preference given to Canadian citizens in external advertised appointment processes to include permanent residents. As a result, as of March 2022, WFA includes Canadian citizens and permanent residents active in the labour market who are at least 15 years of age and is based on occupations in the Canadian workforce corresponding to the occupations in the public service. Prior to March 2022, WFA only included Canadian citizens active in the labour market who were at least 15 years of age and was based on occupations in the Canadian workforce corresponding to the occupations in the public service.
Note on workforce availability for persons with disabilities and visible minorities
The estimate of the WFA for persons with disabilities increased significantly between the two censuses (as a result of the Canadian Survey on Disability), from 4.4% in 2011 to 9.0% in 2017. The reason is that the 2017 Canadian Survey on Disability expanded the definition of persons with disabilities to include persons with disabilities related to pain and mental health. As this more inclusive definition has not yet been incorporated into the federal public service voluntary reporting exercise, it is impossible to predict the variance when the new definition is reflected in voluntary reporting. Significant work was undertaken on modernizing the self-identification questionnaire in 2021–22.
For visible minorities, it should be noted that the current WFA reflects the potential workforce of permanent residents because of the change made to the Public Service Employment Act (as of June 2021). This change requires that Canadian citizens and permanent residents be given a hiring preference over non-permanent residents for selection processes advertised to the public.
Self-identification
Internal representation for Indigenous peoples, persons with disabilities and members of visible minorities is based on employees who have voluntarily chosen to self-identify or self-declare through a recruitment process in one of the employment equity groups or a part of at least one employment equity group. Information on the sex of employees is taken from the Government of Canada’s pay system.
Appendix: statistical tables of employment equity data specific to compliance requirements of section 21 of the Employment Equity Act
Table 1: distribution of public service of Canada employees by designated group according to department or agency
The following table includes information (as of March 31, 2022) regarding indeterminates, terms of three months or more, and seasonal employees of organizations captured under the Financial Administration Act, Schedules I and IV (core public administration).
| Department or agency | All employees | Women | Indigenous peoples | Persons with disabilities | Members of visible minorities | ||||
|---|---|---|---|---|---|---|---|---|---|
| Overall WFA | 53.3% | 3.8% | 9.1% | 17.2% | |||||
| Number | Number | % | Number | % | Number | % | Number | % | |
| Employment and Social Development Canada | 33,560 | 22,721 | 67.7 | 1,507 | 4.5 | 2,655 | 7.9 | 9,233 | 27.5 |
| National DefenceFootnote † | 25,440 | 10,597 | 41.7 | 863 | 3.4 | 1,381 | 5.4 | 2,752 | 10.8 |
| Correctional Service Canada | 17,431 | 8,718 | 50.0 | 1,871 | 10.7 | 1,135 | 6.5 | 2,196 | 12.6 |
| Public Services and Procurement Canada | 16,338 | 9,777 | 59.8 | 576 | 3.5 | 939 | 5.7 | 3,049 | 18.7 |
| Canada Border Services Agency | 14,362 | 6,779 | 47.2 | 543 | 3.8 | 678 | 4.7 | 2,782 | 19.4 |
| Fisheries and Oceans CanadaFootnote ‡ | 12,872 | 5,525 | 42.9 | 627 | 4.9 | 511 | 4.0 | 973 | 7.6 |
| Health CanadaFootnote § | 9,184 | 5,957 | 64.9 | 240 | 2.6 | 598 | 6.5 | 2,806 | 30.6 |
| Immigration, Refugees and Citizenship Canada | 8,591 | 5,506 | 64.1 | 254 | 3.0 | 464 | 5.4 | 3,028 | 35.2 |
| Royal Canadian Mounted Police (Civilian Staff) | 8,384 | 6,122 | 73.0 | 467 | 5.6 | 357 | 4.3 | 1,428 | 17.0 |
| Shared Services Canada | 7,483 | 2,574 | 34.4 | 267 | 3.6 | 546 | 7.3 | 1,641 | 21.9 |
| Environment and Climate Change Canada | 7,045 | 3,673 | 52.1 | 213 | 3.0 | 476 | 6.8 | 1,412 | 20.0 |
| Indigenous Services Canada | 6,661 | 4,537 | 68.1 | 1,878 | 28.2 | 424 | 6.4 | 1,224 | 18.4 |
| Global Affairs Canada | 6,422 | 3,648 | 56.8 | 443 | 6.9 | 274 | 4.3 | 1,760 | 27.4 |
| Transport Canada | 5,744 | 2,616 | 45.5 | 231 | 4.0 | 252 | 4.4 | 1,100 | 19.2 |
| Statistics Canada | 5,725 | 2,871 | 50.1 | 193 | 3.4 | 478 | 8.3 | 1,645 | 28.7 |
| Innovation, Science and Economic Development Canada | 5,543 | 2,835 | 51.1 | 158 | 2.9 | 322 | 5.8 | 1,410 | 25.4 |
| Agriculture and Agri-Food Canada | 4,953 | 2,603 | 52.6 | 180 | 3.6 | 274 | 5.5 | 962 | 19.4 |
| Department of Justice Canada | 4,929 | 3,360 | 68.2 | 213 | 4.3 | 336 | 6.8 | 1,105 | 22.4 |
| Natural Resources Canada | 4,306 | 2,044 | 47.5 | 141 | 3.3 | 328 | 7.6 | 843 | 19.6 |
| Public Health Agency of Canada | 3,683 | 2,502 | 67.9 | 124 | 3.4 | 219 | 5.9 | 1,041 | 28.3 |
| Veterans Affairs Canada | 3,439 | 2,512 | 73.0 | 144 | 4.2 | 260 | 7.6 | 334 | 9.7 |
| Treasury Board of Canada Secretariat | 2,214 | 1,346 | 60.8 | 73 | 3.3 | 177 | 8.0 | 522 | 23.6 |
| Crown-Indigenous Relations and Northern Affairs CanadaFootnote § | 1,905 | 1,263 | 66.3 | 333 | 17.5 | 122 | 6.4 | 327 | 17.2 |
| Canadian Heritage | 1,864 | 1,270 | 68.1 | 91 | 4.9 | 129 | 6.9 | 343 | 18.4 |
| Immigration and Refugee Board of Canada | 1,791 | 1,155 | 64.5 | 43 | 2.4 | 87 | 4.9 | 701 | 39.1 |
| Public Safety Canada | 1,238 | 754 | 60.9 | 58 | 4.7 | 93 | 7.5 | 256 | 20.7 |
| Public Prosecution Service of Canada | 1,093 | 727 | 66.5 | 78 | 7.1 | 69 | 6.3 | 213 | 19.5 |
| Privy Council Office | 1,028 | 569 | 55.4 | 39 | 3.8 | 50 | 4.9 | 213 | 20.7 |
| Elections Canada | 922 | 486 | 52.7 | 21 | 2.3 | 60 | 6.5 | 191 | 20.7 |
| Infrastructure Canada | 894 | 548 | 61.3 | 28 | 3.1 | 70 | 7.8 | 207 | 23.2 |
| Department of Finance Canada | 856 | 400 | 46.7 | 21 | 2.5 | 42 | 4.9 | 173 | 20.2 |
| Public Service Commission of Canada | 838 | 548 | 65.4 | 36 | 4.3 | 130 | 15.5 | 180 | 21.5 |
| Library and Archives Canada | 819 | 517 | 63.1 | 39 | 4.8 | 36 | 4.4 | 75 | 9.2 |
| Courts Administration Service | 711 | 471 | 66.2 | 21 | 3.0 | 40 | 5.6 | 176 | 24.8 |
| Canadian Space Agency | 684 | 311 | 45.5 | 10 | 1.5 | 41 | 6.0 | 131 | 19.2 |
| Canada School of Public Service | 641 | 416 | 64.9 | 26 | 4.1 | 50 | 7.8 | 120 | 18.7 |
| Atlantic Canada Opportunities Agency | 583 | 368 | 63.1 | 24 | 4.1 | 48 | 8.2 | 36 | 6.2 |
| Administrative Tribunals Support Service of Canada | 532 | 345 | 64.8 | 10 | 1.9 | 34 | 6.4 | 96 | 18.0 |
| Canadian Radio-television and Telecommunications Commission | 513 | 281 | 54.8 | 24 | 4.7 | 34 | 6.6 | 105 | 20.5 |
| Canadian Grain Commission | 444 | 217 | 48.9 | 25 | 5.6 | 16 | 3.6 | 126 | 28.4 |
| Western Economic Diversification Canada | 419 | 239 | 57.0 | 31 | 7.4 | 20 | 4.8 | 113 | 27.0 |
| Parole Board of Canada | 406 | 315 | 77.6 | 24 | 5.9 | 25 | 6.2 | 56 | 13.8 |
| lmpact Assessment Agency of CanadaFootnote †† | 401 | 269 | 67.1 | 21 | 5.2 | 30 | 7.5 | 69 | 17.2 |
| Canada Economic Development for Quebec Regions | 351 | 196 | 55.8 | 7 | 2.0 | 23 | 6.6 | 67 | 19.1 |
| Women and Gender Equality Canada | 328 | 276 | 84.1 | 15 | 4.6 | 23 | 7.0 | 67 | 20.4 |
| Offices of the Information and Privacy Commissioners of Canada | 324 | 196 | 60.5 | 14 | 4.3 | 16 | 4.9 | 54 | 16.7 |
| Federal Economic Development Agency for Southern Ontario | 288 | 180 | 62.5 | 10 | 3.5 | 32 | 11.1 | 81 | 28.1 |
| Canadian Transportation Agency | 271 | 152 | 56.1 | 8 | 3.0 | 18 | 6.6 | 50 | 18.5 |
| Canadian Human Rights Commission | 253 | 185 | 73.1 | 9 | 3.6 | 49 | 19.4 | 58 | 22.9 |
| Transportation Safety Board of Canada | 213 | 81 | 38.0 | Footnote * | Footnote * | 9 | 4.2 | 26 | 12.2 |
| Registrar of the Supreme Court of Canada | 202 | 127 | 62.9 | 11 | 5.4 | 17 | 8.4 | 23 | 11.4 |
| Office of the Commissioner of Official Languages | 155 | 97 | 62.6 | Footnote * | Footnote * | 6 | 3.9 | 16 | 10.3 |
| Office of the Governor General’s Secretary | 148 | 91 | 61.5 | Footnote * | Footnote * | 11 | 7.4 | 22 | 14.9 |
| Canadian Northern Economic Development Agency | 110 | 78 | 70.9 | 28 | 25.5 | Footnote * | Footnote * | 27 | 24.5 |
| Civilian Review and Complaints Commission for the RCMP | 75 | 47 | 62.7 | Footnote * | Footnote * | Footnote * | Footnote * | 12 | 16.0 |
| Veterans Review and Appeal Board | 75 | 50 | 66.7 | Footnote * | Footnote * | Footnote * | Footnote * | Footnote * | Footnote * |
| Patented Medicine Prices Review Board Canada | 74 | 37 | 50.0 | Footnote * | Footnote * | 6 | 8.1 | 14 | 18.9 |
| Canadian Dairy Commission | 70 | 38 | 54.3 | Footnote * | Footnote * | Footnote * | Footnote * | 12 | 17.1 |
| Office of the Commissioner for Federal Judicial Affairs Canada | 55 | 40 | 72.7 | Footnote * | Footnote * | Footnote * | Footnote * | Footnote * | Footnote * |
| Military Grievances External Review Committee | 41 | 22 | 53.7 | Footnote * | Footnote * | Footnote * | Footnote * | 7 | 17.1 |
| Accessibility Standards Canada | 37 | 17 | 45.9 | 0 | 0.0 | 12 | 32.4 | 7 | 18.9 |
| Office of the Public Sector Integrity Commissioner of Canada | 29 | 18 | 62.1 | 0 | 0.0 | Footnote * | Footnote * | Footnote * | Footnote * |
| International Joint Commission | 27 | 12 | 44.4 | 0 | 0.0 | Footnote * | Footnote * | Footnote * | Footnote * |
| Office of the Commissioner of Lobbying of Canada | 27 | 14 | 51.9 | 0 | 0.0 | Footnote * | Footnote * | Footnote * | Footnote * |
| Military Police Complaints Commission of Canada | 25 | 15 | 60.0 | Footnote * | Footnote * | Footnote * | Footnote * | 7 | 28.0 |
| Canadian Intergovernmental Conference Secretariat | 23 | 12 | 52.2 | Footnote * | Footnote * | Footnote * | Footnote * | Footnote * | Footnote * |
| RCMP External Review Committee | 21 | 14 | 66.7 | 0 | 0.0 | Footnote * | Footnote * | Footnote * | Footnote * |
| Copyright Board Canada | 15 | Footnote * | Footnote * | 0 | 0.0 | Footnote * | Footnote * | Footnote * | Footnote * |
| Secretariat of the National Security and Intelligence Committee of Parliamentarians | 5 | Footnote * | Footnote * | 0 | 0.0 | 0 | 0.0 | Footnote * | Footnote * |
| Total | 236,133 | 132,299 | 56.0 | 12,336 | 5.2 | 14,573 | 6.2 | 47,728 | 20.2 |
Table 2: distribution of public service of Canada employees by designated group and region of work
The following table includes information (as of March 31, 2022) regarding indeterminates, terms of three months or more, and seasonal employees of organizations captured under the Financial Administration Act, Schedules I and IV (core public administration).
| Region of work | All employees | Women | Indigenous peoples | Persons with disabilities | Members of visible minorities | ||||
|---|---|---|---|---|---|---|---|---|---|
| Number | Number | % | Number | % | Number | % | Number | % | |
Newfoundland and Labrador |
4,082 | 2,080 | 51.0 | 293 | 7.2 | 256 | 6.3 | 110 | 2.7 |
Prince Edward Island |
2,215 | 1,441 | 65.1 | 52 | 2.3 | 152 | 6.9 | 76 | 3.4 |
Nova Scotia |
9,611 | 4,566 | 47.5 | 554 | 5.8 | 740 | 7.7 | 675 | 7.0 |
New Brunswick |
9,450 | 5,673 | 60.0 | 346 | 3.7 | 524 | 5.5 | 341 | 3.6 |
Quebec (without the NCR)Footnote † |
24,655 | 13,475 | 54.7 | 623 | 2.5 | 1,052 | 4.3 | 3,927 | 15.9 |
NCR (Quebec)Footnote † |
32,593 | 18,925 | 58.1 | 1,728 | 5.3 | 2,139 | 6.6 | 6,838 | 21.0 |
NCR (Ontario)Footnote † |
77,518 | 43,590 | 56.2 | 2,806 | 3.6 | 5,102 | 6.6 | 18,019 | 23.2 |
NCRFootnote † |
110,111 | 62,515 | 56.8 | 4,534 | 4.1 | 7,241 | 6.6 | 24,857 | 22.6 |
Ontario (without the NCR)Footnote † |
27,866 | 15,803 | 56.7 | 1,332 | 4.8 | 1,792 | 6.4 | 7,519 | 27.0 |
Manitoba |
7,513 | 4,401 | 58.6 | 1,165 | 15.5 | 476 | 6.3 | 1,168 | 15.5 |
Saskatchewan |
5,030 | 3,087 | 61.4 | 930 | 18.5 | 314 | 6.2 | 527 | 10.5 |
Alberta |
11,793 | 6,797 | 57.6 | 971 | 8.2 | 813 | 6.9 | 2,525 | 21.4 |
British Columbia |
19,132 | 9,825 | 51.4 | 1,115 | 5.8 | 1,003 | 5.2 | 5,102 | 26.7 |
Yukon |
337 | 211 | 62.6 | 50 | 14.8 | 26 | 7.7 | 36 | 10.7 |
Northwest Territories |
449 | 264 | 58.8 | 77 | 17.1 | 23 | 5.1 | 54 | 12.0 |
Nunavut |
285 | 168 | 58.9 | 141 | 49.5 | 10 | 3.5 | 40 | 14.0 |
Outside Canada |
1,449 | 722 | 49.8 | 72 | 5.0 | 39 | 2.7 | 352 | 24.3 |
Not availableFootnote ‡ |
2,155 | 1,271 | 59.0 | 81 | 3.8 | 112 | 5.2 | 419 | 19.4 |
Total |
236,133 | 132,299 | 56.0 | 12,336 | 5.2 | 14,573 | 6.2 | 47,728 | 20.2 |
Table 3.1: distribution of public service of Canada employees by designated group and occupational groups in force
The following table includes information (as of March 31, 2022) regarding indeterminates, terms of three months or more, and seasonal employees of organizations captured under the Financial Administration Act, Schedules I and IV (core public administration).
| Occupational group in force | All employees | Women | Men | Indigenous peoples | Persons with disabilities | Members of visible minorities | |||||
|---|---|---|---|---|---|---|---|---|---|---|---|
| Number | Number | % | Number | % | Number | % | Number | % | Number | % | |
| AI: Air Traffic Control | 10 | Footnote * | Footnote * | Footnote * | Footnote * | 0 | 0.0 | 0 | 0.0 | 0 | 0.0 |
| AO: Aircraft Operations | 381 | 40 | 10.5 | 341 | 89.5 | 11 | 2.9 | 6 | 1.6 | 11 | 2.9 |
| AU: Auditing | 172 | 86 | 50.0 | 86 | 50.0 | Footnote * | Footnote * | Footnote * | Footnote * | 47 | 27.3 |
| AV: Commerce and Purchasing | 6,930 | 3,656 | 52.8 | 3,269 | 47.2 | 304 | 4.4 | 432 | 6.2 | 1,395 | 20.1 |
| CX: Correctional Services | 6,965 | 1,961 | 28.2 | 4,999 | 71.8 | 767 | 11.0 | 282 | 4.0 | 927 | 13.3 |
| EB: Education and Library Science | 1,168 | 792 | 67.8 | 376 | 32.2 | 130 | 11.1 | 53 | 4.5 | 183 | 15.7 |
| EC: Economics and Social Science Services | 22,254 | 13,181 | 59.2 | 9,069 | 40.8 | 916 | 4.1 | 1,560 | 7.0 | 5,781 | 26.0 |
| EL: Electronics | 1,090 | 76 | 7.0 | 1,013 | 92.9 | 37 | 3.4 | 51 | 4.7 | 123 | 11.3 |
| EX: Executive | 6,834 | 3,592 | 52.6 | 3,241 | 47.4 | 337 | 4.9 | 443 | 6.5 | 953 | 13.9 |
| FB: Border Services | 9,744 | 3,954 | 40.6 | 5,790 | 59.4 | 402 | 4.1 | 414 | 4.2 | 1,618 | 16.6 |
| FI: Financial Management | 5,906 | 3,382 | 57.3 | 2,520 | 42.7 | 186 | 3.1 | 216 | 3.7 | 2,031 | 34.4 |
| FS: Foreign Services | 1,833 | 1,020 | 55.6 | 813 | 44.4 | 91 | 5.0 | 61 | 3.3 | 430 | 23.5 |
| HM: Human Resources Management | 4,606 | 3,764 | 81.7 | 842 | 18.3 | 244 | 5.3 | 473 | 10.3 | 938 | 20.4 |
| IT: Information Technology | 17,913 | 4,063 | 22.7 | 13,840 | 77.3 | 590 | 3.3 | 1,144 | 6.4 | 4,563 | 25.5 |
| LC: Law Management | 366 | 238 | 65.0 | 128 | 35.0 | 13 | 3.6 | 28 | 7.7 | 52 | 14.2 |
| LP: Law Practitioner | 3,232 | 1,907 | 59.0 | 1,320 | 40.8 | 137 | 4.2 | 206 | 6.4 | 618 | 19.1 |
| NR: Architecture, Engineering and Land Survey | 4,333 | 1,088 | 25.1 | 3,245 | 74.9 | 80 | 1.8 | 142 | 3.3 | 1,115 | 25.7 |
| PA: Program and Administrative Services | 100,895 | 73,242 | 72.6 | 27,610 | 27.4 | 6,411 | 6.4 | 7,424 | 7.4 | 21,176 | 21.0 |
| PM-MCO: Negotiation, Mediation and Conciliation Officers | 47 | 28 | 59.6 | 19 | 40.4 | Footnote * | Footnote * | Footnote * | Footnote * | Footnote * | Footnote * |
| PO: Police Operations Support | 451 | 326 | 72.3 | 123 | 27.3 | 19 | 4.2 | Footnote * | Footnote * | 63 | 14.0 |
| PR: Non-supervisory Printing Services | 4 | Footnote * | Footnote * | Footnote * | Footnote * | 0 | 0.0 | 0 | 0.0 | 0 | 0.0 |
| RE: Research | 2,723 | 911 | 33.5 | 1,812 | 66.5 | 36 | 1.3 | 98 | 3.6 | 635 | 23.3 |
| RO: Radio Operations | 284 | 92 | 32.4 | 192 | 67.6 | 22 | 7.7 | 13 | 4.6 | 7 | 2.5 |
| SH: Health Services | 3,804 | 3,076 | 80.9 | 723 | 19.0 | 251 | 6.6 | 173 | 4.5 | 573 | 15.1 |
| SO: Ships’ Officers | 1,285 | 181 | 14.1 | 1,103 | 85.8 | 24 | 1.9 | 18 | 1.4 | 46 | 3.6 |
| SP: Applied Science and Patent Examination | 9,579 | 5,203 | 54.3 | 4,375 | 45.7 | 190 | 2.0 | 378 | 3.9 | 2,416 | 25.2 |
| SR(C): Ship Repair Chargehands and Production Supervisors – East | 62 | Footnote * | Footnote * | Footnote * | Footnote * | Footnote * | Footnote * | 8 | 12.9 | 0 | 0.0 |
| SR(E): Ship Repair – East | 589 | 44 | 7.5 | 545 | 92.5 | 23 | 3.9 | 25 | 4.2 | 14 | 2.4 |
| SR(W): Ship Repair – West | 653 | 37 | 5.7 | 614 | 94.0 | 19 | 2.9 | 13 | 2.0 | 25 | 3.8 |
| SV: Operational Services | 10,112 | 2,150 | 21.3 | 7,953 | 78.6 | 537 | 5.3 | 407 | 4.0 | 555 | 5.5 |
| TC: Technical Services | 10,838 | 3,503 | 32.3 | 7,328 | 67.6 | 542 | 5.0 | 471 | 4.3 | 1,326 | 12.2 |
| TR: Translation | 837 | 641 | 76.6 | 196 | 23.4 | 7 | 0.8 | 19 | 2.3 | 55 | 6.6 |
| UT: University Teaching | 218 | 55 | 25.2 | 162 | 74.3 | Footnote * | Footnote * | 7 | 3.2 | 45 | 20.6 |
| Unknown | 15 | Footnote * | Footnote * | Footnote * | Footnote * | 0 | 0.0 | 0 | 0.0 | Footnote * | Footnote * |
| Total | 236,133 | 132,299 | 56.0 | 103,728 | 43.9 | 12,336 | 5.2 | 14,573 | 6.2 | 47,728 | 20.2 |
Table 3.2: distribution of public service of Canada employees by designated group and (outdated) occupational category
The following table includes information (as of March 31, 2022) regarding indeterminates, terms of three months or more, and seasonal employees of organizations captured under the Financial Administration Act, Schedules I and IV (core public administration).
| Occupational category (outdated) | All employees | Women | Indigenous peoples | Persons with disabilities | Members of visible minorities | ||||
|---|---|---|---|---|---|---|---|---|---|
| Number | Number | % | Number | % | Number | % | Number | % | |
| Executives | 7,200 | 3,830 | 53.2 | 350 | 4.9 | 471 | 6.5 | 1,005 | 14.0 |
EX (Executive) |
6,834 | 3,592 | 52.6 | 337 | 4.9 | 443 | 6.5 | 953 | 13.9 |
LC (Law Management)Footnote † |
366 | 238 | 65.0 | 13 | 3.6 | 28 | 7.7 | 52 | 14.2 |
| Scientific and Professional | 47,453 | 26,273 | 55.4 | 1,726 | 3.6 | 2,621 | 5.5 | 11,410 | 24.0 |
| Administrative and Foreign Service | 122,012 | 76,786 | 62.9 | 6,662 | 5.5 | 8,408 | 6.9 | 27,176 | 22.3 |
| Technical | 13,918 | 3,919 | 28.2 | 654 | 4.7 | 560 | 4.0 | 1,516 | 10.9 |
| Administrative Support | 16,954 | 13,010 | 76.7 | 1,172 | 6.9 | 1,363 | 8.0 | 3,416 | 20.1 |
| Operational | 28,581 | 8,476 | 29.7 | 1,772 | 6.2 | 1,150 | 4.0 | 3,202 | 11.2 |
| Undetermined | 15 | 5 | 33.3 | 0 | 0.0 | 0 | 0.0 | 3 | 20.0 |
| Total | 236,133 | 132,299 | 56.0 | 12,336 | 5.2 | 14,573 | 6.2 | 47,728 | 20.2 |
Notes
1. The source of the representation data is the Treasury Board of Canada Secretariat Employment Equity Data Bank, which is populated with self-identification information provided by employees.
2. The sum of designated groups does not equal the total (“all employees”) because employees may have chosen to self-identify in more than one designated group, and men are included in the total.
Table 4: distribution of public service of Canada employees by designated group and salary range
The following table includes information (as of March 31, 2022) regarding indeterminates, terms of three months or more, and seasonal employees of organizations captured under the Financial Administration Act, Schedules I and IV (core public administration).
| Salary range ($) | All employees | Women | Indigenous peoples | Persons with disabilities | Members of visible minorities | |||||||||
|---|---|---|---|---|---|---|---|---|---|---|---|---|---|---|
| Number | % of all employees | Number | % of salary range | % of EEFootnote † group | Number | % of salary range | % of EEFootnote † group | Number | % of salary range | % of EEFootnote † group | Number | % of salary range | % of EEFootnote † group | |
| Under 5,000 | 64 | 0.0 | 26 | 40.6 | 0.0 | 0 | 0.0 | 0.0 | 0 | 0.0 | 0.0 | 0 | 0.0 | 0.0 |
| 5,000 to 9,999 | 151 | 0.1 | 41 | 27.2 | 0.0 | 0 | 0.0 | 0.0 | Footnote * | Footnote * | Footnote * | Footnote * | Footnote * | Footnote * |
| 10,000 to 14,999 | 43 | 0.0 | Footnote * | Footnote * | Footnote * | Footnote * | Footnote * | Footnote * | Footnote * | Footnote * | Footnote * | Footnote * | Footnote * | Footnote * |
| 15,000 to 19,999 | 174 | 0.1 | 118 | 67.8 | 0.1 | Footnote * | Footnote * | Footnote * | 15 | 8.6 | 0.1 | 36 | 20.7 | 0.1 |
| 20,000 to 24,999 | 214 | 0.1 | 155 | 72.4 | 0.1 | 7 | 3.3 | 0.1 | 14 | 6.5 | 0.1 | 46 | 21.5 | 0.1 |
| 25,000 to 34,999 | 472 | 0.2 | 360 | 76.3 | 0.3 | 38 | 8.1 | 0.3 | 42 | 8.9 | 0.3 | 82 | 17.4 | 0.2 |
| 35,000 to 49,999 | 4,079 | 1.7 | 2,806 | 68.8 | 2.1 | 239 | 5.9 | 1.9 | 311 | 7.6 | 2.1 | 716 | 17.6 | 1.5 |
| 50,000 to 74,999 | 94,840 | 40.2 | 61,684 | 65.0 | 46.6 | 5,267 | 5.6 | 42.7 | 6,308 | 6.7 | 43.3 | 21,140 | 22.3 | 44.3 |
| 75,000 to 99,999 | 76,910 | 32.6 | 38,745 | 50.4 | 29.3 | 4,435 | 5.8 | 36.0 | 4,414 | 5.7 | 30.3 | 14,615 | 19.0 | 30.6 |
| 100,000 to 149,999 | 54,726 | 23.2 | 26,168 | 47.8 | 19.8 | 2,192 | 4.0 | 17.8 | 3,189 | 5.8 | 21.9 | 10,422 | 19.0 | 21.8 |
| 150,000 to 199,999 | 4,032 | 1.7 | 1,958 | 48.6 | 1.5 | 142 | 3.5 | 1.2 | 243 | 6.0 | 1.7 | 602 | 14.9 | 1.3 |
| 200,000 to 249,999 | 422 | 0.2 | 213 | 50.5 | 0.2 | 11 | 2.6 | 0.1 | 23 | 5.5 | 0.2 | 56 | 13.3 | 0.1 |
| 250,000 and over | 6 | 0.0 | Footnote * | Footnote * | Footnote * | 0 | 0.0 | 0.0 | 0 | 0.0 | 0.0 | Footnote * | Footnote * | Footnote * |
| Total | 236,133 | 100.0 | 132,299 | 56.0 | 100.0 | 12,336 | 5.2 | 100.0 | 14,573 | 6.2 | 100.0 | 47,728 | 20.2 | 100.0 |
Table 5: hirings into, promotions within and separations from the public service of Canada by designated group
The following table includes information (as of March 31, 2022) regarding indeterminates, terms of three months or more, and seasonal employees of organizations captured under the Financial Administration Act, Schedules I and IV (core public administration).
| Action type | All employees | Women | Indigenous peoples | Persons with disabilities | Members of visible minorities | ||||
|---|---|---|---|---|---|---|---|---|---|
| Number | Number | % | Number | % | Number | % | Number | % | |
| Hirings | 28,929 | 17,392 | 60.1 | 1,209 | 4.2 | 1,601 | 5.5 | 6,723 | 23.2 |
| Promotions | 29,295 | 18,256 | 62.3 | 1,493 | 5.1 | 1,681 | 5.7 | 6,818 | 23.3 |
| Separations | 16,687 | 9,443 | 56.6 | 850 | 5.1 | 1,097 | 6.6 | 2,033 | 12.2 |
Notes
- The source of the representation data is the Treasury Board of Canada Secretariat Employment Equity Data Bank, which is populated with self-identification information provided by employees.
- The sum of designated groups does not equal the total (“all employees”) because employees may have voluntarily chosen to self-identify in more than one designated group, and men are included in the total.
- “Hirings” refers to employees who were added to the public service of Canada payroll between April 1, 2021, and March 31, 2022.
- Data on promotions are obtained from the Public Service Commission of Canada and include information from departments and agencies that fall under both the Financial Administration Act, Schedules I and IV, and the Public Service Employment Act.
- “Separations” refers to employees who left the public service of Canada payroll between April 1, 2021, and March 31, 2022.
- Percentages are that designated group’s share of all actions of the given type.
Table 6: distribution of public service of Canada employees by designated group and age range
The following table includes information (as of March 31, 2022) regarding indeterminates, terms of three months or more, and seasonal employees of organizations captured under the Financial Administration Act, Schedules I and IV (core public administration).
| Age range (years) | All employees | Women | Indigenous peoples | Persons with disabilities | Members of visible minorities | |||||||||
|---|---|---|---|---|---|---|---|---|---|---|---|---|---|---|
| Number | % of all employees | Number | % of age range | % of EEFootnote † group | Number | % of age range | % of EEFootnote † group | Number | % of age range | % of EEFootnote † group | Number | % of age range | % of EEFootnote † group | |
| Under 20 | 104 | 0.0 | 52 | 50.0 | 0.0 | 6 | 5.8 | 0.0 | Footnote * | Footnote * | Footnote * | 9 | 8.7 | 0.0 |
| 20 to 24 | 6,356 | 2.7 | 3,860 | 60.7 | 2.9 | 317 | 5.0 | 2.6 | 302 | 4.8 | 2.1 | 1,553 | 24.4 | 3.3 |
| 25 to 29 | 23,726 | 10.0 | 14,331 | 60.4 | 10.8 | 1,012 | 4.3 | 8.2 | 1,166 | 4.9 | 8.0 | 6,514 | 27.5 | 13.6 |
| 30 to 34 | 25,934 | 11.0 | 14,746 | 56.9 | 11.1 | 1,214 | 4.7 | 9.8 | 1,179 | 4.5 | 8.1 | 6,103 | 23.5 | 12.8 |
| 35 to 39 | 31,457 | 13.3 | 17,983 | 57.2 | 13.6 | 1,497 | 4.8 | 12.1 | 1,596 | 5.1 | 11.0 | 6,807 | 21.6 | 14.3 |
| 40 to 44 | 36,503 | 15.5 | 21,255 | 58.2 | 16.1 | 1,847 | 5.1 | 15.0 | 1,949 | 5.3 | 13.4 | 7,489 | 20.5 | 15.7 |
| 45 to 49 | 35,547 | 15.1 | 20,279 | 57.0 | 15.3 | 1,997 | 5.6 | 16.2 | 2,202 | 6.2 | 15.1 | 6,844 | 19.3 | 14.3 |
| 50 to 54 | 31,914 | 13.5 | 17,574 | 55.1 | 13.3 | 2,010 | 6.3 | 16.3 | 2,308 | 7.2 | 15.8 | 5,429 | 17.0 | 11.4 |
| 55 to 59 | 26,261 | 11.1 | 13,593 | 51.8 | 10.3 | 1,492 | 5.7 | 12.1 | 2,167 | 8.3 | 14.9 | 3,968 | 15.1 | 8.3 |
| 60 to 64 | 13,049 | 5.5 | 6,304 | 48.3 | 4.8 | 711 | 5.4 | 5.8 | 1,170 | 9.0 | 8.0 | 2,022 | 15.5 | 4.2 |
| 65 to 69 | 4,171 | 1.8 | 1,875 | 45.0 | 1.4 | 199 | 4.8 | 1.6 | 407 | 9.8 | 2.8 | 754 | 18.1 | 1.6 |
| 70+ | 1,111 | 0.5 | 447 | 40.2 | 0.3 | 34 | 3.1 | 0.3 | Footnote * | Footnote * | Footnote * | 236 | 21.2 | 0.5 |
| Total | 236,133 | 100.0 | 132,299 | 56.0 | 100.0 | 12,336 | 5.2 | 100.0 | 14,573 | 6.2 | 100.0 | 47,728 | 20.2 | 100.0 |
Table 7: representation in the public service of Canada by designated group and fiscal year
The following table includes information (as of March 31, 2022) regarding indeterminates, terms of three months or more, and seasonal employees of organizations captured under the Financial Administration Act, Schedules I and IV (core public administration).
| Public service representation | All employees | Women | Indigenous peoples | Persons with disabilities | Members of visible minorities | ||||
|---|---|---|---|---|---|---|---|---|---|
| Number | Number | % | Number | % | Number | % | Number | % | |
| As of March 31, 2022 | 236,133 | 132,299 | 56.0 | 12,336 | 5.2 | 14,573 | 6.2 | 47,728 | 20.2 |
| As of March 31, 2021 | 228,345 | 127,043 | 55.6 | 11,977 | 5.2 | 12,893 | 5.6 | 43,122 | 18.9 |
| As of March 31, 2020 | 214,120 | 117,760 | 55.0 | 10,888 | 5.1 | 11,087 | 5.2 | 38,145 | 17.8 |
| As of March 31, 2019 | 203,268 | 111,332 | 54.8 | 10,435 | 5.1 | 10,622 | 5.2 | 34,004 | 16.7 |
| As of March 31, 2018 | 192,467 | 105,465 | 54.8 | 9,876 | 5.1 | 10,181 | 5.3 | 30,273 | 15.7 |
| As of March 31, 2017 | 185,484 | 101,136 | 54.5 | 9,726 | 5.2 | 10,259 | 5.5 | 28,058 | 15.1 |
| As of March 31, 2016 | 181,674 | 98,846 | 54.4 | 9,358 | 5.2 | 10,092 | 5.6 | 26,336 | 14.5 |
| As of March 31, 2015 | 180,681 | 98,051 | 54.3 | 9,232 | 5.1 | 10,204 | 5.6 | 24,849 | 13.8 |
| As of March 31, 2014 | 181,356 | 98,078 | 54.1 | 9,239 | 5.1 | 10,390 | 5.7 | 23,919 | 13.2 |
| As of March 31, 2013 | 188,342 | 102,124 | 54.2 | 9,491 | 5.0 | 10,871 | 5.8 | 23,812 | 12.6 |
| As of March 31, 2012 | 198,793 | 108,620 | 54.6 | 9,785 | 4.9 | 11,418 | 5.7 | 23,978 | 12.1 |
| As of March 31, 2011 | 202,631 | 111,051 | 54.8 | 9,486 | 4.7 | 11,388 | 5.6 | 22,998 | 11.3 |
| As of March 31, 2010 | 202,386 | 110,867 | 54.8 | 9,307 | 4.6 | 11,620 | 5.7 | 21,567 | 10.7 |
| As of March 31, 2009 | 195,667 | 107,089 | 54.7 | 8,892 | 4.5 | 11,468 | 5.9 | 19,264 | 9.8 |
| As of March 31, 2008 | 186,754 | 101,589 | 54.4 | 8,190 | 4.4 | 11,001 | 5.9 | 17,207 | 9.2 |
| As of March 31, 2007 | 179,540 | 96,816 | 53.9 | 7,610 | 4.2 | 10,192 | 5.7 | 15,787 | 8.8 |
| As of March 31, 2006 | 176,630 | 95,013 | 53.8 | 7,381 | 4.2 | 10,169 | 5.8 | 15,112 | 8.6 |
| As of March 31, 2005 | 165,856 | 88,702 | 53.5 | 6,886 | 4.2 | 9,626 | 5.8 | 13,498 | 8.1 |
| As of March 31, 2004 | 165,976 | 88,175 | 53.1 | 6,723 | 4.1 | 9,452 | 5.7 | 13,001 | 7.8 |
| As of March 31, 2003 | 163,314 | 86,162 | 52.8 | 6,426 | 3.9 | 9,155 | 5.6 | 12,058 | 7.4 |
| As of March 31, 2002 | 157,510 | 82,663 | 52.5 | 5,980 | 3.8 | 8,331 | 5.3 | 10,772 | 6.8 |
| As of March 31, 2001 | 149,339 | 77,785 | 52.1 | 5,316 | 3.6 | 7,621 | 5.1 | 9,143 | 6.1 |
| As of March 31, 2000Footnote * (Revenue Canada excluded) |
141,253 | 72,549 | 51.4 | 4,639 | 3.3 | 6,687 | 4.7 | 7,764 | 5.5 |
| As of March 31, 1999 (Revenue Canada included) |
178,340 | 91,856 | 51.5 | 5,124 | 2.9 | 8,137 | 4.6 | 10,557 | 5.9 |
| As of March 31, 1998 | 179,831 | 90,801 | 50.5 | 4,770 | 2.7 | 6,943 | 3.9 | 9,260 | 5.1 |
| Workforce availability | All employees | Women | Indigenous peoples | Persons with disabilities | Members of visible minorities | ||||
|---|---|---|---|---|---|---|---|---|---|
| Number | Number | % | Number | % | Number | % | Number | % | |
| 2016 Census and 2017 Canadian Survey on Disability (based on Canadian citizens and permanent residents) | n/a | n/a | 53.3 | n/a | 3.8 | n/a | 9.1 | n/a | 17.2 |
| 2016 Census and 2017 Canadian Survey on Disability (Based on Canadian citizens only) | n/a | n/a | 52.7 | n/a | 4.0 | n/a | 9.0 | n/a | 15.3 |
| 2011 National Household Survey and 2012 Canadian Survey on Disability | n/a | n/a | 52.5 | n/a | 3.4 | n/a | 4.4 | n/a | 13.0 |
| 2006 Census and Participation and Activity Limitation Survey (PALS) | n/a | n/a | 52.3 | n/a | 3.0 | n/a | 4.0 | n/a | 12.4 |
| 2001 Census and PALS | n/a | n/a | 52.2 | n/a | 2.5 | n/a | 3.6 | n/a | 10.4 |
| 1996 Census and 1991 Health and Activity Limitation Survey (HALS) | n/a | n/a | 48.7 | n/a | 1.7 | n/a | 4.8 | n/a | 8.7 |
| 1991 Census and HALS | n/a | n/a | 47.3 | n/a | 2.6 | n/a | 4.8 | n/a | 9.0 |