
Employment Equity in the Public Service of Canada for Fiscal Year 2022 to 2023
On this page
- Message from the President of the Treasury Board
- Introduction
- Part 1: Overview of employment equity in the core public administration
- Part 2: Data and initiatives pertaining to specific groups
- Appendix: Statistical tables of employment equity data covered under section 21 of the Employment Equity Act
Message from the President of the Treasury Board
Each year, the President of the Treasury Board presents the annual report to Parliament on employment equity in the Public Service of Canada. As such, I am presenting the report for fiscal year 2022-23.
The Government of Canada continues to pursue and support an equitable and respectful workplace that ensures inclusion of all equity-seeking communities and advances reconciliation with Indigenous Peoples.
Over the past 3 decades, we have made considerable progress in increasing the representation of the 4 designated employment-equity groups, but there is more work to do to create a more representative federal public service, where everyone experiences a sense of belonging and has an opportunity to succeed.
In 2022–23, the government continued to make progress by using data trends on representation and hires, promotions, and departures to shine more light on the barriers faced by employment-equity groups.
Since then, we have taken additional steps to build a more diverse, inclusive, and accessible public service. These include:
- Introducing a panel of experts to provide recommendations on the design of a restorative engagement program to address harm and foster positive change within individuals, groups, institutions, and systems;
- Preparing a modernized approach to the collection of self-identification data to provide better data on employment equity and inclusion;
- implementing the GC Workplace Accessibility Passport in 55 government organizations, so that employees with disabilities can get the tools, supports, and measures they need to perform at their best;
- launching the second cohort of the Mosaic Program for equity-seeking employees at the EX minus 1 level;
- announcing the initial investments and future engagements as part of the Action Plan for Black Public Servants; and
- acting on the Auditor General’s Report 5—Inclusion in the Workplace for Racialized Employees.
We have also been reviewing the recommendations of the Employment Equity Act Review Task Force and are working to respond to the task force’s historic recommendations. These include creating new designated groups for Black people and people in the 2SLGBTQI+ community under the act and replacing the terms “Aboriginal Peoples” and “members of visible minorities” with “Indigenous Peoples” and “racialized people,” as well as updating their definitions.
Finally, in line with the Clerk of the Privy Council’s “Call to Action on Anti-Racism, Equity, and Inclusion” and the “Call to Action Forward Direction,” the Treasury Board Secretariat is working to support departments in their efforts to achieve equity, remove barriers, and address and prevent all forms of discrimination and hate from federal workplaces.
I encourage you to read this report to find out more about our work to meaningfully include equity-seeking employees in the federal public service and better serve all Canadians.
Original signed by
The Honourable Anita Anand, P.C., M.P.
President of the Treasury Board of Canada
Introduction
In this section
Employment equity in the public service
The Employment Equity Act is a key element of the legislative authority that helps ensure equity and fairness in the public service. Under the Act, the employer is required to measure progress in terms of representation and continually improve employment equity in the workplace. General representation, where designated groups are represented proportionally overall within the public service, is not sufficient; representation must be reflected in a more profound and targeted way through various indicators.
A diverse workforce in the public service is made up of individuals who have an array of identities, abilities, backgrounds, cultures, skills, perspectives and experiences that are representative of Canada’s current and evolving population. An inclusive workplace is fair, equitable, supportive, welcoming and respectful. It recognizes, values and leverages differences in identities, abilities, backgrounds, cultures, skills, experiences and perspectives that support and reinforce Canada’s evolving human rights framework.Footnote 1
This report highlights key data that point to trends and gaps in representation in the core public administration (CPA) and outlines enterprise-wide initiatives and activities being taken within the federal public service to identify, eliminate and prevent barriers to the full participation of members of the employment equity groups. These initiatives focus on five areas of priority that the Treasury Board of Canada Secretariat (TBS) identified in January 2021:
- generating and publishing data for a more accurate picture of representation gaps
- increasing the diversity of senior leaders of the public service
- ensuring the right benchmarks
- addressing systemic barriers
- promoting engagement and awareness
About this report
The public service of Canada has been subject to the Employment Equity Act and its regulations since 1996. Each fiscal year, the President of the Treasury Board must:
- table a report in Parliament on the state of employment equity of the four designated groups within the CPA
- table similar reports in Parliament produced by separate agencies that have 100 or more employees
This annual report presents a snapshot of data, as of March 31, 2023, and initiatives that took place during fiscal year 2022–23.
New this year is the introduction of multi-year data trends on representation, a breakdown of executives by level, additional information on salary bands, and trends on hires, promotions and separations.
Part 1 of the report provides an overview of employment equity in the core public administration. Part 2 provides data and initiatives pertaining to specific groups:
The statistical tables in Part 2 present information as of March 31, 2023, for indeterminate employees, term employees of three months or more, and seasonal employees of organizations listed in Schedules I and IV of the Financial Administration Act. Notes on the data presented in the tables are available in the About the data section of this report.
Note to readers
Although statistical measures such as workforce availability (WFA), representation and gaps provide insights into the diversity of an organization and the public service, measures must also inform actions that are future-oriented. This report uses WFA based on the 2016 Census and the 2017 Canadian Survey of Disability as the most recent benchmarks for representation. To ensure that we continue to close gaps and sustain progress towards representation, WFA must be regarded as a floor and not a ceiling.
This report marks a transition year. At the time of writing, the recommendations of the arm’s-length task force on the Employment Equity Act review, led by the Labour Program, were released. TBS has noted the government’s initial commitments, released on December 11, 2023, that include the following:
- creating two new designated groups under the Act: Black people and 2SLGBTQI+Footnote 2 people
- replacing the term “Aboriginal peoples” with “Indigenous Peoples,” and updating the definition to include First Nations, Métis and Inuit and to ensure it is consistent with the United Nations Declaration on the Rights of Indigenous Peoples Act
- replacing the term “members of visible minorities” with “racialized people” and updating the corresponding definition
- aligning the definition of “persons with disabilities” with the Accessible Canada Act to make the definition more inclusiveFootnote 3
The Government of Canada will soon consult with affected communities and organizations that represent unions and employers on how best to effectively implement these changes and how other Task Force recommendations could be implemented. The government will then introduce legislation to bring the Act into the 21st century.
Note on terminology
The term “Indigenous Peoples” is consistent with the United Nations Declaration on the Rights of Indigenous Peoples Act and the Labour Program of Employment and Social Development Canada. In this report, the legislative term “Aboriginal peoples” that appears in the Employment Equity Act and the Employment Equity Regulations has been replaced with the term “Indigenous Peoples.” In December 2023, the Government of Canada committed to replacing the term “Aboriginal peoples” with “Indigenous Peoples” and updating the definition to include First Nations, Métis and Inuit.Footnote 4
The term “members of visible minorities” appears in both the Employment Equity Act and the Employment Equity Regulations and is used throughout this report. The term refers to members of racialized groups or racialized people. The Treasury Board of Canada Secretariat (TBS) recognizes that the term “racialized” has gained widespread acceptance in the public service and can therefore be understood as interchangeable with “members of visible minorities” within this report. The Government of Canada has committed to replacing the term and updating the corresponding definition.
TBS recognizes that the terminology and data definitions in this report do not yet reflect the above-noted initial commitments; however, they will be reflected in future iterations of this annual report. In addition, although this report uses the current benchmark of workforce availability, TBS will monitor future discussions and developments pertaining to the recommendations of the Report of the Employment Equity Act Review Task Force to systematically rethink employment equity data collection and benchmarks.
Part 1: Overview of employment equity in the core public administration
In this section
Core public administration representation
The core public administration (CPA) population for employment equity purposes includes indeterminate employees, term employees of three months or more, and seasonal employees of organizations listed in Schedules I and IV of the Financial Administration Act. The CPA population is based on the effective classification which includes acting assignments. Employees on leave without pay, term employees less than three months, students and casual workers, Governor in Council appointees, Ministers’ exempt staff, federal judges, and deputy ministers are excluded.
Internal representation is based on those who have voluntarily chosen to self-identify and self-declare to date as an Indigenous person, a person with a disability and/or a person in a visible minority group, while sex information is taken from the pay system.
Workforce availability (WFA) is calculated based on the 2016 Census and the 2017 Canadian Survey on Disability.
Figures in square brackets represent the change since the previous year or fiscal year.
Core public administration population
Employment equity population
As of March 2023, the size of the CPA increased by 17,278 to a total of 253,411 employees. The number of employeesFootnote 5 who identify as belonging to one or more employment equity groups increased by 14,792, accounting for a total of 176,441 employees and representing 69.6% of the CPA.
Three of the four employment equity designated groups are above their WFA at the aggregate level.
| Representation | WFA | |
|---|---|---|
| Women | 56.6% [+0.6] | 53.7% Met |
| Indigenous Peoples | 5.3% [+0.1] | 3.8% Met |
| Persons with disabilities | 6.9% [+0.7] | 9.2% Not met |
| Members of visible minorities | 21.7% [+1.5] | 17.3% Met |
Representation data for the four designated employment equity groups increased since the previous year, with the largest increase (1.5 percentage points) among members of visible minorities.
Although the representation of persons with disabilities has increased by 0.7 percentage points since the previous year, this group continues to be under-represented. As indicated in the About the data section of this report, WFA estimates for persons with disabilities increased substantially between the 2011 and 2016 Census and the 2012 and 2017 Canadian Survey on Disability. This increase is because the 2017 Canadian Survey on Disability expanded the definition of “persons with disabilities” to include disabilities related to pain and mental health. The self-identification data collected for the public service is not based on this expanded definition. A new Self-Identification Questionnaire has been developed and is expected to provide a more accurate picture that reflects this new definition once fully implemented in 2024.
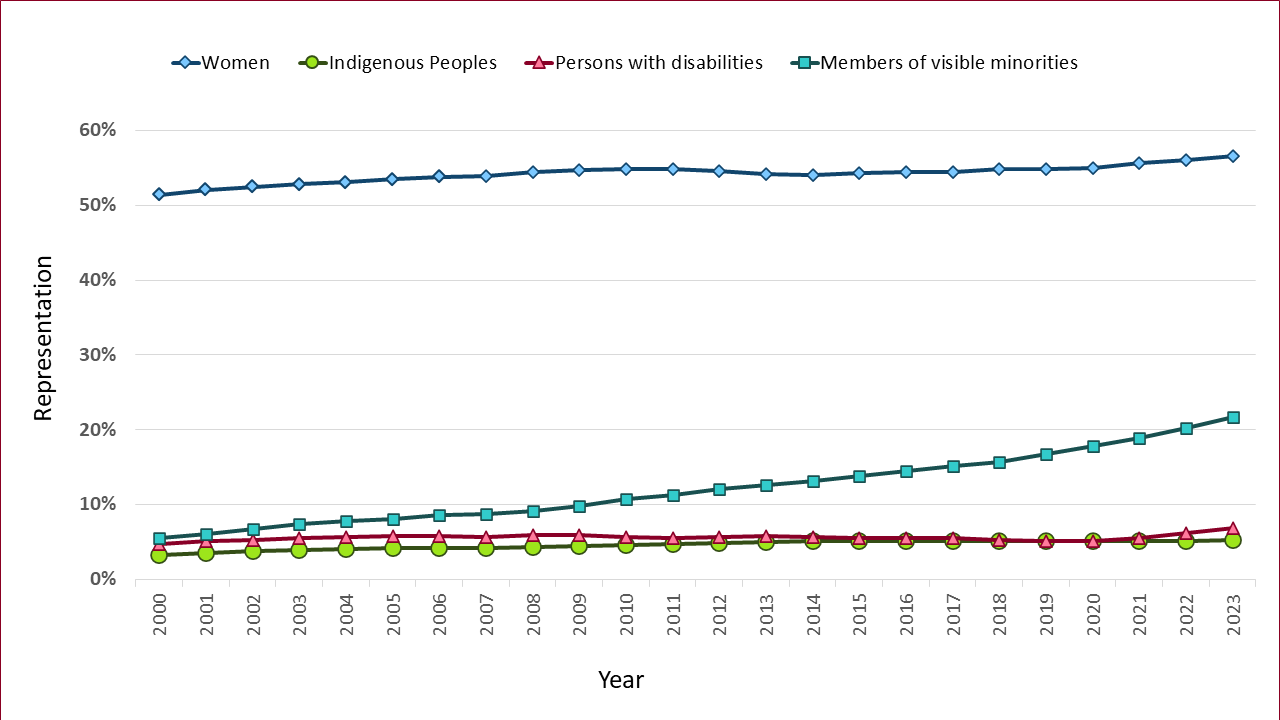
Figure 1 - Text version
| Year | Women | Indigenous Peoples | Persons with disabilities | Members of visible minorities |
|---|---|---|---|---|
| 2000 | 51.4% | 3.3% | 4.7% | 5.5% |
| 2001 | 52.1% | 3.6% | 5.1% | 6.1% |
| 2002 | 52.5% | 3.8% | 5.3% | 6.8% |
| 2003 | 52.8% | 3.9% | 5.6% | 7.4% |
| 2004 | 53.1% | 4.1% | 5.7% | 7.8% |
| 2005 | 53.5% | 4.2% | 5.8% | 8.1% |
| 2006 | 53.8% | 4.2% | 5.8% | 8.6% |
| 2007 | 53.9% | 4.2% | 5.7% | 8.8% |
| 2008 | 54.4% | 4.4% | 5.9% | 9.2% |
| 2009 | 54.7% | 4.5% | 5.9% | 9.8% |
| 2010 | 54.8% | 4.6% | 5.7% | 10.7% |
| 2011 | 54.8% | 4.7% | 5.6% | 11.3% |
| 2012 | 54.6% | 4.9% | 5.7% | 12.1% |
| 2013 | 54.2% | 5.0% | 5.8% | 12.6% |
| 2014 | 54.1% | 5.1% | 5.7% | 13.2% |
| 2015 | 54.3% | 5.1% | 5.6% | 13.8% |
| 2016 | 54.4% | 5.2% | 5.6% | 14.5% |
| 2017 | 54.5% | 5.2% | 5.5% | 15.1% |
| 2018 | 54.8% | 5.1% | 5.3% | 15.7% |
| 2019 | 54.8% | 5.1% | 5.2% | 16.7% |
| 2020 | 55.0% | 5.1% | 5.2% | 17.8% |
| 2021 | 55.6% | 5.2% | 5.6% | 18.9% |
| 2022 | 56.0% | 5.2% | 6.2% | 20.2% |
| 2023 | 56.6% | 5.3% | 6.9% | 21.7% |
Between March 2000 and March 2023, the CPA saw growth in its workforce, from 141,253 (as of March 31, 2000, and excluding Revenue Canada) to 253,411. Women represented 51.4% of the CPA population in March 2000, increasing to 56.6% by March 2023. Notably, the visible minority group experienced the most substantial percentage point increase, increasing from 5.5% in March 2000 to 21.7% by March 2023. Representation of Indigenous Peoples grew from 3.3% to 5.3%, and representation of persons with disabilities increased from 4.7% to 6.9% during the same period.
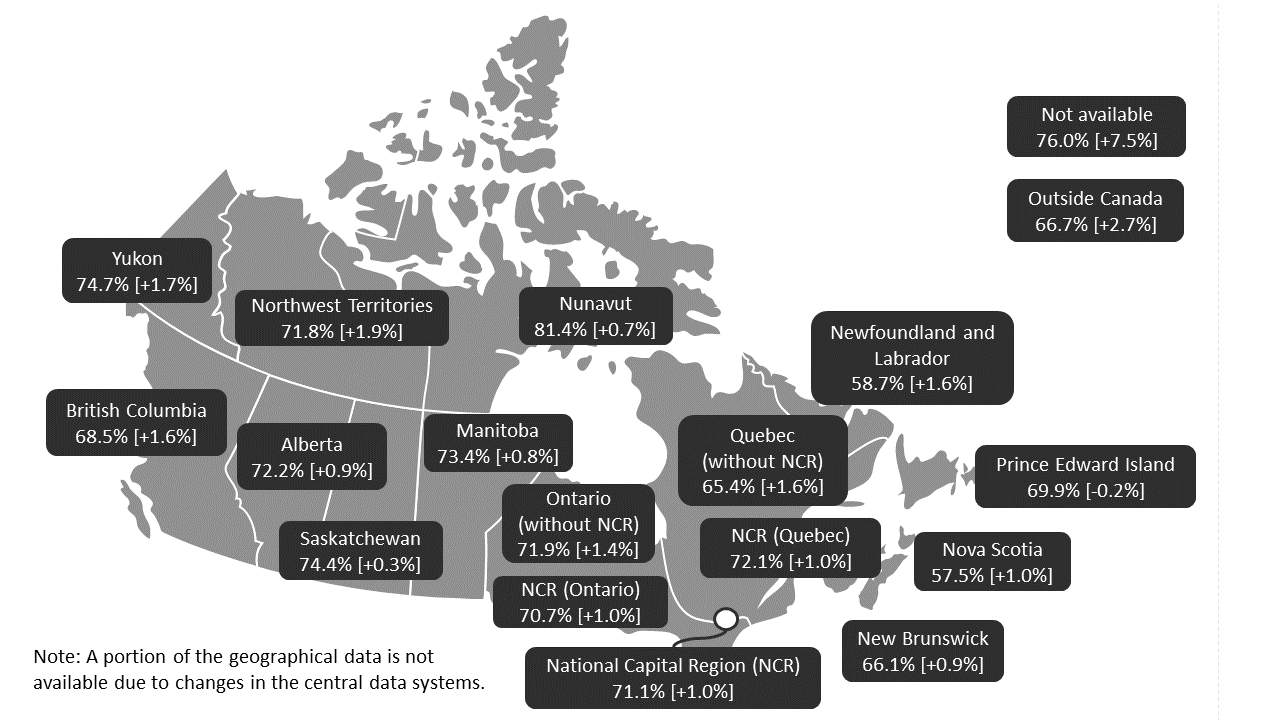
Figure 2 - Text version
Note: Figures in square brackets represent the change since March 2022.
Following are percentages by province, territory and other categories:
- Newfoundland and Labrador: 58.7% [increase of 1.6 percentage points]
- Prince Edward Island: 69.9% [decrease of 0.2 percentage points]
- Nova Scotia: 57.5% [increase of 1.0 percentage points]
- New Brunswick: 66.1% [increase of 0.9 percentage points]
- Quebec (without the National Capital Region): 65.4% [increase of 1.6 percentage points]
- National Capital Region (Quebec): 72.1% [increase of 1.0 percentage points]
- National Capital Region (Ontario): 70.7% [increase of 1.0 percentage points]
- National Capital Region: 71.1% [increase of 1.0 percentage points]
- Ontario (without the National Capital Region): 71.9% [increase of 1.4 percentage points]
- Manitoba: 73.4% [increase of 0.8 percentage points]
- Saskatchewan: 74.4% [increase of 0.3 percentage points]
- Alberta: 72.2% [increase of 0.9 percentage points]
- British Columbia: 68.5% [increase of 1.6 percentage points]
- Yukon: 74.7% [increase of 1.7 percentage points]
- Northwest Territories: 71.8% [increase of 1.9 percentage points]
- Nunavut: 81.4% [increase of 0.7 percentage points]
- Outside Canada: 66.7% [increase of 2.7 percentage points]
- Not available: 76.0% [increase of 7.5 percentage points]
Note: A portion of the geographic data is not available due to changes in the central data systems.
Representation, as defined by the percentage of CPA employees that identify as belonging to one or more employment equity group, has increased since the previous year in all but one region of work. Representation of employment equity employees is highest in Nunavut (81.4%), Yukon (74.7%) and Saskatchewan (74.4%). Newfoundland and Labrador and Nova Scotia have the lowest representation, at 58.7% and 57.5%, respectively.
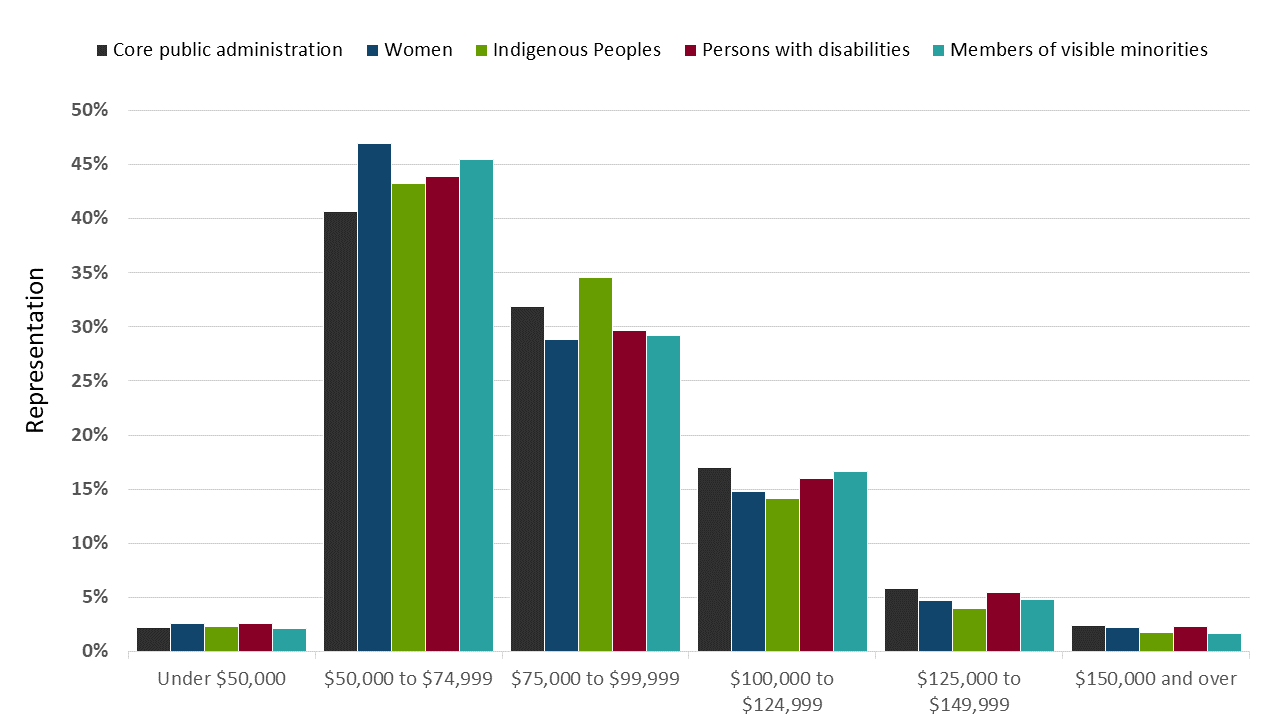
Figure 3 - Text version
| Salary range | Core public administration | Women | Indigenous Peoples | Persons with disabilities | Members of visible minorities |
|---|---|---|---|---|---|
| Under $50,000 | 2.2% | 2.6% | 2.3% | 2.6% | 2.1% |
| $50,000 to $74,999 | 40.7% | 46.9% | 43.2% | 43.9% | 45.5% |
| $75,000 to $99,999 | 31.9% | 28.8% | 34.6% | 29.7% | 29.2% |
| $100,000 to $124,999 | 17.0% | 14.8% | 14.1% | 16.0% | 16.6% |
| $125,000 to $149,999 | 5.8% | 4.7% | 4.0% | 5.5% | 4.8% |
| $150,000 and over | 2.4% | 2.2% | 1.8% | 2.3% | 1.7% |
Compared with the CPA, the proportion of the four designated employment equity groups is higher in the $50,000 to $74,999 salary range and lower in the salary ranges of $75,000 and over, except for the $75,000 to $99,999 salary range, where there is a higher proportion of Indigenous employees. For salaries under $50,000, the proportions of women, Indigenous Peoples and persons with disabilities are higher compared with the CPA.
| Fiscal year | All employees | Women | Indigenous Peoples | Persons with disabilities | Members of visible minorities | ||||
|---|---|---|---|---|---|---|---|---|---|
| Number | % of hires | Number | % of hires | Number | % of hires | Number | % of hires | ||
| 2016–17 | 16,081 | 9,281 | 57.7 | 703 | 4.4 | 603 | 3.7 | 2,875 | 17.9 |
| 2017–18 | 19,249 | 11,290 | 58.7 | 767 | 4.0 | 685 | 3.6 | 3,402 | 17.7 |
| 2018–19 | 23,334 | 13,181 | 56.5 | 962 | 4.1 | 866 | 3.7 | 4,510 | 19.3 |
| 2019–20 | 24,901 | 14,505 | 58.3 | 988 | 4.0 | 977 | 3.9 | 5,302 | 21.3 |
| 2020–21 | 24,229 | 14,592 | 60.2 | 927 | 3.8 | 1,053 | 4.3 | 5,148 | 21.2 |
| 2021–22 | 28,929 | 17,392 | 60.1 | 1,209 | 4.2 | 1,601 | 5.5 | 6,723 | 23.2 |
| 2022–23 | 33,361 | 20,378 | 61.1 | 1,471 | 4.4 | 2,295 | 6.9 | 8,960 | 26.9 |
- The share of women among new hires increased from 57.7% in 2016–17 to 61.1% in 2022–23.
- The share of hires for persons with disabilities almost doubled from 3.7% in 2016–17 to 6.9% in 2022–23.
- The share of new hires among members of visible minorities increased from 17.9% in 2016–17 to 26.9% in 2022–23.
- The share of hires of Indigenous Peoples fluctuated between 3.8% and 4.4% between 2016–17 and 2022–23.
| Fiscal year | All employees | Women | Indigenous Peoples | Persons with disabilities | Members of visible minorities | ||||
|---|---|---|---|---|---|---|---|---|---|
| Number | % of promotions |
Number | % of promotions |
Number | % of promotions |
Number | % of promotions |
||
| 2016–17 | 17,487 | 10,120 | 57.9 | 836 | 4.8 | 693 | 4.0 | 2,788 | 15.9 |
| 2017–18 | 20,660 | 12,260 | 59.3 | 1,015 | 4.9 | 837 | 4.1 | 3,560 | 17.2 |
| 2018–19 | 25,489 | 15,390 | 60.4 | 1,217 | 4.8 | 1,097 | 4.3 | 4,770 | 18.7 |
| 2019–20 | 27,211 | 16,628 | 61.1 | 1,332 | 4.9 | 1,133 | 4.2 | 5,405 | 19.9 |
| 2020–21 | 24,919 | 15,106 | 60.6 | 1,223 | 4.9 | 1,181 | 4.7 | 5,227 | 21.0 |
| 2021–22 | 29,295 | 18,256 | 62.3 | 1,493 | 5.1 | 1,681 | 5.7 | 6,818 | 23.3 |
| 2022–23 | 33,194 | 20,975 | 63.2 | 1,698 | 5.1 | 2,230 | 6.7 | 8,024 | 24.2 |
The data reveals an increase in the number of promotions for all four employment equity groups since 2016–17, especially among women and members of visible minorities. The percentage point increase in the share of promotions for women and members of visible minorities is higher compared to Indigenous Peoples and persons with disabilities.
| Fiscal year | All employees | Women | Indigenous Peoples | Persons with disabilities | Members of visible minorities | ||||
|---|---|---|---|---|---|---|---|---|---|
| Number | % of separations |
Number | % of separations |
Number | % of separations |
Number | % of separations |
||
| 2016–17 | 12,491 | 7,249 | 58.0 | 602 | 4.8 | 902 | 7.2 | 1,490 | 11.9 |
| 2017–18 | 12,937 | 7,349 | 56.8 | 685 | 5.3 | 994 | 7.7 | 1,310 | 10.1 |
| 2018–19 | 12,898 | 7,381 | 57.2 | 655 | 5.1 | 850 | 6.6 | 1,260 | 9.8 |
| 2019–20 | 13,043 | 7,459 | 57.2 | 697 | 5.3 | 931 | 7.1 | 1,371 | 10.5 |
| 2020–21 | 12,446 | 6,996 | 56.2 | 590 | 4.7 | 841 | 6.8 | 1,354 | 10.9 |
| 2021–22 | 16,687 | 9,443 | 56.6 | 850 | 5.1 | 1,097 | 6.6 | 2,033 | 12.2 |
| 2022–23 | 17,510 | 9,835 | 56.2 | 897 | 5.1 | 1,202 | 6.9 | 2,478 | 14.2 |
The share of separations for women and persons with disabilities declined when comparing 2016–17 to 2022–23; for Indigenous Peoples and members of visible minorities, the share of separations fluctuated but increased overall.
| Occupational group | Women | Indigenous Peoples | Persons with disabilities | Members of visible minorities |
|---|---|---|---|---|
| PA: Program and Administrative Services | 72.4% [-0.2] | 6.4% [0.0] | 8.1% [+0.7] | 22.8% [+1.8] |
| EC: Economics and Social Science Services | 59.8% [+0.6] | 4.2% [+0.1] | 8.1% [+1.1] | 27.9% [+1.9] |
| IT: Information Technology | 22.5% [-0.2] | 3.4% [+0.1] | 6.8% [+0.4] | 26.6% [+1.1] |
| TC: Technical Services | 32.9% [+0.6] | 4.9% [-0.1] | 4.7% [+0.4] | 12.7% [+0.5] |
| SV: Operational Services | 21.2% [-0.1] | 5.3% [0.0] | 3.9% [-0.1] | 5.8% [+0.3] |
The largest occupational group in the CPA is in the Program and Administrative Services (PA) group, followed by the Economics and Social Science Services (EC) and the Information Technology (IT) groups. Compared with the previous fiscal year, representation rates in these groups for women, Indigenous Peoples and persons with disabilities differed by less than 1 percentage point except for the EC group for persons with disabilities, which saw a 1.1 percentage point change. The representation rates for members of visible minorities increased in all five of these groups, with the most substantial changes in the EC group, with an increase of 1.9 percentage points, followed by the PA group, with an increase of 1.8 percentage points.
Representation in the executive ranks
Overall, three of the four employment equity designated groups are above their WFA in the executive ranks.
Core public administration representation and workforce availability in the executive ranks
| Representation | WFA | |
|---|---|---|
| Women | 54.2% [+1.0] | 48.0% Met |
| Indigenous Peoples | 5.2% [+0.3] | 5.4% Not met |
| Persons with disabilities | 7.7% [+1.2] | 5.3% Met |
| Members of visible minorities | 15.2% [+1.2] | 10.8% Met |
| Executive level | All employees | Member of at least one EEtable 8 note * group | % of EX level |
|---|---|---|---|
| EX-01 | 3,935 | 2,689 | 68.3 |
| EX-02 | 1,986 | 1,245 | 62.7 |
| EX-03 | 1,323 | 824 | 62.3 |
| EX-04 | 269 | 167 | 62.1 |
| EX-05 | 130 | 73 | 56.2 |
| Total | 7,643 | 4,998 | 65.4 |
Notes
|
|||
| Executive level | All employees | Women | Indigenous Peoples | Persons with disabilities | Members of visible minorities | ||||||||
|---|---|---|---|---|---|---|---|---|---|---|---|---|---|
| Number | % of EX Level | % of EEtable 9 note * group | Number | % of EX Level | % of EEtable 9 note * group | Number | % of EX Level | % of EEtable 9 note * group | Number | % of EX Level | % of EEtable 9 note * group | ||
| EX-01 | 3,935 | 2,226 | 56.6 | 53.8 | 230 | 5.8 | 57.9 | 320 | 8.1 | 54.6 | 637 | 16.2 | 54.7 |
| EX-02 | 1,986 | 1,029 | 51.8 | 24.9 | 92 | 4.6 | 23.2 | 151 | 7.6 | 25.8 | 288 | 14.5 | 24.7 |
| EX-03 | 1,323 | 684 | 51.7 | 16.5 | 56 | 4.2 | 14.1 | 94 | 7.1 | 16.0 | 184 | 13.9 | 15.8 |
| EX-04 | 269 | 139 | 51.7 | 3.4 | 13 | 4.8 | 3.3 | 14 | 5.2 | 2.4 | 41 | 15.2 | 3.5 |
| EX-05 | 130 | 61 | 46.9 | 1.5 | 6 | 4.6 | 1.5 | 7 | 5.4 | 1.2 | 15 | 11.5 | 1.3 |
| Total | 7,643 | 4,139 | 54.2 | 100.0 | 397 | 5.2 | 100.0 | 586 | 7.7 | 100.0 | 1,165 | 15.2 | 100.0 |
Notes
|
|||||||||||||
When considering the total number of employees in the executive category (7,643), members of the designated groups account for 65.4% of the executive workforce:
- women represent more than half of the overall total of executives at 54.2%, with their representation ranging from 56.6% at the EX‑01 level and decreasing to 46.9% at the EX‑05 level
- members of visible minorities account for 15.2% of the executive group, persons with disabilities account for 7.7% and Indigenous Peoples account for 5.2%
It is worth noting that the percentage of designated group members is more prominent in the EX‑01 and EX‑02 levels but decreases in the levels that progress to EX‑05.
| Women | Indigenous Peoples | Persons with disabilities | Members of visible minorities | |
|---|---|---|---|---|
| Hires | 52.3% [-4.3] | 6.8% [+0.2] | 11.4% [+4.0] | 15.2% [-2.0] |
| Promotions | 59.4% [+1.3] | 6.3% [+0.4] | 9.1% [+2.3] | 17.9% [-1.2] |
| Separations | 51.1% [+4.3] | 4.1% [-0.1] | 11.0% [+3.6] | 10.9% [+1.1] |
Among the 132 new executive hiresFootnote 6 in 2022–23, women had the largest share at 52.3%, followed by members of visible minorities, persons with disabilities and Indigenous Peoples. The same trend is observed for promotions. There were 1,247 EX promotions in 2022–23.Footnote 7 Women had the largest share of separations, followed by persons with disabilities, members of visible minorities and Indigenous Peoples.
Compared to last fiscal year:
- women had a decrease in the share of executive hires of 4.3 percentage points and an increase in the share of separations of 4.3 percentage points
- persons with disabilities had a 4.0 percentage point increase in the share of hires and a 3.6 percentage point increase in the share of separations
Public service–wide initiatives on diversity and inclusion: five areas of focus
1. Generate and publish data for a more accurate picture of representation gaps
Creating a representative and inclusive workplace that reflects the population it serves begins with improving the availability and reliability of existing data.
TBS’s Office of the Chief Human Resources Officer (OCHRO) has continued to enhance the dissemination of disaggregated data:
- executive workforce statistics are now available by level through the Human resources statistics website
- employment equity representation data for CPA executives is also now available through the Diversity and inclusion statistics website
Since the first release of disaggregated data in September 2020, OCHRO has continued to update the information and expand the breakdowns available. For example:
- public service–wide employment equity representation data is available by:
- province or territory of work
- occupational group in force
- occupational category
- executives by level
- salary range
- age range
- tenure
- language requirement of the position
- linguistic status of incumbents
- level of second language proficiency
- first official language
- Further disaggregated representation data for Indigenous Peoples, persons with disabilities and members of visible minorities is available by:
- department or agency
- province or territory of work
- occupational group in force
- occupational category
- salary range
- age range
- tenure
WFA estimates were incorporated into OCHRO’s Human resources data visualization tool, giving the public access to estimates for the CPA population and executives by organization. As a result of changes to the Public Service Employment Act, WFA estimates have expanded beyond Canadian citizens to include permanent residents.
TBS’s Self-Identification Modernization Project will allow for measurement and analysis of public service employee representation beyond the four employment equity designated groups by including more identities and by being centrally hosted on the TBS Application Portal.
In 2022–23, OCHRO continued to develop a new Self-ID Questionnaire with updated language and expanded identity options informed by a series of consultations with equity-seeking groups and stakeholders. Objectives of the project include enabling TBS and departments to meet legislative requirements of the Employment Equity Act and support the public service to provide an inclusive workplace and a greater sense of belonging for employees. The new self-ID application is anticipated to launch in 2024.
In collaboration with Statistics Canada, the 2022–23 Public Service Employee Survey (PSES) collected important employee sentiment data and gathered insight on how equity-seeking groups were experiencing their workplace. As the largest universal collection of employee sentiment data in the public service, the PSES is invaluable to supporting evidence-based decision-making within departments, agencies and policy centres that shape programs enterprise-wide. The 2022–23 PSES was in collection from November 2022 to February 2023, with 91 participating organizations and a 53.4% response rate. Of interest are the following:
- 49% responded positively that the Clerk’s Call to Action on Anti-Racism, Equity, and Inclusion in the Federal Public Service had a positive impact in their organization (for women, the figure was 53%; for racialized groups, the figure was 55%).
- More than four out of five employees feel that their organization treats them with respect, and three out of four employees feel that their organization respects individual differences.
- Overall, on questions about how employees feel toward whether their organization treats them with respect, respects individual differences, and whether the Call to Action on Anti-Racism, Equity, and Inclusion in the Federal Public Service has had a positive impact in their organization, employees who identify as persons with disabilities and Indigenous Peoples are less positive than the overall public service response. Employees who identify as members of a racialized group or as women are generally more positive in their response to these questions than the overall public service population.
- Generally, results for employees who identified as being part of the 2SLGBTQIA+ community are less positive than the rest of the public service. For example, 80% of employees who identify as 2SLGBTQIA+ compared to 82% of employees who do not identify as 2SLGBTQIA+ felt that every employee in their work unit is accepted as an equal member. Further information is available at the 2022 results for 2SLGBTQIA+ communities.
The most recent PSES adopted an early version of the new Self-ID Questionnaire, which allowed employees to self-identify based on their gender, racial group, ethnic origin, 2SLGBTQIA+ identity, Indigenous identity, and as a person with disabilities. The same questions were used in the collection of the Student Experience Survey, which supports interoperability of the results with the PSES data and allows for insight on how students belonging to one or more of the equity-seeking groups are experiencing the workplace in comparison to the broader public service. By using the new Self-ID Questionnaire as the standard, these insights can be integrated with other sources of administrative data available to:
- conduct deeper analysis
- identify trends
- bring into focus the data story of employees
The Public Service Commission of Canada (PSC) continues to maintain a collection of online visualization and forecasting tools. A publicly available interactive Data visualization hub is updated regularly, providing users with easy access to PSC data about the staffing system, including information on employment equity data for departments and agencies subject to the PSEA. The PSC makes annual projections on renewal and representation in the public service using a workforce macro-simulation tool that can, for example, inform recruitment efforts to meet the federal goal of 5,000 net new hires of persons with disabilities and share projections with deputy heads and heads of human resources.
2. Increase the diversity of senior leaders of the public service
Government-wide priorities
Increasing diversity among senior leaders of the public service is key to establishing a culture of inclusiveness that will help combat racism and address systemic barriers. It also strengthens policy advice, programs and service delivery.
OCHRO continues to enable a senior leadership group that models and reflects a culture of inclusion. For many years, Clerks of the Privy Council have expected senior leaders to foster diversity and inclusion in the public service, and this expectation was reflected in the annual government-wide priorities. TBS requires all executives in the CPA to include these priorities and associated performance measures in their performance agreement commitments.
Executives’ success in meeting these expectations is part of their annual performance assessment.
Black and Indigenous executives
In 2021–22, OCHRO developed tailored strategies to increase representation and reduce barriers for Black and Indigenous executives. In 2022–23:
- a performance assessment framework was launched in partnership with executive diversity networks to measure progress and enable transparent and consistent monitoring of these strategies
- a needs analysis was launched to support the empirically based development of a third strategy tailored to executives who have lived experience of disability
Deputy Head Inclusion Stewards
OCHRO is actively working to increase the diversity of senior leaders and address biases and barriers in executive talent management:
- As part of the winter 2022–23 assistant deputy minister (ADM) talent management cycle, time was specifically set aside to discuss all ADMs who self-identified as a member of an employment equity group. The aim was to make them more visible and support their development.
- In addition, in support of inclusion, Deputy Head Inclusion Stewards were designated to recognize and address unconscious bias. Guidance and tools for the Inclusion Steward initiative were expanded and widely shared with departments to voluntarily implement these tools for executive and non-executive programs, such as talent and performance management at the organizational level.
Executive Leadership Development Program
The Executive Leadership Development Program (ELDP) continues to play a significant role in promoting diversity and inclusion among senior leaders:
- Through the Canada School of Public Service (CSPS), the program provides tailored learning and development opportunities for equity-seeking executives and has adopted culturally sensitive learning frameworks. The program aims to allocate at least 50% of its participants in the EX‑01 to EX‑03 cohort to Indigenous Peoples, members of visible minorities, and persons with disabilities. In 2022–23, OCHRO continued to enhance diversity in the EX‑01 to EX‑03 and ADM ELDP streams, with an average of 60% of participants identifying as members of equity-seeking groups.
- Other initiatives have been undertaken to increase Indigenous Peoples’ participation in the executive cohorts in response to persistent low participant rates. Information sessions were held for the Indigenous Senior Leadership Circle and the Indigenous Executive Network to raise awareness and encourage nominations. Information gathered at these meetings was shared with program partners, the CSPS and the PSC to make the necessary adjustments to programming. As a result, there has been an increase in the representation of these groups within program cohorts as follows (see table below):
- the representation of Indigenous executives in the EX‑01 to EX‑03 stream increased from 6% in 2020 to 9% in 2023 and from 2% in 2020 to 9% in 2023 for the ADM stream
- the representation of persons with disabilities increased from 7% to 13% for the EX‑01 to EX‑03 stream and from 0% to 2% for the ADM stream between 2020 and 2023
- the representation of members of visible minorities in the EX‑01 to EX‑03 stream increased from 15% in 2020 to 39% in 2023 and from 6% in 2020 to 29% in 2023 for the ADM stream
| Year | Indigenous Peoples | Persons with disabilities | Members of visible minorities | |||
|---|---|---|---|---|---|---|
| EX‑01 to EX‑03 | ADM (EX‑04 and EX‑05) stream | EX‑01 to EX‑03 | ADM (EX‑04 and EX‑05) stream | EX‑01 to EX‑03 | ADM (EX‑04 and EX‑05) stream | |
| 2020 | 6% | 2% | 7% | 0% | 15% | 6% |
| 2023 | 9% | 9% | 13% | 2% | 39% | 29% |
Mosaic Leadership Development Program
The Mosaic Leadership Development Program provides equity-seeking employees from under-represented communities with opportunities to overcome barriers and enter the executive group. It has four main components:
- sponsorship
- a multi-dimensional learning curriculum
- experience-building opportunities
- assessment by a diverse selection board against an EX‑01 position identified by the organization
The first cohort of the program graduated in March 2023, with 38 diverse participants.
Mentorship Plus
The Mentorship Plus program supports the career progression of public service employees in under-represented and equity-seeking groups through traditional mentorship and sponsorship. In this program, a senior leader supports their protégé by advocating for them and actively participating in their career development. This support includes helping protégés gain the skills and competencies needed to move into executive positions.
In 2022–23, the program had been implemented in 52 organizations across the public service, including the CSPS, which hosts the Centralized Bank of Sponsors that offers sponsors to 40 departments and agencies.
Knowledge Circle for Indigenous Inclusion and Indigenous Coaching and Counseling Circle
Many Voices One Mind: A Pathway to Reconciliation Action Plan is the main strategy for Indigenous inclusion. It identified onboarding, retention, career development and advancement as systemic barriers to Indigenous employment.
In partnership with the Knowledge Circle for Indigenous Inclusion, the PSC created the Indigenous Coaching and Counseling Circle (ICCC) to:
- offer coaching and counselling services from a culturally competent group of Indigenous coaches to support aspiring Indigenous executives
- provide Indigenous executives with a way to reduce and potentially eliminate systemic barriers related to securing approval for coaching opportunities
In the ICCC’s first three months, the five ICCC coaches supported 17 employees. Due to the ICCC’s positive feedback and an increasing demand for coaches, the Knowledge Circle for Indigenous Inclusion will continue to offer this service in 2023–24.
3. Ensuring the right benchmarks
Employment equity benchmarks are reference points for employers to assess how they measure in terms of representation for each of the four employment equity designated groups. These benchmarks are used to guide the development of strategies that will strengthen diverse representation in the public service.
In the CPA, the benchmark used is workforce availability (WFA), which relies on:
- Employment and Social Development Canada’s (ESDC’s) labour market availability data
- Statistics Canada’s (StatCan’s) Census and Canadian Survey on Disability data
OCHRO acknowledges the recent benchmarking recommendations of the Employment Equity Act Review Task Force and commits to rethinking new approaches as part of anticipated consultations and developments led by ESDC and StatCan.
“Keeping it simple: Moving beyond workforce availability toward labour market availability and comprehensive barrier removal.”
4. Addressing systemic barriers
Systemic barriersFootnote 8 arise from systems, policies and practices, traditions or cultural practices that may seem neutral but put certain individuals or groups at a disadvantage. Following are examples of various initiatives undertaken in 2022–23 to address systemic barriers.
Qualification Standards
In 2022–23, OCHRO’s Classification Program increased the accessibility of tools used to determine job classifications and reduced bias in these tools.
The Qualification Standards outline the minimum requirements needed for each occupational group or classification in the CPA. OCHRO consulted with partners and organizations to identify and address potential biases and barriers in these standards. OCHRO developed a checklist to identify possible biases and barriers when creating or reviewing qualification standards. The checklist helps find and remove requirements that could create biases and barriers for members of equity-seeking groups. This project follows an amendment to the Public Service Employment Act, which requires employers to:
- evaluate qualification standards for biases or barriers when they are created or reviewed
- make reasonable efforts to remove them or mitigate the impact of biases or barriers
Recommendations of the Audit of Employment Equity Representation in Recruitment
The PSC continued to implement the recommendations from the Audit of Employment Equity Representation in Recruitment to help identify and eliminate potential barriers and biases in appointment processes and provided updated guidance. In 2022–23, 13 out of 14 PSC deliverables for the audit were closed, and 87% of organizations reported having initiated a review of their staffing frameworks and practices. Some of the concrete actions taken include:
- publishing a new Employment Systems Review: A Guide for the Federal Public Service
- implementing mandatory training on unconscious bias for staffing sub-delegation, as of April 1, 2022, supported by the CSPS course “Inclusive Hiring Practices for a Diverse Workforce”
- publishing Spotlight on diverse assessment boards
- strengthening employment equity obligations for deputy heads to ensure barrier-free appointment processes for employment equity groups
- expanding the Assessment Accessibility Ambassadors Network (accessible only on the Government of Canada network) to help the human resources community improve accommodation when assessing candidates
The Canadian Human Rights Commission continues work on an employment equity horizontal audit of how racialized people are employed in management and executive positions in the public service. The Commission also initiated conventional “employer-based” audits for selected departments and agencies that have not been audited for the past six years. The Commission will continue with its three-pronged approach to audits to make equality of opportunity a substantive reality in federally regulated workplaces:
- conventional employer-based audits
- horizontal issue-based audits
- blitz requirement-based audits
2SLGBTQI+ Action Plan
In August 2022, the Government of Canada launched Canada’s first Federal 2SLGBTQI+ Action Plan 2022, which seeks to advance equality for 2SLGBTQI+ people in Canada and within the public service. The $100-million Action Plan was created through extensive engagement, including:
- a national crowd-sourced survey
- written submissions
- roundtable discussions
The goal of the action plan is to stop discrimination and stigma based on sexual orientation, sex characteristics, gender identity and expression from emerging or worsening for future 2SLGBTQI+ generations.
TBS Official Languages Centre of Excellence
To better align official languages priorities with diversity and inclusion goals, TBS’s Official Languages Centre of Excellence has undertaken the following initiatives:
- After extensive consultations with key stakeholders, including equity-seeking networks, the Centre started the development of a new inclusive language training framework and established an advisory committee on second official language learning whose members include representatives of equity-seeking networks.
- In collaboration with the Public Service Alliance of Canada, a joint Report on the Use of Indigenous Languages in Canada’s Public Service was published in July 2023, which:
- reviewed the use of Indigenous languages in the public service
- examined Indigenous language skills in the performance of employees’ duties
- examined the advantages that Indigenous language speakers bring to the public service
- In February 2023, TBS, Canadian Heritage, the Council of the Network of Official Languages Champions, in collaboration with the CSPS, held a Best Practices Forum on Official Languages on the theme “Changing the Narrative on Diversity, Inclusion and Official Languages” to share practices on how official languages can be used to promote bilingualism, diversity and inclusion in Canada.
Public Service Commission of Canada
The PSC provided expertise in policy development, application and interpretation regarding official languages in the appointment process, including examining the use of the Public Service Official Languages Exclusion Approval Order and Public Service Official Languages Appointment Regulations and helping organizations apply the terms and conditions of each. The PSC also provided testing for second official language proficiency.
In 2022–23, the PSC:
- reviewed and published guidance regarding official languages medical exclusions
- published frequently asked questions on exclusions from meeting official languages proficiency
- streamlined the following forms:
- Statement of Agreement to Become Bilingual
- Request for Exclusion on Medical Grounds
In October 2022, the PSC launched the Candidate Assessment Tool for second language evaluations. The tool allows departments and agencies to conduct remote, unsupervised second language tests for reading comprehension and written expression. The tool’s interface is now more accessible, modern and adaptable, and users can change the display settings to suit their needs.
The PSC:
- administers and oversees the provisions of the PSEA and the Public Service Employment Regulations regarding priority entitlements
- monitors staffing practices in relation to the legislative framework for priorities
Entitlements are provided for people who meet specific conditions, allowing them to be appointed before others to vacant positions in the public service.
The Priority Entitlements Program reviews its practices and procedures to remove systemic barriers that people in designated groups who have a priority entitlement might face when searching for jobs. In 2022–23, the program introduced the Priority Information Management System and communications tools.
Student employment
The Student Employment Programs Participants Regulations and the Treasury Board Policy on People Management (which governs the Directive on Student Employment) were amended in June 2021 to include students who are permanent residents with a preference for appointment that is equal to those who are Canadian citizens. This change applies to approved student employment programs for appointment processes that commenced on or after June 24, 2022.
Maturity Model on Diversity and Inclusion
OCHRO’s Maturity Model on Diversity and Inclusion is a voluntary self-assessment tool launched in August 2022 that enables federal organizations to learn their level of advancement in diversity and inclusion. Organizations submit their responses to a 22-question questionnaire and receive:
- a report that indicates their level of maturity across five dimensions
- tailored recommendations on how to progress to the next level
The model informs organizations how diverse and inclusive they are and recommends tangible actions for improvement.
Observer Program
In line with the Government of Canada’s commitment to foster diversity and inclusion on boards and committees, TBS has responded to the 50 – 30 Challenge.Footnote 9 For example, the Observer Program helps reduce barriers by providing senior public service employees in under-represented and equity-seeking groups with opportunities to participate as non-voting members on public sector pension and benefits plans boards and committees. Through this program:
- participants acquire important board and committee experience while developing in-depth knowledge related to the governance and oversight of these pension and benefits plans
- this participation provides the employer with a larger and more diverse pool of potential employer representative candidates for future appointments
Of the nine candidates in the first cohort of the program, three have already been appointed to serve as employer representatives. In 2022, the scope of the program was expanded to allow for more participants and those who will be completing their participation period later in 2024.
5. Engagement and awareness
Employment Equity Research Working Group
In 2022–23, the PSC’s diversity and inclusion research and data work focused on several initiatives, including chairing an interdepartmental Employment Equity Research Working Group to inform work undertaken on employment equity, diversity and inclusion. This working group consists of experts in the field of employment equity, economists and statisticians who share information and research on barriers for employment equity groups.
In addition, the PSC conducted analysis on specific priority topics related to employment equity and diversity in the staffing system that included:
- publishing two thematic reports on the perceptions of federal public servants with disabilities and the perceptions of federal public servants who are members of an employment equity group, based on results from the Staffing and Non-Partisanship Survey 2021
- updating reports on separation trends for designated employment equity groups (from the Public Service Employment Act), non-advertised appointments by employment equity designated group, and the citizenship of applicants and external appointments
- the employment equity promotion rate study
GC Jobs Transformation
Other PSC programs include the GC Jobs Transformation to modernize the Government of Canada recruitment platform to offer a seamless and intuitive experience for job seekers, hiring managers and human resource professionals alike.
Post-secondary recruitment
The Post-Secondary Recruitment program provides recent graduates with access to public service jobs. The 2022 campaign opened in November 2022 and focused on recruiting entry-level Data Scientists (EC).
Federal Speakers’ Forum on Lived Experience
The Federal Speakers’ Forum on Lived Experience, led by OCHRO, has combined the services of the former Federal Speakers’ Forum on Diversity and Inclusion and the Federal Speakers’ Bureau on Mental Health. The forum aims to build a community of speakers who share lived experiences related to mental health, accessibility, diversity and inclusion. By sharing ideas and building connections, the Forum aims to open hearts and minds to inspire action toward a more inclusive workplace. By the end of 2022–23, 86 speakers were successfully matched to over 275 speaking engagements across the public service.
Canada School of Public Service
The Canada School of Public Service (CSPS) made extensive efforts to create an inclusive and equitable workplace by providing learning opportunities and products to develop knowledge, skills and competencies necessary to change mindsets and behaviours for greater reconciliation, equity, diversity and inclusion. In 2022–23, the CSPS offered:
- the “Positive Space Initiative: 2SLGBTQI+ Awareness” course
- “Becoming an Ambassador for 2SLGBTQI+ Inclusion” course
- a new resource for Positive Space facilitators
- an event on LGBTQ2+ inclusion titled “Being Your Authentic Self at Work”
- a new 2SLGBTQIA+ Inclusion Learning Path to encourage public service pride and inclusive workplaces, which includes the documentary video, The Fruit Machine
The CSPS’s mental health curriculum had significant modifications that included personal stories, experiences and recommendations from public servants belonging to employment equity groups. For example, the CSPS launched a pilot of an updated mental health awareness course that includes case studies, scenarios and personas that reflect the impact of racism and discrimination on mental health.
The CSPS hosted the Government of Canada Equity, Diversity and Inclusion Conference 2022 under Inaugural Visiting Scholar, Dr. Rachel Zellars, to emphasize the learning tools, strategies and achievements in response to the Clerk’s Call to Action on Anti-Racism, Equity, and Inclusion in the Federal Public Service.
The Leadership Series event, “Embodied Leadership for Anti-Racism, Equity and Inclusion,” was particularly well received.
Another successful achievement was the Jocelyne Bourgon Visiting Scholar Lecture: “The Time is Now for Black Canadians in the Public Service,” where public servants learned about the evolution of merit criteria and its impact on Black employees.
The CSPS also held events in support of:
- Asian Heritage Month 2022: “Celebrating Innovation and Perseverance”
- Islamic Heritage Month 2022: “Celebrating Muslim Leaders in Canada’s Federal Public Service”
In collaboration with the Federal Black Employee Caucus and the Black Executive Network, the CSPS held events on addressing anti-Black racism as part of its “Addressing Employment Barriers Faced by Black People in the Public Service” series, including:
- “Career Advancement”
- “Meaningful Retention”
CSPS updated three online courses on workplace harassment and violence prevention for employees, managers, health and safety committees, and designated recipients. Updates were also made to:
Human Resources Council
As the voice of the human resources (HR) community across the federal public service, the Human Resources Council (HRC) works collaboratively with all members of the HR community to build capacities and strengthen connections.
In 2022–23, the HRC offered many opportunities, including monthly Heads of HR meetings, to engage and mobilize central agency partners and better equip the community in leading excellence in human resources across the federal public service. With a focus on inclusion, the HRC conducted many successful engagements and initiatives that focused on equity, diversity, inclusion and accessibility, including:
- delivering a “smartshop” in partnership with the PSC to:
- highlight changes to the PSEA on assessment processes
- identify and mitigate the impact of potential biases and barriers in assessment for HR professionals
- publishing a newsletter focused on accessibility in the public service, with topics that included:
- accessibility by design
- accessibility tips and tricks
- reporting on the HRC’s community survey on best practices in accessibility
- publishing a spotlight piece on the Disability Inclusion and Workplace Accommodation Community of Practice, which brings together professionals from human resources and other fields that work in disability management, the duty to accommodate and accessibility within their organizations
- engaging directly with heads of HR at special HRC meetings to gather input for the review of the Employment Equity Act and changes to self-identification process across the public service
- welcoming guest speaker Tareq Hadhad to the annual HR Leadership Awards Ceremony to share with the HR community his journey on resiliency, leadership through adversity, diversity and inclusion
In 2022–23, the HRC also launched two key foundational pieces:
- HRC’s Strategic Plan and Vision 2025
- a community GCXchange site
The strategic plan established the vision for the community with one of its pillars as inclusion, in which the HRC committed to:
- promoting a culture of inclusiveness that values diversity, including linguistic diversity, and accessibility
- addressing systemic barriers and racism
The HRC GCXchange has allowed HRC to advance on this commitment by consolidating and sharing important information for HR professionals. In addition to the HRC GCXchange’s extensive resources centre, there are many tools that were developed to assist the career development of HR professionals through the new “helloHR” platform, including the PE competency development framework and the related competency profile tool.
Joint Employment Equity Committee
The Joint Employment Equity Committee is an ongoing advisory committee through which employment equity, diversity and inclusion policy, programs and initiatives are discussed among employees’ representatives of bargaining agents, departments, the Public Service Commission of Canada, and TBS’s Office of the Chief Human Resources Officer. The committee’s consultations with TBS in 2022–23 have included the following:
- artificial intelligence decision-making
- Employment Equity in the Public Service of Canada for Fiscal Year 2021 to 2022
- Public Service Employee Survey results
- modernization of the Self-ID Questionnaire
- 2022–23 Management Accountability Framework results on equity, diversity, inclusion and accessibility
- accessibility action plans from the Office of Public Service Accessibility
- results from the public opinion survey of federal public servants with disabilities
- Government of Canada Workplace Accessibility Passport
Final word
Over the course of three decades, the public service has made significant strides in increasing the representation of the four employment equity designated groups. Substantial gaps persist, however, particularly regarding persons with disabilities.Footnote 10
Despite the Government of Canada mandated direction to hire 5,000 new public servants with disabilities by 2025, the representation of persons with disabilities remains low at 6.9% while their workforce availability is 9.2%. Efforts in internship programs and tailored recruitment initiatives need to continue in pursuing this hiring target. However, employment equity does not end with the successful recruitment or promotion of persons with disabilities. To retain employees with disabilities, the Government of Canada should continue to prioritize the development of a disability-inclusive work culture.
When compared with the CPA, data on salary ranges show that the proportion of the four employment equity groups is higher in the $50,000 to $74,999 range and lower in the ranges of $100,000 and above. When combined with other factors such as the increased number of hires and promotions among the four designated employment equity groups and the increase in representation in all designated groups, including at the executive levels, this data could signal that our ongoing commitment to supporting employment equity groups in the public service has yielded tangible progress. Further analysis is required to determine why the salary disparity between the employment equity groups and the CPA exists. The above-noted initiatives aim to address systemic barriers to career advancement and discrimination. Other factors such as successful entry-level targeted recruitment programs could also play a part.
Black employees’ representation has continued to increase since last fiscal year. While positive trends in hires and promotions are apparent, when compared with the other employment equity groups, the proportion of Black employees continues to be the highest in the $50,000 to $74,999 salary range and lowest in all other salary ranges of $75,000 and over. In June 2023, TBS established the Task Force for Black Public Servants to oversee the development and implementation of the Action Plan for Black Public Servants, which carried on the work begun in consultation with Black Public Servants and networks in 2022 to advance the government’s efforts in support of Black public servants.
Currently, there are no requirements to collect and report on the representation of 2SLGBTQI+ employees, and as such, there is no representation data on this group. TBS will lead effortsFootnote 11 to further 2SLGBTQI+ diversity and inclusion by ensuring that the Centre for Diversity and Inclusion’s future initiatives are informed by 2SLGBTQI+ federal employee networks, stakeholders and the Federal 2SLGBTQI+ Action Plan 2022. TBS will be well positioned to commence data collection in 2024 with the launch of a modernized approach to self-identification.
As the public service looks into the future, key drivers will include:
- recommendations from the Task Force on the Employment Equity Act Review
- the Clerk’s Call to Action on Anti-Racism, Equity, and Inclusion in the Federal Public Service
- the findings and recommendations of the Auditor General report on inclusion in the workplace for racialized employees
The Public Service Employee Survey also provides valuable insight that can help guide and develop policies and initiatives.
As well, the steps TBS is taking to develop a restorative engagement program for employees to share their personal accounts in a safe confidential space will contribute to organizational culture change.
About the data
Population covered
The statistical tables in this report’s Appendix present information as of March 31, 2023, or for fiscal year 2022–23, for indeterminate employees, term employees of three months or more, and seasonal employees of organizations listed in Schedules I and IV of the Financial Administration Act (the core public administration (CPA).
Notes on terms and data sources
- The source of representation data is the TBS Employment Equity Data Bank, which contains self-identification and self-declaration information (from the Public Service Resourcing System) provided by employees.
- The sum of designated groups does not equal the total (“all employees”) because employees may have voluntarily chosen to self-identify in more than one designated group, and men are included in the total.
- “Hires” refers to employees who were added to the public service of Canada payroll between April 1, 2022, and March 31, 2023.
- Data on promotions are obtained from the PSC and include information from departments and agencies that fall under both the Financial Administration Act, Schedules I and IV, and the Public Service Employment Act.
- “Separations” refers to employees who left the public service of Canada payroll between April 1, 2022, and March 31, 2023.
Workforce availability
Workforce availability (WFA) estimates are used as a benchmark to assess the representativeness of employment equity designated groups within the CPA (organizations listed in Schedules I and IV of the Financial Administration Act) in accordance with the Employment Equity Act. The dynamics of hiring depend on the availability of designated group members for public service employment. The WFA varies geographically (national or by province or territory) or by the specific qualifications that organizations must fill. Four filters are considered:
- citizenship: this filter is applied because the Public Service Employment Act gives preference to the hiring of Canadian citizens and, after June 29, 2021, permanent residents (section 39.1.c)
- classification: this filter narrows consideration to occupations that the government deems relevant to the public service
- education: this filter is used for some classifications to include only persons who have an educational degree for scientific and professional occupations, taking into account the public service qualification standards for jobs (educational requirements)
- geography: this filter assumes that most organizational hiring will be done locally for most occupational groups rather than from wider geographic areas
WFA estimates are derived from the Labour Market Availability, which is derived from the 2016 CensusFootnote 12 and the 2017 Canadian Survey on Disability, which is performed every five years. Changes to the Public Service Employment Act came into effect in June 2021, including broadening the preference given to Canadian citizens in external advertised appointment processes to include permanent residents. As a result, as of March 2022, WFA includes Canadian citizens and permanent residents active in the labour market who are at least 15 years of age and is based on occupations in the Canadian workforce corresponding to the occupations in the public service. Prior to March 2022, WFA only included Canadian citizens active in the labour market who were at least 15 years of age and was based on occupations in the Canadian workforce corresponding to the occupations in the public service.
Note on workforce availability for persons with disabilities and visible minorities
The estimate of the WFA for persons with disabilities increased significantly between Census 2011 and Census 2016 (because of the Canadian Survey on Disability), from 4.4% in 2014–15 to 9.0% in 2018–19. The reason is that the 2017 Canadian Survey on Disability expanded the definition of persons with disabilities to include persons with disabilities related to pain and mental health. As this more inclusive definition has not yet been incorporated into the public service voluntary reporting exercise, it is impossible to predict the impact this will have once incorporated. Since 2021–22, significant work was undertaken on modernizing the Self-Identification Questionnaire. A new version that incorporates an expanded definition of persons with disabilities is expected to launch in 2024.
It should be noted that the current WFA reflects the potential workforce of permanent residents because of the change made to the Public Service Employment Act (as of June 2021). This change requires that Canadian citizens and permanent residents be given a hiring preference over non-permanent residents for selection processes advertised to the public. The addition of permanent residents had the greatest impact on the workforce availability benchmark for members of visible minorities.
Self-identification
Internal representation for Indigenous Peoples, persons with disabilities and members of visible minorities is based on employees who have voluntarily chosen to self-identify or self-declare through a recruitment process as being part of at least one employment equity group. Information on the sex at birth of employees is taken from the Government of Canada’s pay system. Moving forward, the modernized Self-ID Questionnaire will capture data on gender that refers to social and personal identity and may be different from the person’s biological sex.
Part 2: Data and initiatives pertaining to specific groups
In this section
Women
Women working in the core public administration
The core public administration (CPA) population for employment equity purposes includes indeterminate employees, term employees of three months or more, and seasonal employees of organizations listed in Schedules I and IV of the Financial Administration Act. The CPA population is based on the effective classification which includes acting assignments. Employees on leave without pay, term employees less than three months, students and casual workers, Governor in Council appointees, Ministers’ exempt staff, federal judges, and deputy ministers are excluded.
Internal representation is based on those who have voluntarily chosen to self-identify and self-declare to date as an Indigenous person, a person with a disability and/or a person in a visible minority group, while sex information is taken from the pay system.
Workforce availability (WFA) is calculated based on the 2016 Census and the 2017 Canadian Survey on Disability.
Figures in square brackets represent the change since the previous year or fiscal year.
Core public administration
Women
| Representation | WFA | |
|---|---|---|
| Women | 56.6% [+0.6] | 53.7% Met |
| Women in the executive group | 54.2% [+1.0] | 48.0% Met |
As of March 2023, 56.6% of employees in the CPA were women. The number increased by 11,107 from the previous year. With a representation rate of 54.2% in executive positions, women remained above their WFA of 48.0%.
| Executive level | All employees | Number | % of EX level |
|---|---|---|---|
| EX-01 | 3,935 | 2,226 | 56.6 |
| EX-02 | 1,986 | 1,029 | 51.8 |
| EX-03 | 1,323 | 684 | 51.7 |
| EX-04 | 269 | 139 | 51.7 |
| EX-05 | 130 | 61 | 46.9 |
| Total | 7,643 | 4,139 | 54.2 |
At 54.2%, women made up more than half of the overall total of executives, with their representation ranging from 56.6% at the EX‑01 level and gradually decreasing to 46.9% at the EX‑05 level.
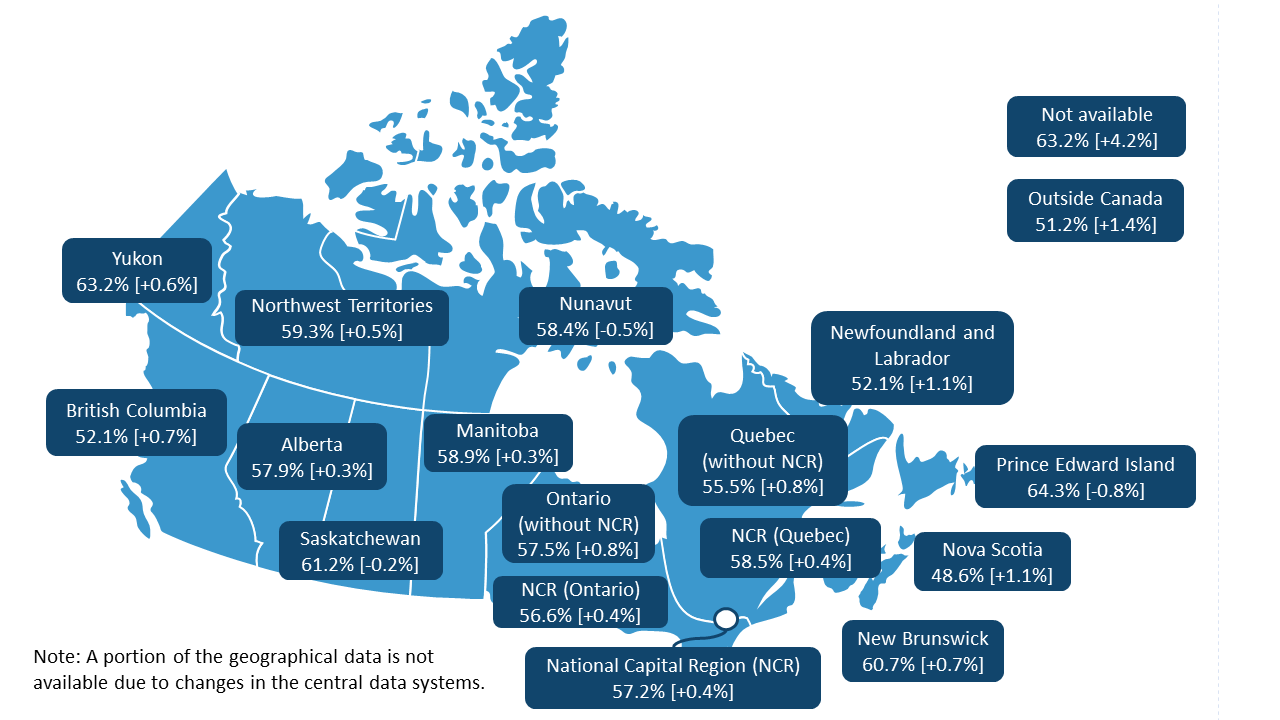
Figure 4 - Text version
Note: Figures in square brackets represent the change since March 2022.
Following are percentages by province, territory and other categories:
- Newfoundland and Labrador: 52.1% [increase of 1.1 percentage points]
- Prince Edward Island: 64.3% [decrease of 0.8 percentage points]
- Nova Scotia: 48.6% [increase of 1.1 percentage points]
- New Brunswick: 60.7% [increase of 0.7 percentage points]
- Quebec (without the National Capital Region): 55.5% [increase of 0.8 percentage points]
- National Capital Region (Quebec): 58.5% [increase of 0.4 percentage points]
- National Capital Region (Ontario): 56.6% [increase of 0.4 percentage points]
- National Capital Region: 57.2% [increase of 0.4 percentage points]
- Ontario (without the National Capital Region): 57.5% [increase of 0.8 percentage points]
- Manitoba: 58.9% [increase of 0.3 percentage points]
- Saskatchewan: 61.2% [decrease of 0.2 percentage points]
- Alberta: 57.9% [increase of 0.3 percentage points]
- British Columbia: 52.1% [increase of 0.7 percentage points]
- Yukon: 63.2% [increase of 0.6 percentage points]
- Northwest Territories: 59.3% [increase of 0.5 percentage points]
- Nunavut: 58.4% [decrease of 0.5 percentage points]
- Outside Canada: 51.2% [increase of 1.4 percentage points]
- Not available: 63.2% [increase of 4.2 percentage points]
Note: A portion of the geographic data is not available due to changes in the central data systems.
Although Prince Edward Island had the highest representation rate for women at 64.3%, it decreased by 0.8 percentage points since the previous year. Yukon at 63.2% and Saskatchewan at 61.2% had the highest representation rates after Prince Edward Island. The representation rate in Nunavut and Saskatchewan decreased since the previous year (0.5 percentage points and 0.2 percentage points, respectively).
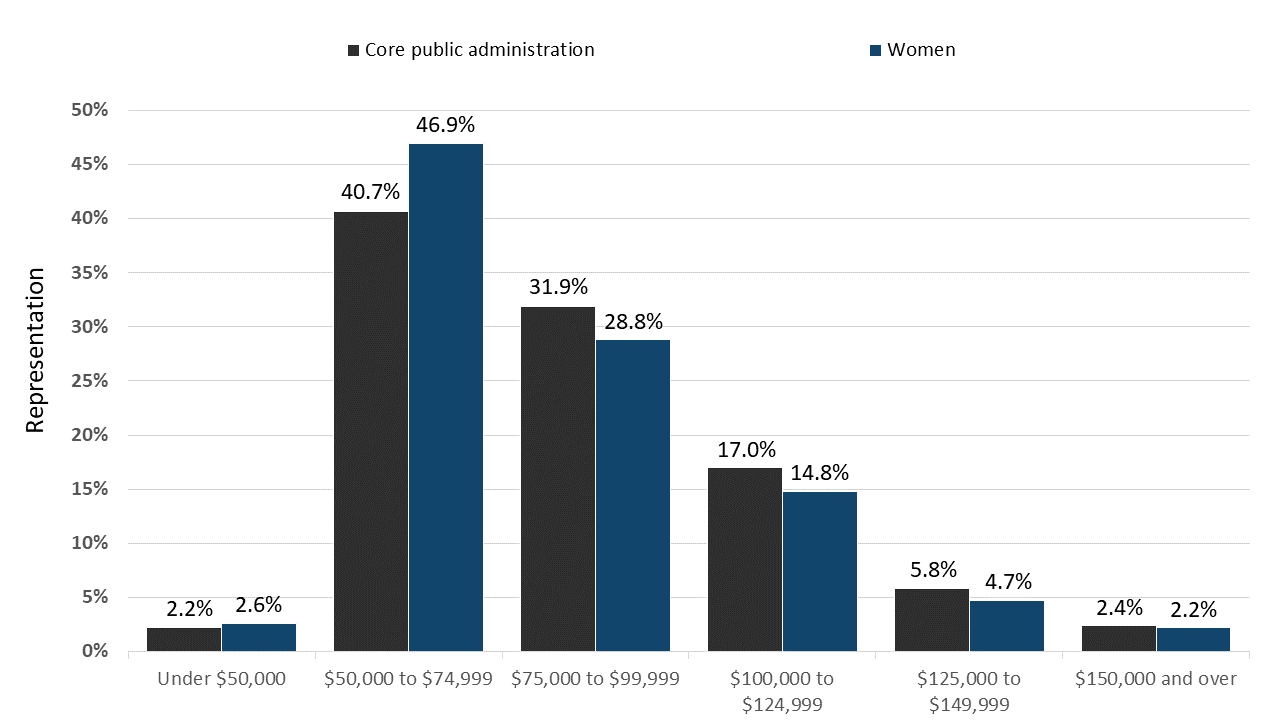
Figure 5 - Text version
| Salary range | Core public administration | Women |
|---|---|---|
| Under $50,000 | 2.2% | 2.6% |
| $50,000 to $74,999 | 40.7% | 46.9% |
| $75,000 to $99,999 | 31.9% | 28.8% |
| $100,000 to $124,999 | 17.0% | 14.8% |
| $125,000 to $149,999 | 5.8% | 4.7% |
| $150,000 and over | 2.4% | 2.2% |
Compared with the CPA, the proportion of women earning under $50,000 and between $50,000 to $74,999 is higher. The proportion of women in comparison to the overall CPA is lower for all other salary ranges of $75,000 and over.
Compared to March 2022, in March 2023 the proportion of women:
- increased in the salary range of $50,000 to $74,999 (from 46.6% to 46.9%)
- decreased in the $75,000 to $99,999 range (from 29.3% to 28.8%)
- increased in the $100,000 to $124,999 range (from 14.6% to 14.8%)
- decreased in the $125,000 to $149,999 range (from 5.2% to 4.7%)
A review of trends from March 2014 to March 2023 shows that the percentage of women in the under $50,000 range declined over the period. The percentage of women in the $75,000 to $99,999 range increased, with the largest increase observed in the $100,000 to $124,999 range.
Trends in hires, promotions and separations for women
| Fiscal year | All employees | Women | Percent of hires |
|---|---|---|---|
| 2016–17 | 16,081 | 9,281 | 57.7 |
| 2017–18 | 19,249 | 11,290 | 58.7 |
| 2018–19 | 23,334 | 13,181 | 56.5 |
| 2019–20 | 24,901 | 14,505 | 58.3 |
| 2020–21 | 24,229 | 14,592 | 60.2 |
| 2021–22 | 28,929 | 17,392 | 60.1 |
| 2022–23 | 33,361 | 20,378 | 61.1 |
| Fiscal year | All employees | Women | Percent of promotions |
|---|---|---|---|
| 2016–17 | 17,487 | 10,120 | 57.9 |
| 2017–18 | 20,660 | 12,260 | 59.3 |
| 2018–19 | 25,489 | 15,390 | 60.4 |
| 2019–20 | 27,211 | 16,628 | 61.1 |
| 2020–21 | 24,919 | 15,106 | 60.6 |
| 2021–22 | 29,295 | 18,256 | 62.3 |
| 2022–23 | 33,194 | 20,975 | 63.2 |
| Fiscal year | All employees | Women | Percent of separations |
|---|---|---|---|
| 2016–17 | 12,491 | 7,249 | 58.0 |
| 2017–18 | 12,937 | 7,349 | 56.8 |
| 2018–19 | 12,898 | 7,381 | 57.2 |
| 2019–20 | 13,043 | 7,459 | 57.2 |
| 2020–21 | 12,446 | 6,996 | 56.2 |
| 2021–22 | 16,687 | 9,443 | 56.6 |
| 2022–23 | 17,510 | 9,835 | 56.2 |
For the period between 2016–17 to 2022–23, the share of hires and promotions for women increased. The share of separations decreased.
| Action type | Total executives | Women | |
|---|---|---|---|
| Number | % | ||
| Hires | 132 | 69 | 52.3 [-4.3] |
| Promotions | 1,247 | 741 | 59.4 [+1.3] |
| Separations | 534 | 273 | 51.1 [+4.3] |
There was a 4.3 percentage point decrease in the share of hires and a 4.3 percentage point increase in the share of separations for women in the executive group compared with the previous year.
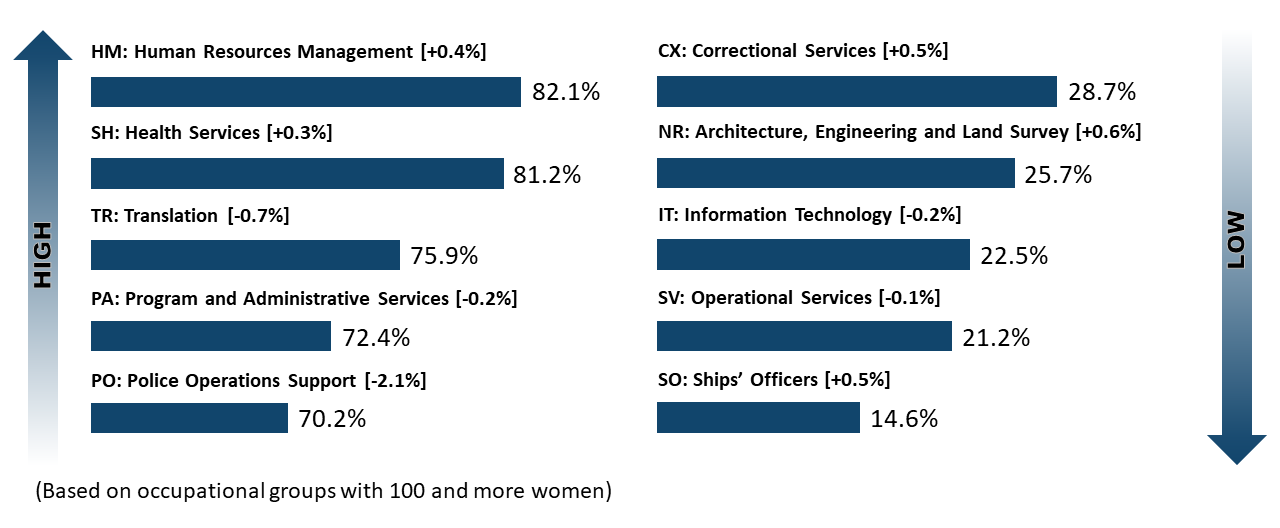
Figure 6 - Text version
Note: Based on occupational groups with 100 and more women.
Note: Figures in square brackets represent the change since March 2022.
Highest proportion of women
- HM: Human Resources Management: 82.1% [increase of 0.4 percentage points]
- SH: Health Services: 81.2% [increase of 0.3 percentage points]
- TR: Translation: 75.9% [decrease of 0.7 percentage points]
- PA: Program and Administrative Services: 72.4% [decrease of 0.2 percentage points]
- PO: Police Operations Support: 70.2% [decrease of 2.1 percentage points]
Lowest proportion of women
- CX: Correctional Services: 28.7% [increase of 0.5 percentage points]
- NR: Architecture, Engineering and Land Survey: 25.7% [increase of 0.6 percentage points]
- IT: Information Technology: 22.5% [decrease of 0.2 percentage points]
- SV: Operational Services: 21.2% [decrease of 0.1 percentage points]
- SO: Ships’ Officers: 14.6% [increase of 0.5 percentage points]
The largest concentration of women employees in the CPA remains in the Human Resources Management (HM) group and the Health Services (SH) group. Both groups increased compared with the previous year. Out of the top five occupational groups with the highest representation of women, the Police Operations Support (PO) group had the largest decrease in representation (2.1 percentage points) compared with the previous year.
The lowest concentration of women was in the Ships’ Officers (SO) group, representing 14.6%; however, this represents an increase of 0.5 percentage points from March 2022. Out of the bottom five occupational groups with the lowest representation of women, the largest increase (0.6 percentage points) was in the Architecture, Engineering and Land Survey (NR) group.
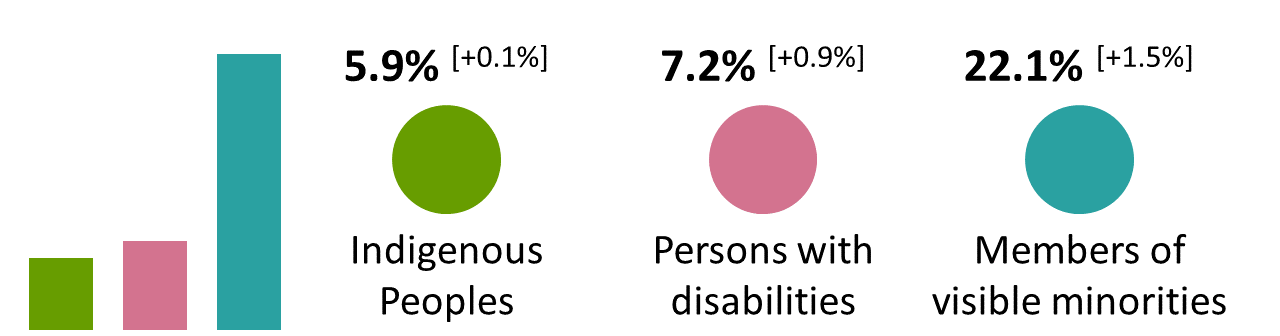
Of the 56.6% of the CPA who are women:
- 5.9% self-identified as Indigenous, an increase of 0.1 percentage points from last year
- 7.2% self-identified as a person with disabilities, an increase of 0.9 percentage points from last year
- 22.1% self-identified as a member of a visible minority group, an increase of 1.5 percentage points from last year.
Initiatives to support women
Equal pay for work of equal value: the Treasury Board of Canada Secretariat
The Government of Canada is committed to creating an inclusive public service where women receive equal pay for work of equal value. Amendments to the Pay Equity Act were adopted and introduced a new proactive pay equity regime for federally regulated workplaces that have 10 or more employees. Such workplaces include:
- federally regulated private and public sectors, including the federal public service
- parliamentary workplaces
- the prime minister’s office and ministers’ offices
Under this regime, employers must proactively examine their compensation practices to ensure that they are providing equal pay to men and women doing work of equal value.
Indigenous Peoples
Indigenous Peoples working in the core public administration
The core public administration (CPA) population for employment equity purposes includes indeterminate employees, term employees of three months or more, and seasonal employees of organizations listed in Schedules I and IV of the Financial Administration Act. The CPA population is based on the effective classification which includes acting assignments. Employees on leave without pay, term employees less than three months, students and casual workers, Governor in Council appointees, Ministers’ exempt staff, federal judges, and deputy ministers are excluded.
Internal representation is based on those who have voluntarily chosen to self-identify and self-declare to date as an Indigenous person, a person with a disability and/or a person in a visible minority group, while sex information is taken from the pay system.
Workforce availability (WFA) is calculated based on the 2016 Census and the 2017 Canadian Survey on Disability.
Figures in square brackets represent the changes since the previous year or fiscal year.
Core public administration
Indigenous Peoples
| Representation | WFA | |
|---|---|---|
| Indigenous Peoples | 5.3% [+0.1] | 3.8% Met |
| Indigenous Peoples in the executive group | 5.2% [+0.3] | 5.4% Not met |
As of March 2023, 5.3% of employees in the CPA self-identified as Indigenous Peoples. The number increased by 1,027 from the previous year. With a representation rate of 5.2% in executive group, Indigenous Peoples remained under-represented compared with their WFA of 5.4%.
| Executive level | All employees | Number | % of EX level |
|---|---|---|---|
| EX-01 | 3,935 | 230 | 5.8 |
| EX-02 | 1,986 | 92 | 4.6 |
| EX-03 | 1,323 | 56 | 4.2 |
| EX-04 | 269 | 13 | 4.8 |
| EX-05 | 130 | 6 | 4.6 |
| Total | 7,643 | 397 | 5.2 |
A greater concentration of Indigenous Peoples was in the EX‑01 category at 5.8%. Representation is the lowest in the EX‑03 category (4.2%) and increases to 4.8% and 4.6% at EX‑04 and EX‑05 level, respectively.
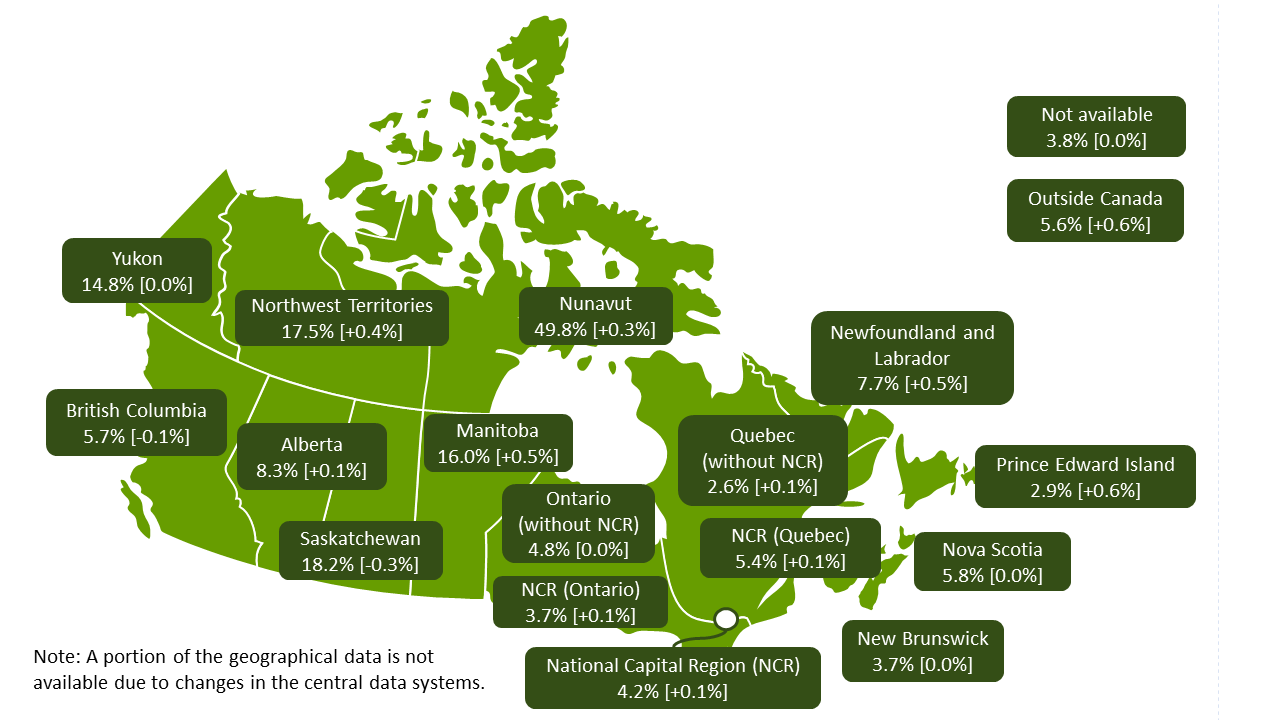
Figure 8 - Text version
Note: Figures in square brackets represent the change since March 2022.
Following are percentages by province, territory and other categories:
- Newfoundland and Labrador: 7.7% [increase of 0.5 percentage points]
- Prince Edward Island: 2.9% [increase of 0.6 percentage points]
- Nova Scotia: 5.8% [0.0 percentage points]
- New Brunswick: 3.7% [0.0 percentage points]
- Quebec (without the National Capital Region): 2.6% [increase of 0.1 percentage points]
- National Capital Region (Quebec): 5.4% [increase of 0.1 percentage points]
- National Capital Region (Ontario): 3.7% [increase of 0.1 percentage points]
- National Capital Region: 4.2% [increase of 0.1 percentage points]
- Ontario (without the National Capital Region): 4.8% [0.0 percentage points]
- Manitoba: 16.0% [increase of 0.5 percentage points]
- Saskatchewan: 18.2% [decrease of 0.3 percentage points]
- Alberta: 8.3% [increase of 0.1 percentage points]
- British Columbia: 5.7% [decrease of 0.1 percentage points]
- Yukon: 14.8% [0.0 percentage points]
- Northwest Territories: 17.5% [increase of 0.4 percentage points]
- Nunavut: 49.8% [increase of 0.3 percentage points]
- Outside Canada: 5.6% [increase of 0.6 percentage points]
- Not available: 3.8% [0.0 percentage points]
Note: A portion of the geographic data is not available due to changes in the central data systems.
Nunavut had the highest representation rate for Indigenous Peoples at 49.8%, followed by Saskatchewan at 18.2% and the Northwest Territories at 17.5%. Representation of Indigenous Peoples decreased since the previous year in British Columbia (by 0.1 percentage points) and Saskatchewan (by 0.3 percentage points).
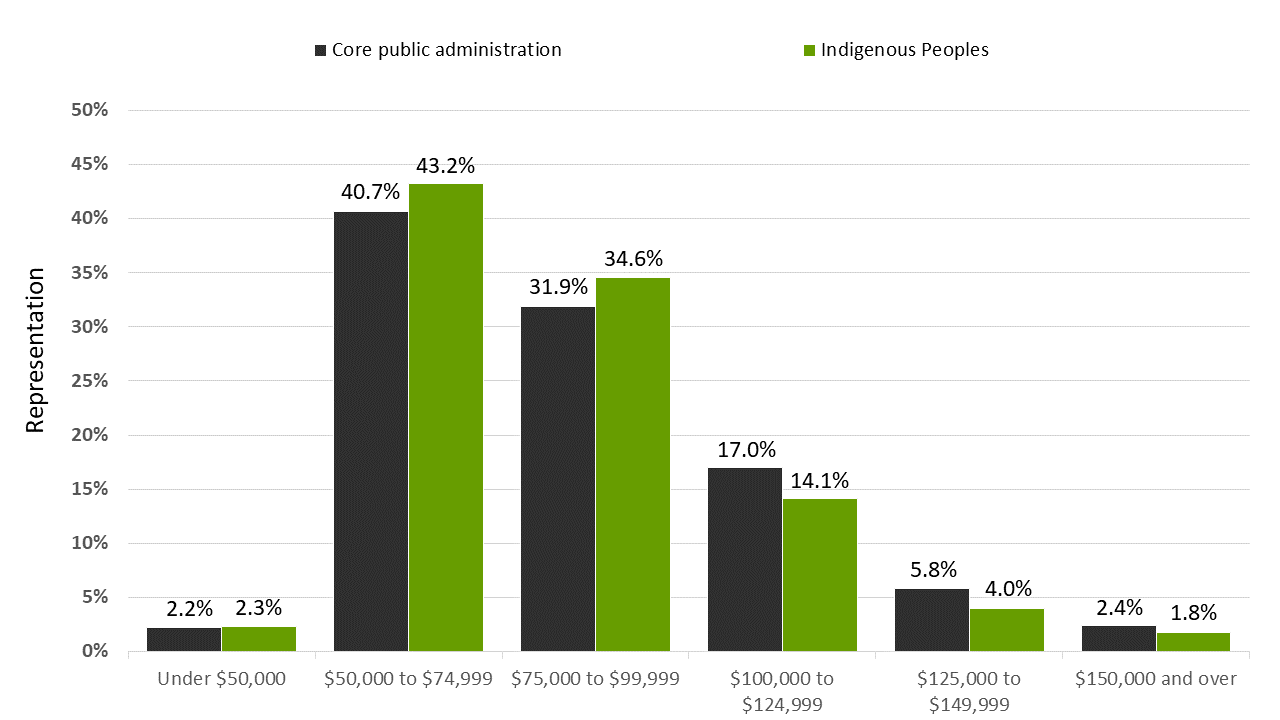
Figure 9 - Text version
| Salary range | Core public administration | Indigenous Peoples |
|---|---|---|
| Under $50,000 | 2.2% | 2.3% |
| $50,000 to $74,999 | 40.7% | 43.2% |
| $75,000 to $99,999 | 31.9% | 34.6% |
| $100,000 to $124,999 | 17.0% | 14.1% |
| $125,000 to $149,999 | 5.8% | 4.0% |
| $150,000 and over | 2.4% | 1.8% |
Compared with the CPA, the proportion of Indigenous employees was higher for those earning under $50,000, those in the $50,000 to $74,999 salary range, and those in the $75,000 to $99,999 salary range. The proportion of Indigenous Peoples in the salary ranges of $100,000 or more is lower than the proportion in the CPA.
When compared to March 2022, in March 2023 the proportion of Indigenous employees:
- increased in the salary range of $50,000 to $74,999 (from 42.7% to 43.2%)
- decreased in the $75,000 to $99,999 range (from 36.0% to 34.6%)
- increased in the $100,000 to $124,999 range (from 13.5% to 14.1%)
- decreased in the $125,000 to $149,999 range (from 4.3% to 4.0%)
A review of trends for the period of March 2014 to March 2023 shows that the percentage of Indigenous Peoples earning under $50,000 and those in the $50,000 to $74,999 salary ranges declined over the period. The percentage of Indigenous Peoples in the ranges of $75,000 and over increased, with the largest increase observed in the $75,000 to $99,999 range.
Trends in hires, promotions and separations for Indigenous Peoples
| Fiscal year | All employees | Indigenous Peoples | Percent of hires |
|---|---|---|---|
| 2016–17 | 16,081 | 703 | 4.4 |
| 2017–18 | 19,249 | 767 | 4.0 |
| 2018–19 | 23,334 | 962 | 4.1 |
| 2019–20 | 24,901 | 988 | 4.0 |
| 2020–21 | 24,229 | 927 | 3.8 |
| 2021–22 | 28,929 | 1,209 | 4.2 |
| 2022–23 | 33,361 | 1,471 | 4.4 |
| Fiscal year | All employees | Indigenous Peoples | Percent of promotions |
|---|---|---|---|
| 2016–17 | 17,487 | 836 | 4.8 |
| 2017–18 | 20,660 | 1,015 | 4.9 |
| 2018–19 | 25,489 | 1,217 | 4.8 |
| 2019–20 | 27,211 | 1,332 | 4.9 |
| 2020–21 | 24,919 | 1,223 | 4.9 |
| 2021–22 | 29,295 | 1,493 | 5.1 |
| 2022–23 | 33,194 | 1,698 | 5.1 |
| Fiscal year | All employees | Indigenous Peoples | Percent of separations |
|---|---|---|---|
| 2016–17 | 12,491 | 602 | 4.8 |
| 2017–18 | 12,937 | 685 | 5.3 |
| 2018–19 | 12,898 | 655 | 5.1 |
| 2019–20 | 13,043 | 697 | 5.3 |
| 2020–21 | 12,446 | 590 | 4.7 |
| 2021–22 | 16,687 | 850 | 5.1 |
| 2022–23 | 17,510 | 897 | 5.1 |
The share of hires for Indigenous Peoples fluctuated between 3.8% and 4.4% since 2016–17. The share of promotions and separations increased from 4.8% in 2016–17 to 5.1% in 2022–23.
| Action type | Total executives | Indigenous Peoples | |
|---|---|---|---|
| Number | % | ||
| Hires | 132 | 9 | 6.8 [+0.2] |
| Promotions | 1,247 | 79 | 6.3 [+0.4] |
| Separations | 534 | 22 | 4.1 [-0.1] |
The share of hires (6.8%) and promotions (6.3%) in executive positions increased by 0.2 percentage points and 0.4 percentage points, respectively, since last fiscal year. The share of separations slightly decreased since the previous fiscal year (by 0.1 percentage points).
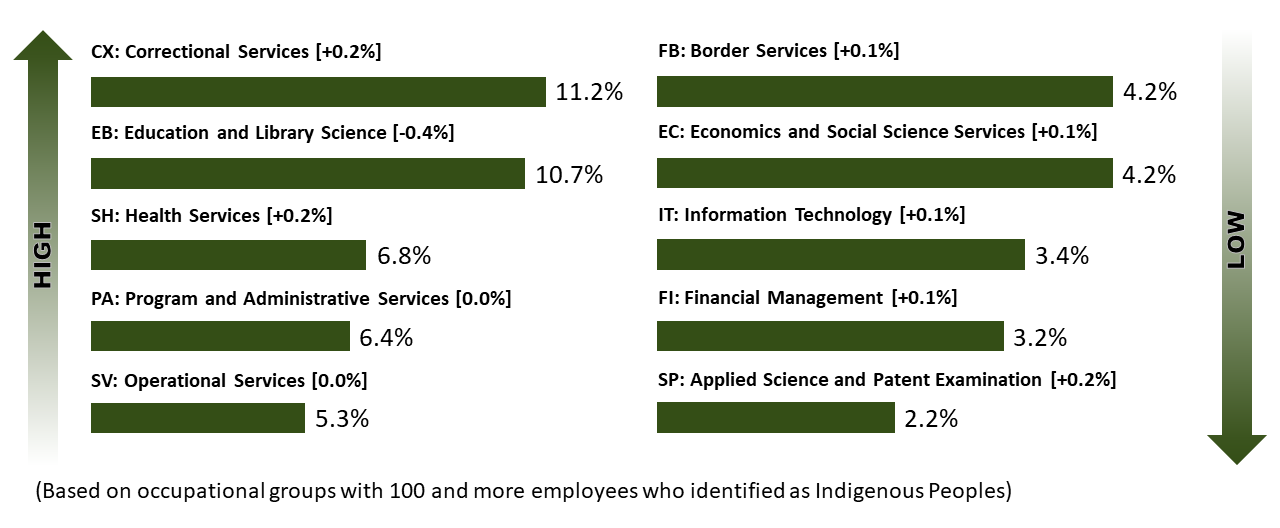
Figure 10 - Text version
Note: Based on occupational groups with 100 and more employees who identified as Indigenous Peoples.
Note: Figures in square brackets represent the change since March 2022.
Highest proportion of Indigenous Peoples
- CX: Correctional Service: 11.2% [increase of 0.2 percentage points]
- EB: Education and Library Science: 10.7% [decrease of 0.4 percentage points]
- SH: Health Services: 6.8% [increase of 0.2 percentage points]
- PA: Program and Administrative Services: 6.4% [0.0 percentage points]
- SV: Operational Services: 5.3% [0.0 percentage points]
Lowest proportion of Indigenous Peoples
- FB: Border Services: 4.2% [increase of 0.1 percentage points]
- EC: Economics and Social Science Services: 4.2% [increase of 0.1 percentage points]
- IT: Information Technology: 3.4% [increase of 0.1 percentage points]
- FI: Financial Management: 3.2% [increase of 0.1 percentage points]
- SP: Applied Science and Patent Examination: 2.2% [increase of 0.2 percentage points]
The largest concentration of Indigenous employees was in the Correctional Services (CX) group (11.2%), representing an increase of 0.2 percentage points since last fiscal year. Out of the top five occupational groups with the highest representation of Indigenous Peoples, the Education and Library Science (EB) group decreased the most (by 0.4 percentage points since last year).
The lowest concentration of Indigenous employees was in the Applied Science and Patent Examination (SP) group; however, it increased by 0.2 percentage points.
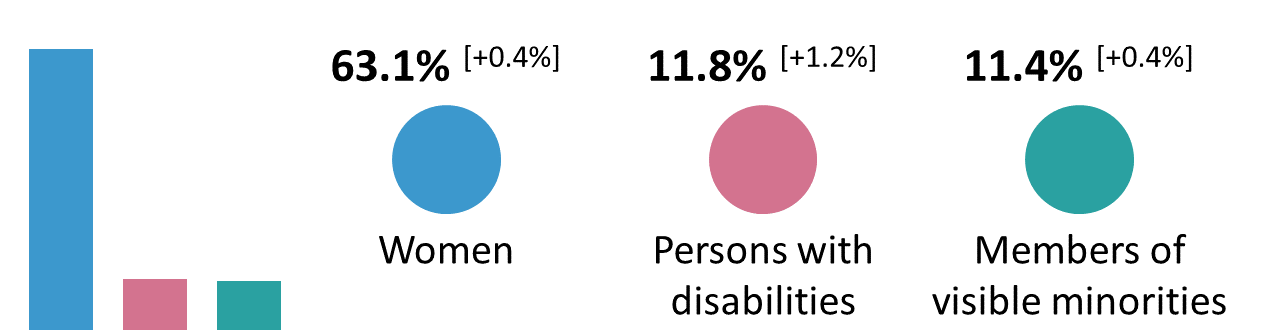
Of the 13,363 employees who self-identified as Indigenous, representing 5.3% of the CPA:
- 63.1% are women, an increase of 0.4 percentage points from last year
- 11.8% self-identified as a person with disabilities, an increase of 1.2 percentage points from last year
- 11.4% self-identified as a member of a visible minority group, an increase of 0.4 percentage points from last year
| Subgroup population | Number | Percent of Indigenous Peoples population |
|---|---|---|
| Inuit | 404 | 3.0% |
| Métis | 5,735 | 42.9% |
| First Nations | 5,566 | 41.7% |
| Other | 1,658 | 12.4% |
Most Indigenous employees self-identified as Métis at 42.9% and First Nations at 41.7%.
Initiatives to support Indigenous Peoples
The PSC’s Indigenous Student Employment Opportunity (ISEO) (accessible only on the Government of Canada network) supports Federal Student Work Experience Program (FSWEP) students who self-declare as Indigenous by providing them with support services and providing tools and guidance to managers to support them in providing a culturally appropriate workplace experience. In 2022–23, 245 students registered to participate in ISEO summer activities such as onboarding, mentoring and training with Indigenous employees from diverse backgrounds. In addition, a marketing and outreach campaign attracted new candidates, allowing them to develop new connections with Indigenous communities and peoples across Canada.
The PSC’s GCpedia page Indigenous Career Pathways (ICP) (accessible only on the Government of Canada network) facilitates the matching of Indigenous job seekers with hiring managers through two inventories designed to showcase Indigenous talent profiles. The ICP offers continuous intake and as of March 31, 2023, included 13 Indigenous graduates and 23 Indigenous employees pre-qualified in other departments’ pools. Throughout 2022–23, ongoing efforts to promote ICP as a tool for hiring managers resulted in over 71 referral requests from hiring managers. The PSC supports departments in hiring Indigenous Peoples through its inventories and the updated Indigenous Recruitment Toolbox (accessible only on the Government of Canada network), which provides resources to equip managers.
In partnership with Pilimmaksaivik (the Federal Centre of Excellence for Inuit Employment in Nunavut), the PSC launched an inventory product called the Inuksugait Resume Inventory to recruit Inuit candidates for various federal positions in Nunavut. The inventory is an effective, culturally competent hiring tool that connects Inuit talent with managers who are staffing positions in Nunavut to support organizations in meeting targets and closing representation gaps further to the Nunavut Land Claims Agreement. The inventory offers continuous intake and as of March 31, 2023, included 67 (available) candidates.
In addition, following engagement with Indigenous groups and in respect of the reconciliation principles, a government-wide approach was communicated related to the affirmation of Indigenous identity with a new Affirmation of Indigenous Identity Form and questions and answers in November 2022.
Since 2020, Employment and Social Development Canada (ESDC) has been operating a grassroots pilot initiative called the IT Apprenticeship Program for Indigenous Peoples. The initiative, which hires First Nations, Métis and Inuit in entry-level positions in IT for two years, provides an integrated learning program that combines on-the-job work experience with self-paced training and mentorship. Since the launch of the pilot, the program has increased the representation rate of Indigenous Peoples in the Government of Canada’s IT workforce by hiring over 120 apprentices from across Canada (as of August 2023), 30% of whom are living and working in an Indigenous community (representing a financial injection of over $2.1 million into local Indigenous economies) while increasing the number of Indigenous women / gender-diverse people. The number of participating organizations (departments, agencies, Crown corporations) increased by 40 (growing from 36 to 76). Between April 1, 2022, and March 31, 2023, the program produced the following specific results:
- 141 applications were received (bringing the total number of applications to 281)
- 48 apprentices were hired (increasing the total number of apprentices hired to 81)
- apprentices were supported in professional development, earning a total of 2,639 credentials (increased from 313).
The CSPS continues to partner with other federal government organizations, Elders, Knowledge Keepers and Indigenous and non-Indigenous experts on the development of learning content and the organization of events, including:
- the Department of Justice Canada (United Nations Declaration of the Rights of Indigenous Peoples)
- Crown-Indigenous Relations and Northern Affairs Canada (Modern Treaties and consultation)
- Pilimmaksaivik (development programs for Inuit)
- Inuit Tapiriit Kanatami (Inuit perspectives and realities)
- Métis National Council (Métis perspectives and realities)
- the Canadian Museum for Human Rights
- the National Centre for Truth and Reconciliation
The CSPS Indigenous Learning business line’s mandate has a direct tie to the Truth and Reconciliation Report’s Call to Action No. 57 regarding educating public servants on the history, cultures and realities of First Nations, Inuit and Métis Peoples. In 2022–23, Indigenous Learning offered:
- seven online and self-paced courses
- four instructor-led courses in a virtual classroom
- 15 job aids
- 37 videos
- 10 events
There was a focus to concentrate on “leadership from the top,” and a series of three new courses for executives was piloted, including an immersive four-day in-person course called “Building Meaningful Relationships with Indigenous Peoples.” The CSPS also hosted events on a wide range of current and pertinent topics, including Indigenous cultural practices and supporting the careers of Indigenous employees. The most attended event was “Marking the 2022 National Day for Truth and Reconciliation.”
Persons with disabilities
Persons with disabilities working in the core public administration
The core public administration (CPA) population for employment equity purposes includes indeterminate employees, term employees of three months or more, and seasonal employees of organizations listed in Schedules I and IV of the Financial Administration Act. The CPA population is based on the effective classification which includes acting assignments. Employees on leave without pay, term employees less than three months, students and casual workers, Governor in Council appointees, Ministers’ exempt staff, federal judges, and deputy ministers are excluded.
Internal representation is based on those who have voluntarily chosen to self-identify and self-declare to date as an Indigenous person, a person with a disability and/or a person in a visible minority group, while sex information is taken from the pay system.
Workforce availability (WFA) is calculated based on the 2016 Census and the 2017 Canadian Survey on Disability and reflects the expanded definition for persons with disabilities to include disabilities related to pain and mental health.
Figures in square brackets represent the change since the previous year or fiscal year.
Core public administration
Persons with disabilities
| Representation | WFA | |
|---|---|---|
| Persons with disabilities | 6.9% [+0.7] | 9.2% Not met |
| Persons with disabilities in the executive group | 7.7% [+1.2] | 5.3% Met |
As of March 2023, 6.9% of employees in the CPA self-identified as having disabilities. The number increased by 2,837, or by 0.7 percentage points, from the previous year. With this group’s WFA of 9.2%, there continues to be a significant gap, although it is trending upward.
Persons with disabilities represented 7.7% of executives in the CPA, which is above their WFA of 5.3%.
| Executive level | All employees | Number | % of EX level |
|---|---|---|---|
| EX-01 | 3,935 | 320 | 8.1 |
| EX-02 | 1,986 | 151 | 7.6 |
| EX-03 | 1,323 | 94 | 7.1 |
| EX-04 | 269 | 14 | 5.2 |
| EX-05 | 130 | 7 | 5.4 |
| Total | 7,643 | 586 | 7.7 |
A higher concentration of persons with disabilities in the EX group is in the entry level (EX‑01). Their representation level decreases from 8.1% at the EX‑01 level to 5.2% at the EX‑04 level and increases to 5.4% at the EX‑05 level.
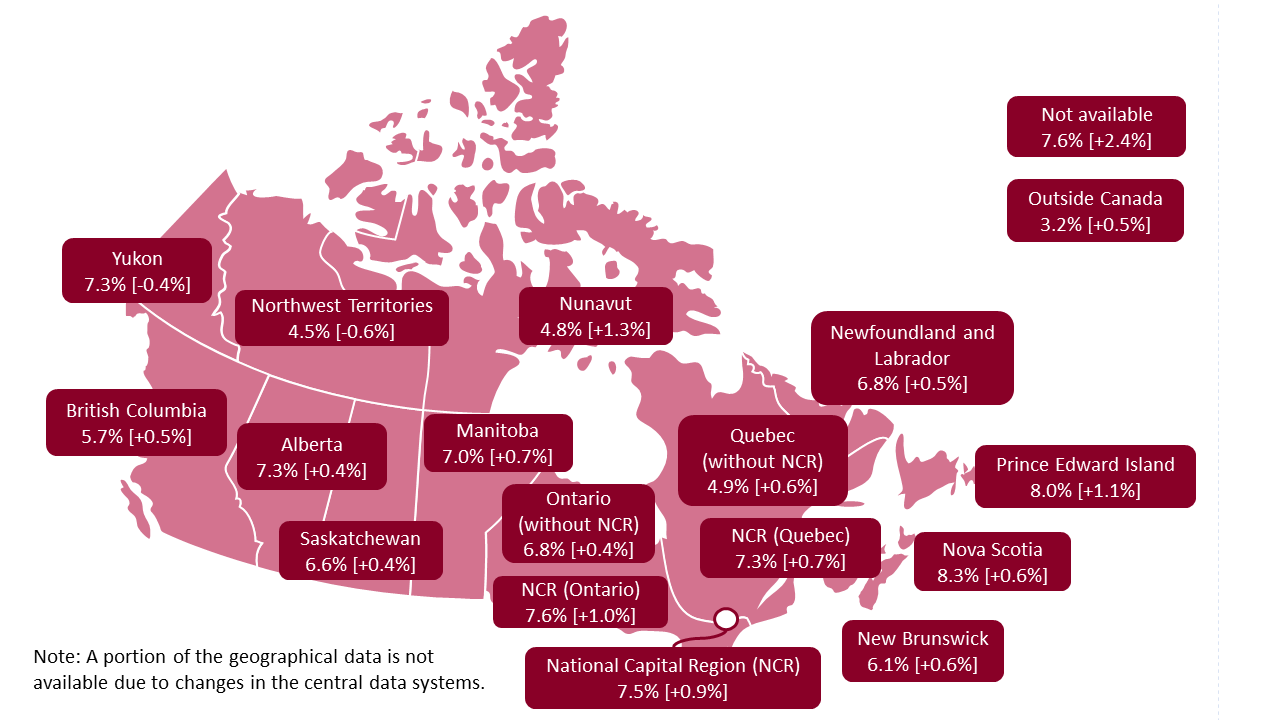
Figure 12 - Text version
Note: Figures in square brackets represent the change since March 2022.
Following are percentages by province, territory and other categories:
- Newfoundland and Labrador: 6.8% [increase of 0.5 percentage points]
- Prince Edward Island: 8.0% [increase of 1.1 percentage points]
- Nova Scotia: 8.3% [increase of 0.6 percentage points]
- New Brunswick: 6.1% [increase of 0.6 percentage points]
- Quebec (without the National Capital Region): 4.9% [increase of 0.6 percentage points]
- National Capital Region (Quebec): 7.3% [increase of 0.7 percentage points]
- National Capital Region (Ontario): 7.6% [increase of 1.0 percentage points]
- National Capital Region: 7.5% [increase of 0.9 percentage points]
- Ontario (without the National Capital Region): 6.8% [increase of 0.4 percentage points]
- Manitoba: 7.0% [increase of 0.7 percentage points]
- Saskatchewan: 6.6% [increase of 0.4 percentage points]
- Alberta: 7.3% [increase of 0.4 percentage points]
- British Columbia: 5.7% [increase of 0.5 percentage points]
- Yukon: 7.3% [decrease of 0.4 percentage points]
- Northwest Territories: 4.5% [decrease of 0.6 percentage points]
- Nunavut: 4.8% [increase of 1.3 percentage points]
- Outside Canada: 3.2% [increase of 0.5 percentage points]
- Not available: 7.6% [increase of 2.4 percentage points]
Note: A portion of the geographic data is not available due to changes in the central data systems.
Nova Scotia had the highest representation rate for persons with disabilities at 8.3%, followed by Prince Edward Island at 8.0% and the National Capital Region (Ontario) at 7.6%. Representation of this group increased in all the provinces and territories since the previous year, except in Yukon and the Northwest Territories, with 0.4 percentage point and 0.6 percentage point decreases, respectively.
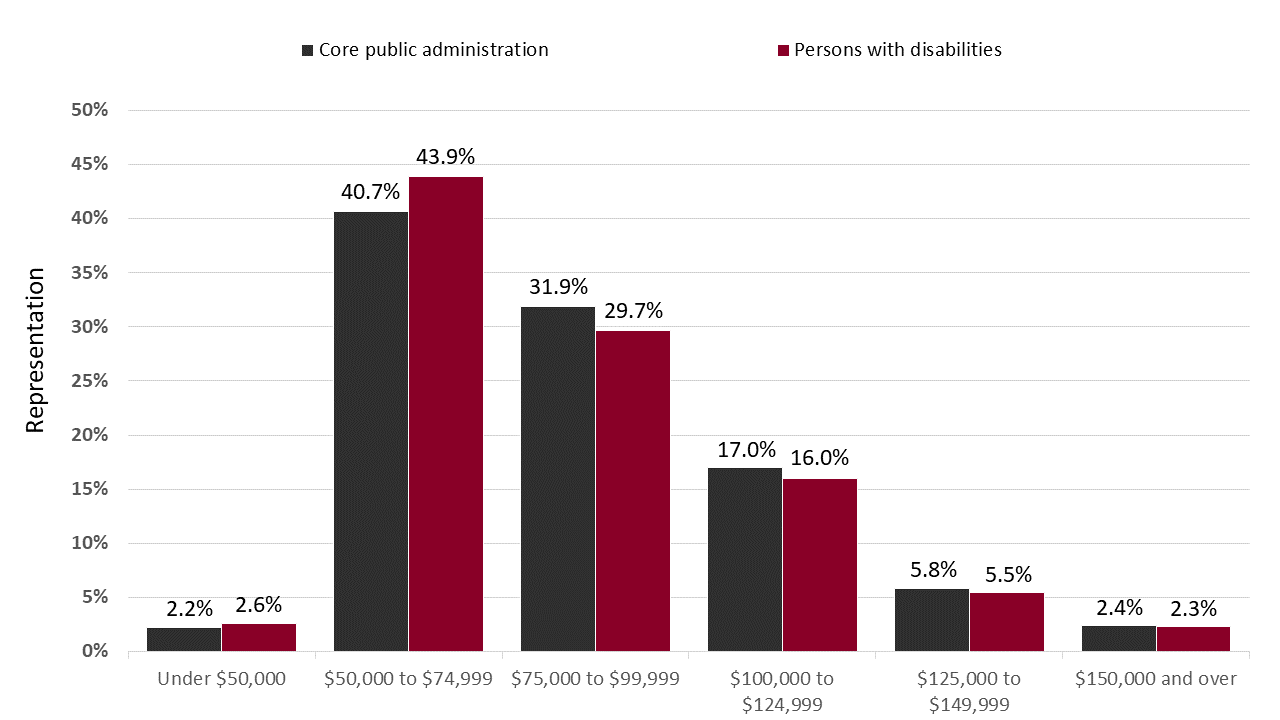
Figure 13 - Text version
| Salary range | Core public administration | Persons with disabilities |
|---|---|---|
| Under $50,000 | 2.2% | 2.6% |
| $50,000 to $74,999 | 40.7% | 43.9% |
| $75,000 to $99,999 | 31.9% | 29.7% |
| $100,000 to $124,999 | 17.0% | 16.0% |
| $125,000 to $149,999 | 5.8% | 5.5% |
| $150,000 and over | 2.4% | 2.3% |
Compared with the CPA, the proportion of persons with disabilities was higher in the under $50,000 salary range and in the $50,000 to $74,999 salary range. The proportion of persons with disabilities was lower in all salary ranges of $75,000 and over. The gaps progressively narrowed in the higher salary bands.
Compared to March 2022, in March 2023 the proportion of persons with disabilities:
- increased in the salary range of $50,000 to $74,999 (from 43.3% to 43.9%)
- decreased in the ranges of $75,000 and over (in March 2022, the $75,000 to $99,999 salary range was 30.3%, the $100,000 to $124,999 salary range was 16.1%, and the $125,000 to $149,999 salary range was 5.8%)
A review of trends during the period of March 2014 to March 2023 shows that the percentage of persons with disabilities in the under $50,000 salary range declined over that period. The percentage of persons with disabilities increased for ranges of $75,000 and over, with the largest increase observed in the $100,000 to $124,999 range.
Trends in hires, promotions and separations for persons with disabilities
| Fiscal year | All employees | Persons with disabilities | Percent of hires |
|---|---|---|---|
| 2016–17 | 16,081 | 603 | 3.7 |
| 2017–18 | 19,249 | 685 | 3.6 |
| 2018–19 | 23,334 | 866 | 3.7 |
| 2019–20 | 24,901 | 977 | 3.9 |
| 2020–21 | 24,229 | 1,053 | 4.3 |
| 2021–22 | 28,929 | 1,601 | 5.5 |
| 2022–23 | 33,361 | 2,295 | 6.9 |
| Fiscal year | All employees | Persons with disabilities | Percent of promotions |
|---|---|---|---|
| 2016–17 | 17,487 | 693 | 4.0 |
| 2017–18 | 20,660 | 837 | 4.1 |
| 2018–19 | 25,489 | 1,097 | 4.3 |
| 2019–20 | 27,211 | 1,133 | 4.2 |
| 2020–21 | 24,919 | 1,181 | 4.7 |
| 2021–22 | 29,295 | 1,681 | 5.7 |
| 2022–23 | 33,194 | 2,230 | 6.7 |
| Fiscal year | All employees | Persons with disabilities | Percent of separations |
|---|---|---|---|
| 2016–17 | 12,491 | 902 | 7.2 |
| 2017–18 | 12,937 | 994 | 7.7 |
| 2018–19 | 12,898 | 850 | 6.6 |
| 2019–20 | 13,043 | 931 | 7.1 |
| 2020–21 | 12,446 | 841 | 6.8 |
| 2021–22 | 16,687 | 1,097 | 6.6 |
| 2022–23 | 17,510 | 1,202 | 6.9 |
In 2022–23, the share of hires for persons with disabilities was 6.9% compared to 3.7% in 2016–17, which may reflect the ongoing efforts to recruit this community. The share of promotions increased by 2.7 percentage points between 2016–17 and 2022–23. The share of separations decreased slightly during the same period.
| Action type | Total executives | Persons with disabilities | |
|---|---|---|---|
| Number | % | ||
| Hires | 132 | 15 | 11.4 [+4.0] |
| Promotions | 1,247 | 114 | 9.1 [+2.3] |
| Separations | 534 | 59 | 11.0 [+3.6] |
In 2022–23, the share of hires and promotions for persons with disabilities in the executive group saw an increase of 4.0 percentage points and 2.3 percentage points, respectively, since last fiscal year, while the share of separations increased by 3.6 percentage points.
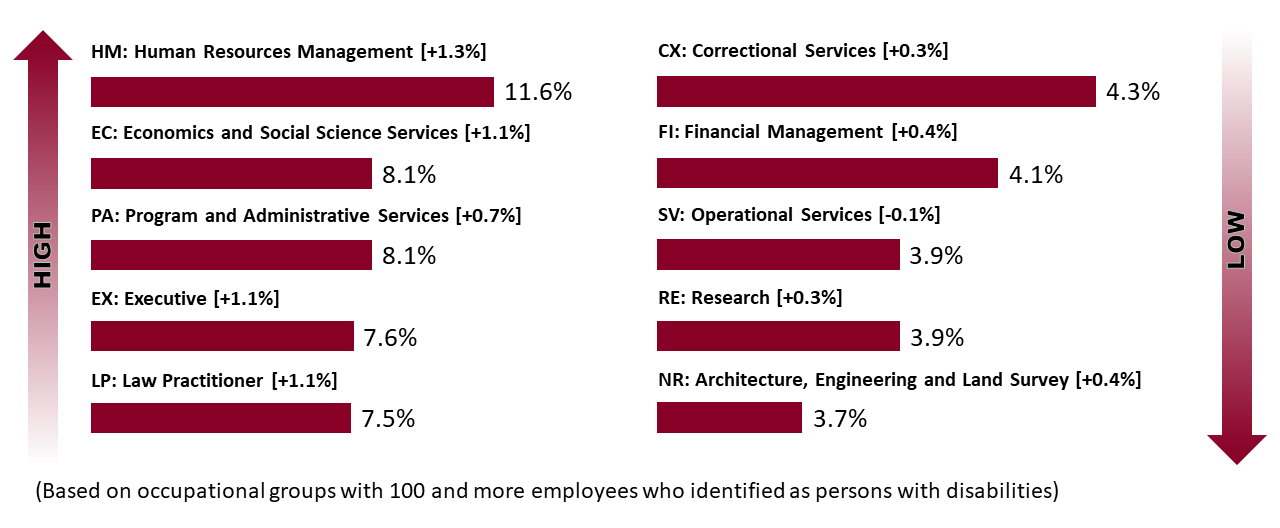
Figure 14 - Text version
Note: Based on occupational groups with 100 and more employees who identified as persons with disabilities.
Note: Figures in square brackets represent the change since March 2022.
Highest proportion of persons with disabilities
- HM: Human Resources Management: 11.6% [increase of 1.3 percentage points]
- EC: Economics and Social Science Services: 8.1% [increase of 1.1 percentage points]
- PA: Program and Administrative Services: 8.1% [increase of 0.7 percentage points]
- EX: Executive: 7.6% [increase of 1.1 percentage points]
- LP: Law Practitioner: 7.5% [increase of 1.1 percentage points]
Lowest proportion of persons with disabilities
- CX: Correctional Services: 4.3% [increase of 0.3 percentage points]
- FI: Financial Management: 4.1% [increase of 0.4 percentage points]
- SV: Operational Services: 3.9% [decrease of 0.1 percentage points]
- RE: Research: 3.9% [increase of 0.3 percentage points]
- NR: Architecture, Engineering and Land Survey: 3.7% [increase of 0.4 percentage points]
Out of the top and bottom five occupational groups with the highest and lowest representation of persons with disabilities, the largest increase in concentration was in the Human Resources Management (HM) group (1.3 percentage points). The lowest concentration of persons with disabilities was seen in the Architecture, Engineering and Land Survey (NR) group; however, except for the Operational Services group (SV), the representation increased in the bottom five occupational groups with the lowest proportion of persons with disabilities.
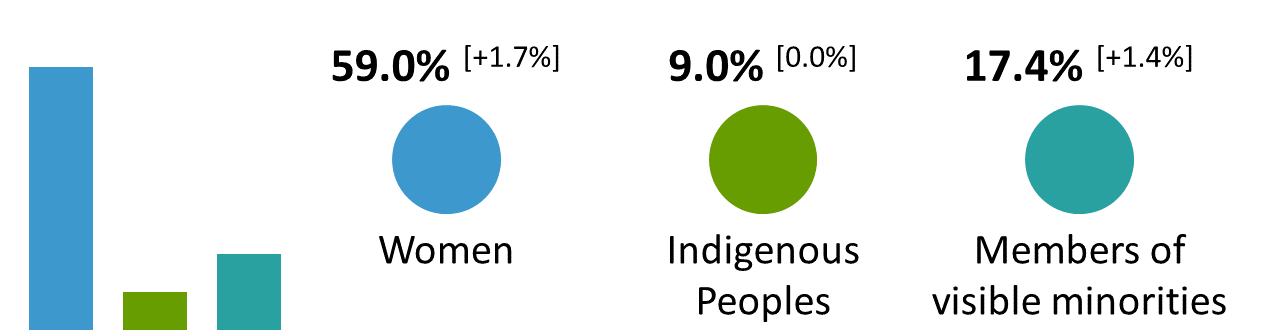
Of the 17,410 employees who self-identified as persons with disabilities, representing 6.9% of the CPA:
- 59.0% were women, an increase of 1.7 percentage points from last year
- 9.0% self-identified as Indigenous, unchanged from last year
- 17.4% self-identified as a member of visible minority group, an increase of 1.4 percentage points from last year
| Disability type | Number | Percent of persons with disabilities population |
|---|---|---|
| Coordination and dexterity | 1,257 | 7.2% |
| Mobility | 2,588 | 14.9% |
| Speech impairment | 349 | 2.0% |
| Blind or visual impairment | 1,160 | 6.7% |
| Deaf or hard of hearing | 2,098 | 12.1% |
| Other disability | 12,370 | 71.1% |
Note: The sum of disability types does not match the disability total as one person can have multiple disabilities.
The highest proportion of persons with disabilities was found in the “other disability” category (71.1%), with an increase of 3.3 percentage points since the previous year. Mobility (14.9%) and deaf or hard of hearing (12.1%) were the other two most prevalent disability types.
Initiatives for persons with disabilities
The Office of Public Service Accessibility (OPSA) at the Treasury Board of Canada Secretariat (TBS) provides centralized leadership and guidance on embedding accessibility and disability inclusion across the public service. Each department and agency must submit an accessibility plan and report publicly on their progress to meet the requirements of the Accessible Canada Act. Including measurable actions in the accessibility plan is therefore essential. In 2022, particular attention was given to the priority areas of employment, accommodations and measuring change. Adoption of the Government of Canada Workplace Accessibility Passport has continued to expand with over 55 organizations integrating the passport into their workplace accommodation processes. Since July 2022, the Microsoft Word version of the passport has been downloaded over 8,000 times. A digital application will be launched in spring 2024.
Funded by the Centralized Enabling Workplace Fund, the Lending Library has continued its work as an innovative service delivery initiative and has lent more than 1,200 adaptive tools to 420 employees with disabilities. Organizations are using the Lending Library to ensure that supports are provided in a timely and efficient manner to short-term employees and students with disabilities and employees with temporary or episodic disabilities.
In addition, targeted hiring efforts were developed, such as the Neurodiversity Recruitment Pilot and training tools to help managers make their hiring practices more inclusive. By fall 2022, OPSA was able to achieve targeted hiring of 16 neurodivergent candidates with three organizational partners.
In the CSPS’s Accessibility Plan 2023-2025, it committed to concrete actions to address accessibility barriers, including:
- accessibility monitoring and improvement in the product review cycle
- implementing modern learning approaches such as gamification and neuro-learning in learning products
During the reporting period, it launched two new online courses on accessibility:
- “Addressing Disability Inclusion and Barriers to Accessibility”
- “Disability Management and Workplace Wellness”
To raise awareness and promote culture change, CSPS organized events on accessibility and disability inclusion that focused on employment opportunities. The CSPS also:
- launched three videos about the Government of Canada Workplace Accessibility Passport, with 5,484 unique page views
- contracted the organization LiveWorkPlay to pilot internal learning sessions for its executives on inclusion, with a focus on neurodiversity and people with intellectual disabilities
The PSC’s Federal Internship Program for Canadians with Disabilities (FIPCD) is a national recruitment program that offers two-year internship opportunities between 2019 and 2024 for entry-level positions to 125 persons with disabilities to support the Government of Canada’s commitment of hiring 5,000 net new persons with disabilities by 2025. Through assessment advice, coaching and training, the FIPCD provides interns and managers with the tools to support the development of the intern. As of March 2023, the hiring and onboarding process for cohorts 3 and 4 was completed, resulting in 46 new interns being placed.
The Employment Opportunity for Students with Disabilities (EOSD) (accessible only on the Government of Canada network), supports Federal Student Work Experience Program (FSWEP) students who self-declare as having a disability by providing them with support services and tools and guidance to managers to support them in providing an inclusive and accessible workplace experience. In 2022–23, 94 students were registered to participate in EOSD summer activities such as onboarding, learning, mentorship and networking events. The mentorship program saw an increase in the number of mentors available to students with 28 in 2022, up from 14 in 2021. Additional events were held in the fall and winter to ensure continued support for students with disabilities. The PSC also maintains an inventory of EOSD graduates with disabilities, which, as of March 31, 2023, included 89 candidates who can be hired through student bridging.
The PSC hosts a GCpedia Virtual Door to Talent with Disabilities page (accessible only on the Government of Canada network) that serves as a one-stop-shop for resources for persons with disabilities and talent products to support hiring managers. It offers a streamlined way to search the inventories and request candidate referrals. The PSC continues to conduct outreach, advertising and marketing to:
- promote employment opportunities for persons with disabilities
- support departments in hiring through its inventories
- promote the Hiring Persons with Disabilities Toolkit
From October 2022 to March 2023, the PSC led a marketing strategy to attract talented people with disabilities, which included paid advertising to promote self-declaration among job seekers with disabilities. The PSC also demystified self-declaration through a collaboration with Ami-tv in English and Ami-télé in French and social media campaigns, resulting in 7.8% of all applicants self-declaring in February 2023.
The Working Group for Hiring People with Disabilities is a joint Human Resources Council / PSC working group aimed at developing inventories of persons with disabilities. This working group launched three inventories that are available to hiring managers:
- Careers in policy and data analysis (EC-01 to EC-05)
- Digital careers (IT-01 to IT-04)
- Senior financial analysts (FI-03)
In partnership with seven departments, the PSC launched a fourth inventory: Careers in biology (BI-02).
The Assessment Accessibility Ambassadors (AAA) Network, which has a GCpedia page, will continue to support the HR community in applying best practices in its evaluation and mitigation of barriers or biases in assessment methods used for hiring, by promoting the guide and other supports such as:
- assessment accommodation consultation and services
- sharing expertise, best practices and training to support the HR community to improve accessibility and inclusiveness in selection processes
- providing assessment, coaching and counselling services as part of the Mosaic Leadership Development Program and the Executive Leadership Development Program
Job Evaluation Standards (JESs) are used to classify and evaluate work across the CPA, determining the group and level of each position. As of March 2023, there were 72 JESs, and these standards are used daily by classification advisors in organizations. Work has been ongoing to make JESs accessible for people with visual impairments. OCHRO is reformatting JESs and converting them to Hypertext Markup Language (HTML) to render them both searchable and readable with a screen-reader. To date, 16 of the 72 JESs (22%) have been reformatted and are now accessible. A new template has been developed to help make the reformatting and coding of the remaining JESs more efficient.
Members of visible minorities
Members of visible minorities working in the core public administration
The core public administration (CPA) population for employment equity purposes includes indeterminate employees, term employees of three months or more, and seasonal employees of organizations listed in Schedules I and IV of the Financial Administration Act. The CPA population is based on the effective classification which includes acting assignments. Employees on leave without pay, term employees less than three months, students and casual workers, Governor in Council appointees, Ministers’ exempt staff, federal judges, and deputy ministers are excluded.
Internal representation is based on those who have voluntarily chosen to self-identify and self-declare to date as an Indigenous person, a person with a disability and/or a person in a visible minority group, while sex information is taken from the pay system.
Workforce availability (WFA) is calculated based on the 2016 Census and the 2017 Canadian Survey on Disability.
Figures in square brackets represent the change since the previous year or fiscal year.
Core public administration
Members of visible minorities
| Representation | WFA | |
|---|---|---|
| Members of visible minorities | 21.7% [+1.5] | 17.3% Met |
| Members of visible minorities in the executive group | 15.2% [+1.2] | 10.8% Met |
As of March 2023, 21.7% of employees in the CPA self-identified as a member of a visible minority group, which is above their workforce availability of 17.3%. Since last year, the number of members of visible minorities increased by 7,306. With a representation rate of 15.2% in the executive group, members of visible minorities remained above their workforce availability of 10.8%.
| Executive level | All employees | Number | % of EX level |
|---|---|---|---|
| EX-01 | 3,935 | 637 | 16.2 |
| EX-02 | 1,986 | 288 | 14.5 |
| EX-03 | 1,323 | 184 | 13.9 |
| EX-04 | 269 | 41 | 15.2 |
| EX-05 | 130 | 15 | 11.5 |
| Total | 7,643 | 1,165 | 15.2 |
The representation of members of visible minorities is the highest at the EX‑01 level, with a representation rate of 16.2%. At the EX‑05 level, the representation rate of members of visible minorities is 11.5%.
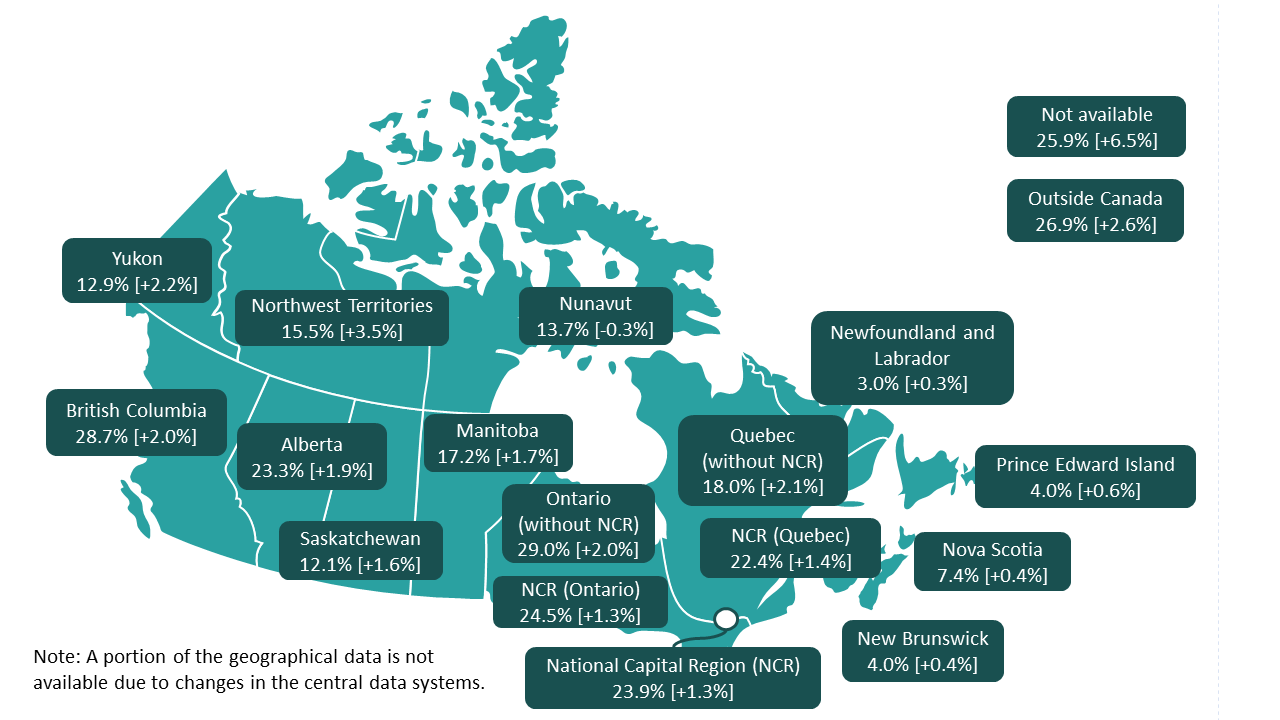
Figure 16 - Text version
Note: Figures in square brackets represent the change since March 2022.
Following are percentages by province, territory and other categories:
- Newfoundland and Labrador: 3.0% [increase of 0.3 percentage points]
- Prince Edward Island: 4.0% [increase of 0.6 percentage points]
- Nova Scotia: 7.4% [increase of 0.4 percentage points]
- New Brunswick: 4.0% [increase of 0.4 percentage points]
- Quebec (without the National Capital Region): 18.0% [increase of 2.1 percentage points]
- National Capital Region (Quebec): 22.4% [increase of 1.4 percentage points]
- National Capital Region (Ontario): 24.5% [increase of 1.3 percentage points]
- National Capital Region: 23.9% [increase of 1.3 percentage points]
- Ontario (without the National Capital Region): 29.0% [increase of 2.0 percentage points]
- Manitoba: 17.2% [increase of 1.7 percentage points]
- Saskatchewan: 12.1% [increase of 1.6 percentage points]
- Alberta: 23.3% [increase of 1.9 percentage points]
- British Columbia: 28.7% [increase of 2.0 percentage points]
- Yukon: 12.9% [increase of 2.2 percentage points]
- Northwest Territories: 15.5% [increase of 3.5 percentage points]
- Nunavut: 13.7% [decrease of 0.3 percentage points]
- Outside Canada: 26.9% [increase of 2.6 percentage points]
- Not available: 25.9% [increase of 6.5 percentage points]
Note: A portion of the geographic data is not available due to changes in the central data systems.
Ontario (without the National Capital Region) had the highest representation rate for members of visible minorities at 29.0%, followed by British Columbia with a rate of 28.7%. The lowest representation rate of members of visible minorities was in Newfoundland and Labrador, Prince Edward Island and New Brunswick (3.0%, 4.0% and 4.0%, respectively).
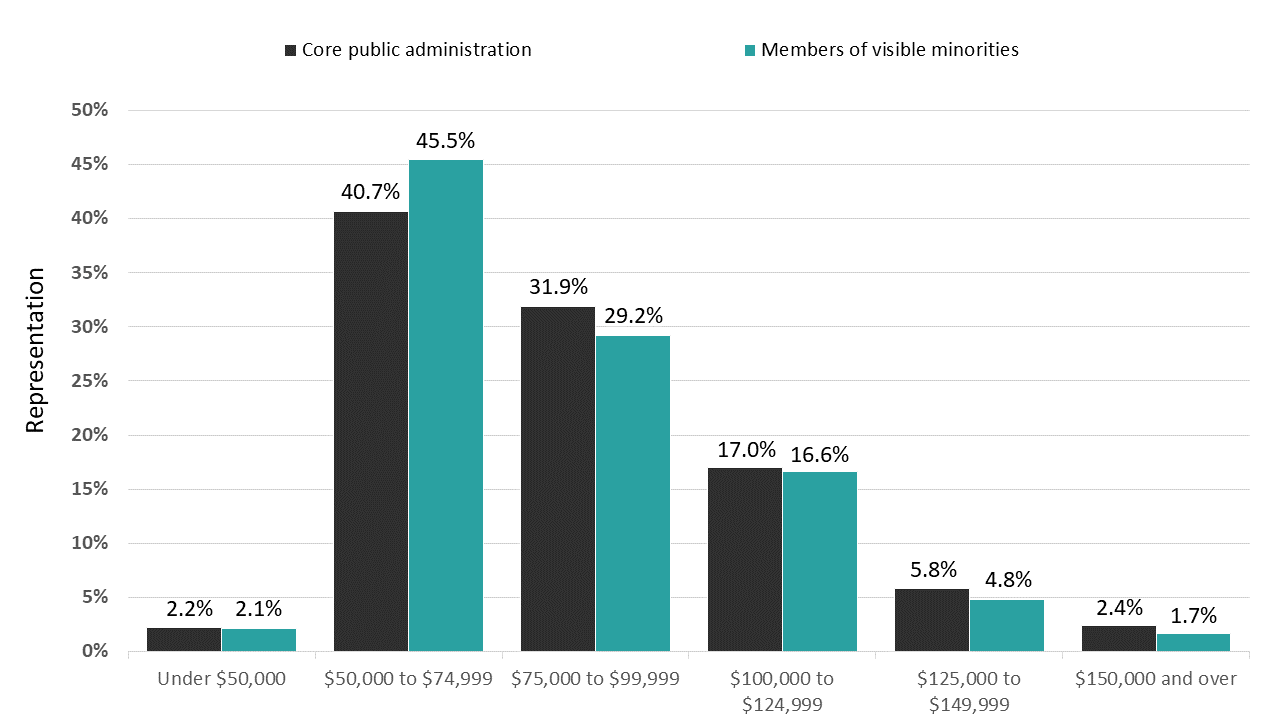
Figure 17 - Text version
| Salary range | Core public administration | Members of visible minorities |
|---|---|---|
| Under $50,000 | 2.2% | 2.1% |
| $50,000 to $74,999 | 40.7% | 45.5% |
| $75,000 to $99,999 | 31.9% | 29.2% |
| $100,000 to $124,999 | 17.0% | 16.6% |
| $125,000 to $149,999 | 5.8% | 4.8% |
| $150,000 and over | 2.4% | 1.7% |
Compared with the CPA, the proportion of members of visible minorities is higher in the $50,000 to $74,999 salary range and lower in all salary ranges of $75,000 and over.
Compared to March 2022, in March 2023 the proportion of members of visible minorities:
- increased in the salary range of $50,000 to $74,999 (from 44.3% to 45.5%)
- decreased in the $75,000 to $99,999 salary range (from 30.6% to 29.2%)
- remained about the same in the $100,000 to $124,999 salary range (from 16.5% to 16.6%)
- decreased in the $125,000 to $149,999 salary range (from 5.4% to 4.8%)
A review of trends during the period of March 2014 to March 2023 shows that the percentage of members of visible minorities in the under $50,000 salary range declined over the period. The percentage of members of visible minorities in salary ranges $100,000 and over increased, with the largest increase observed in the $100,000 to $124,999 salary range.
Trends in hires, promotions and separations for members of visible minorities
| Fiscal year | All employees | Members of visible minorities | Percent of hires |
|---|---|---|---|
| 2016–17 | 16,081 | 2,875 | 17.9 |
| 2017–18 | 19,249 | 3,402 | 17.7 |
| 2018–19 | 23,334 | 4,510 | 19.3 |
| 2019–20 | 24,901 | 5,302 | 21.3 |
| 2020–21 | 24,229 | 5,148 | 21.2 |
| 2021–22 | 28,929 | 6,723 | 23.2 |
| 2022–23 | 33,361 | 8,960 | 26.9 |
| Fiscal year | All employees | Members of visible minorities | Percent of promotions |
|---|---|---|---|
| 2016–17 | 17,487 | 2,788 | 15.9 |
| 2017–18 | 20,660 | 3,560 | 17.2 |
| 2018–19 | 25,489 | 4,770 | 18.7 |
| 2019–20 | 27,211 | 5,405 | 19.9 |
| 2020–21 | 24,919 | 5,227 | 21.0 |
| 2021–22 | 29,295 | 6,818 | 23.3 |
| 2022–23 | 33,194 | 8,024 | 24.2 |
| Fiscal year | All employees | Members of visible minorities | Percent of separations |
|---|---|---|---|
| 2016–17 | 12,491 | 1,490 | 11.9 |
| 2017–18 | 12,937 | 1,310 | 10.1 |
| 2018–19 | 12,898 | 1,260 | 9.8 |
| 2019–20 | 13,043 | 1,371 | 10.5 |
| 2020–21 | 12,446 | 1,354 | 10.9 |
| 2021–22 | 16,687 | 2,033 | 12.2 |
| 2022–23 | 17,510 | 2,478 | 14.2 |
Overall, the shares of hires and promotions have increased between 2016–17 and 2022–23, while the share of separations decreased between 2016–17 and 2018–19 and increased between 2018–19 and 2022–23.
| Action type | Total executives | Members of visible minorities | |
|---|---|---|---|
| Number | % | ||
| Hires | 132 | 20 | 15.2 [-2.0] |
| Promotions | 1,247 | 223 | 17.9 [-1.2] |
| Separations | 534 | 58 | 10.9 [+1.1] |
Compared to last year, the shares of hires and promotions for members of visible minorities in executive positions decreased whereas the share of separations increased.
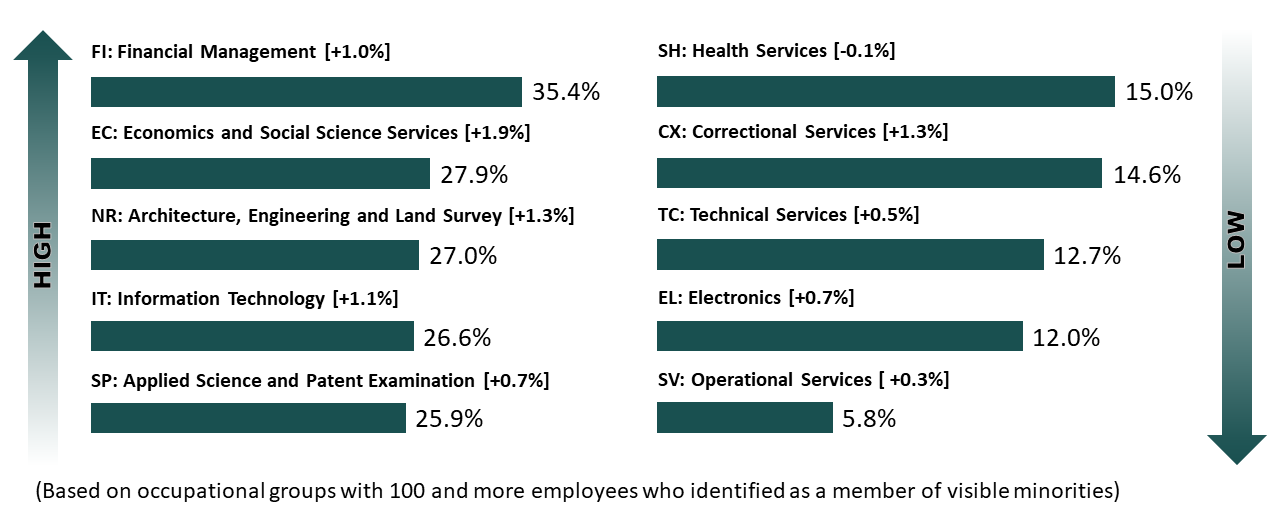
Figure 18 - Text version
Note: Based on occupational groups with 100 and more employees who identified as a member of visible minorities.
Note: Figures in square brackets represent the change since March 2022.
Highest proportion of members of visible minorities
- FI: Financial Management: 35.4% [increase of 1.0 percentage points]
- EC: Economics and Social Science Services: 27.9% [increase of 1.9 percentage points]
- NR: Architecture, Engineering and Land Survey: 27.0% [increase of 1.3 percentage points]
- IT: Information Technology: 26.6% [increase of 1.1 percentage points]
- SP: Applied Science and Patent Examination: 25.9% [increase of 0.7 percentage points]
Lowest proportion of members of visible minorities
- SH: Health Services: 15.0% [decrease of 0.1 percentage points]
- CX: Correctional Services: 14.6% [increase of 1.3 percentage points]
- TC: Technical Services: 12.7% [increase of 0.5 percentage points]
- EL: Electronics: 12.0% [increase of 0.7 percentage points]
- SV: Operational Services: 5.8% [increase of 0.3 percentage points]
The Financial Management (FI) group had the largest concentration of members of visible minorities as of March 2023. The Economics and Social Science Services (EC) group showed the largest increase (1.9 percentage points) since March 2022 out of the top five occupational groups with the largest proportion of visible minorities. Operational Services (SV), Electronics (EL) and Technical Services (TC) are the groups that had the lowest representation of members of visible minorities.
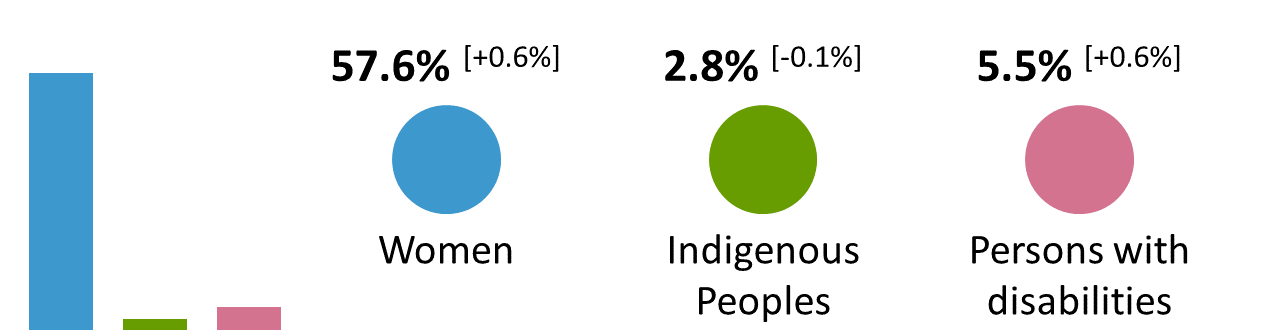
Of the 21.7% of employees who self-identified as a member of a visible minority group:
- 57.6% are women, an increase of 0.6 percentage points from last year
- 2.8% self-identified as Indigenous, a decrease of 0.1 percentage points from last year
- 5.5% self-identified as a person with disabilities, an increase of 0.6 percentage points from last year
| Subgroup population | Number | Percent of members of visible minorities population |
|---|---|---|
| Black | 11,771 | 21.4% |
| Non-white Latin American | 2,567 | 4.7% |
| Person of mixed origin | 4,409 | 8.0% |
| Chinese | 8,505 | 15.5% |
| Japanese | 296 | 0.5% |
| Korean | 847 | 1.5% |
| Filipino | 2,176 | 4.0% |
| South Asian / East Indian | 10,125 | 18.4% |
| Non-white West Asian, North African or Arab | 6,555 | 11.9% |
| Southeast Asian | 2,381 | 4.3% |
| Other visible minority group | 5,402 | 9.8% |
Data shows that Black people (21.4%), South Asian and East Indian people (18.4%) and Chinese people (15.5%) are the largest subgroups.
Initiatives to support visible minorities
Led by the Immigration Branch of Immigration, Refugees and Citizenship Canada, the International Experience Canada (IEC) framework articulates IEC’s mandate, vision and guiding principles to provide policy anchors to focus work on activities that bring the most benefit to Canada and Canadians. The framework supports Building a Foundation for Change: Canada’s Anti-Racism Strategy 2019–2022 to foster and promote an inclusive society. Through the IEC, employers can hire skilled workers, and this work experience could later be applied toward the Canadian Experience Class for permanent residency applications.
The IEC expansion is focused on diversifying Canadian partnerships outside Europe to:
- renew prospective partner assessment methodology to prioritize negotiations
- strategically expand plans to add new partners to increase Canadian participation
- modernize the plan to ensure maximum benefits with existing partners
- enact an engagement strategy to socialize key messages and work productively with partners
- ensure periodic reporting to measure performance and take stock of accomplishments
The main objectives of IEC are to:
- enhance opportunities for Canadian and foreign youth
- strengthen bilateral relations and people-to-people ties
- ensure more inclusive programming and advance anti-racism objectives
- support departmental priorities (labour market needs, economic recovery and Francophone migration)
A wide range of stakeholders were consulted as part of Immigration, Refugees and Citizenship Canada’s Strategic Immigration Review (Shaping the Future of Immigration in Canada), launched in February 2023. It aims, in part, to enhance crisis response mechanisms and renew the organizational framework for crisis management to better enable more nimble and sustainable immigration responses to humanitarian crises as part of the broader Government of Canada response. In addition, other topics such as how the department could increase responsiveness to the diverse settlement needs of immigrant newcomers amidst a housing shortage and settlement organization capacity limitations were explored in that context. The consultations were completed in summer 2023.
Black employees
Representation of Black employees working in the core public administration
The core public administration (CPA) population for employment equity purposes includes indeterminate employees, term employees of three months or more, and seasonal employees of organizations listed in Schedules I and IV of the Financial Administration Act. The CPA population is based on the effective classification which includes acting assignments. Employees on leave without pay, term employees less than three months, students and casual workers, Governor in Council appointees, Ministers’ exempt staff, federal judges, and deputy ministers are excluded.
Internal representation is based on those who have voluntarily chosen to self-identify and self-declare to date as an Indigenous person, a person with a disability and/or a person in a visible minority group, while sex information is taken from the pay system.
There are no workforce availabilities for employment equity subgroups.
Figures in square brackets represent the change since the previous year or fiscal year.
Core public administration
Members of visible minorities
Black employees
Between March 2022 and March 2023, the number of Black employees increased by 1,962 to a total of 11,771 employees. Black employees represented 4.6% of the CPA and 21.4% of the visible minority population.
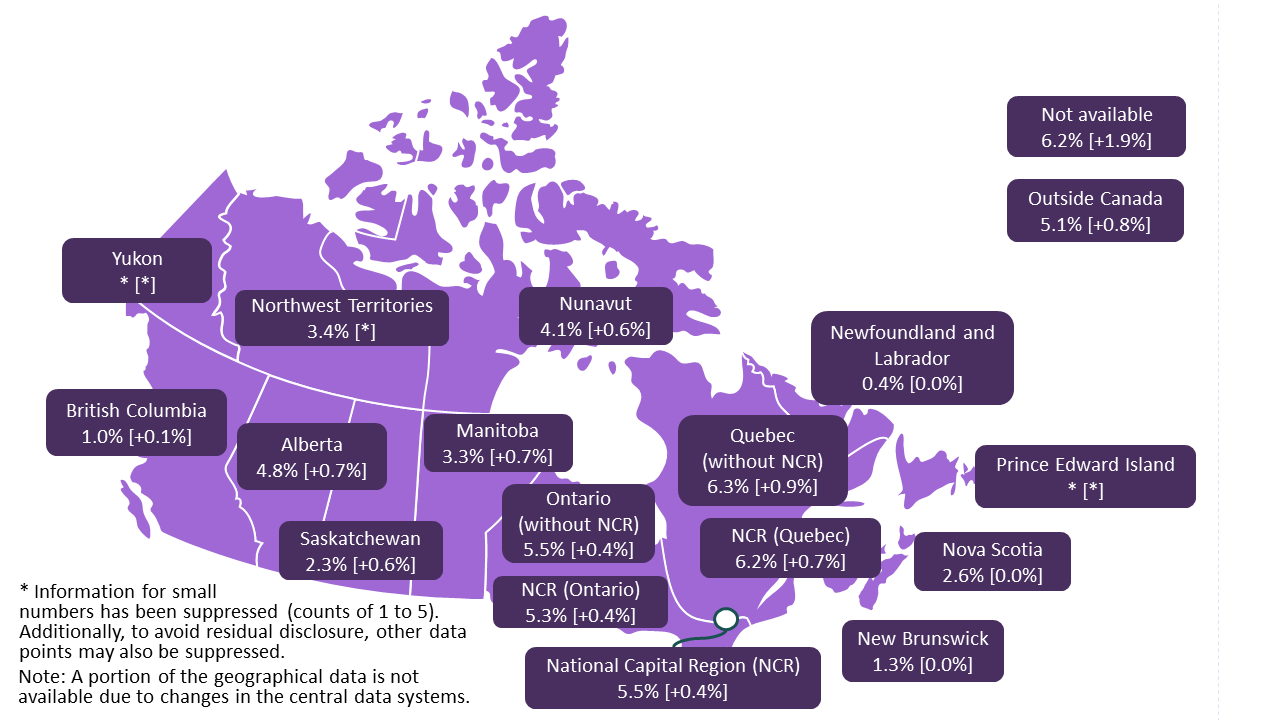
Figure 20 - Text version
Note: Figures in square brackets represent the change since March 2022.
Following are percentages by province, territory and other categories:
- Newfoundland and Labrador: 0.4% [0.0 percentage points]
- Prince Edward Island: Figure Footnote * [Figure Footnote *]
- Nova Scotia: 2.6% [0.0 percentage points]
- New Brunswick: 1.3% [0.0 percentage points]
- Quebec (without the National Capital Region): 6.3% [increase of 0.9 percentage points]
- National Capital Region (Quebec): 6.2% [increase of 0.7 percentage points]
- National Capital Region (Ontario): 5.3% [increase of 0.4 percentage points]
- National Capital Region: 5.5% [increase of 0.4 percentage points]
- Ontario (without the National Capital Region): 5.5% [increase of 0.4 percentage points]
- Manitoba: 3.3% [increase of 0.7 percentage points]
- Saskatchewan: 2.3% [increase of 0.6 percentage points]
- Alberta: 4.8% [increase of 0.7 percentage points]
- British Columbia: 1.0% [increase of 0.1 percentage points]
- Yukon: Figure Footnote * [Figure Footnote *]
- Northwest Territories: 3.4% [Figure Footnote *]
- Nunavut: 4.1% [increase of 0.6 percentage points]
- Outside Canada: 5.1% [increase of 0.8 percentage points]
- Not available: 6.2% [increase of 1.9 percentage points]
Quebec (without the National Capital Region) had the highest representation rate of Black employees at 6.3%, followed by the National Capital Region (Quebec) at 6.2%. The lowest representation rate of Black employees was in Prince Edward Island and Yukon (figures for both are suppressed) and Newfoundland and Labrador (0.4%).
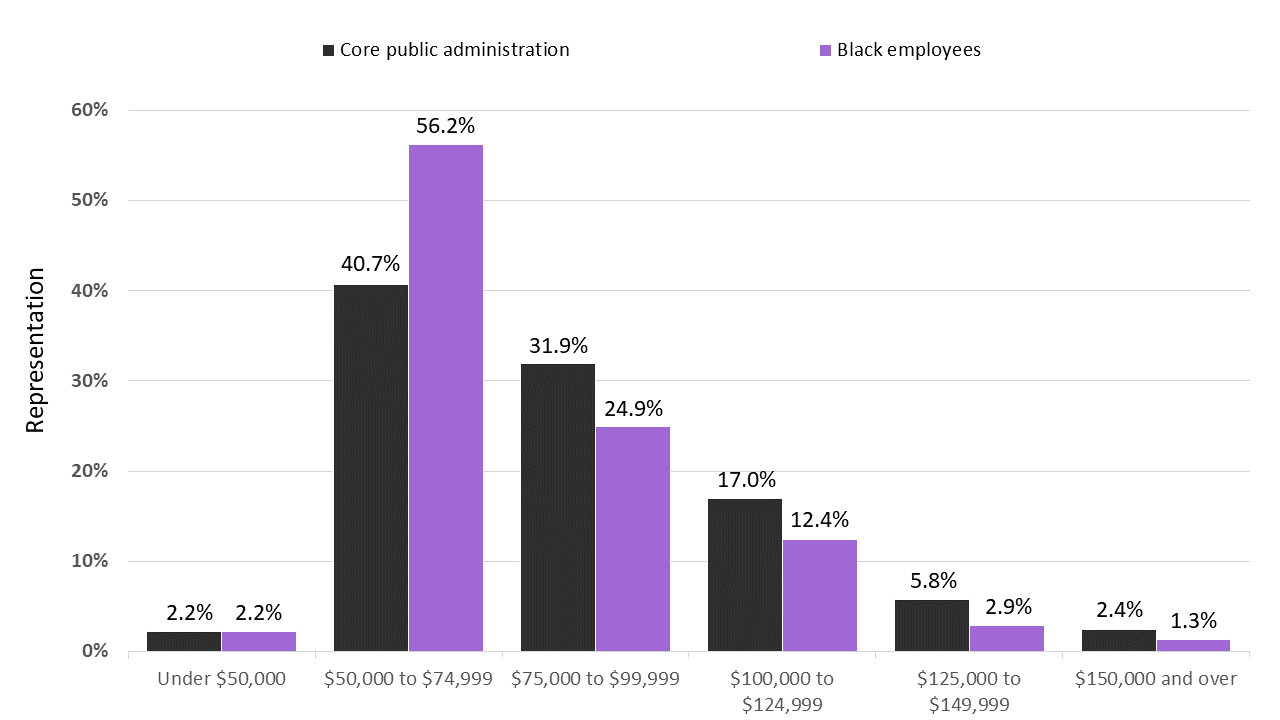
Figure 21 - Text version
| Salary range | Core public administration | Black employees |
|---|---|---|
| Under $50,000 | 2.2% | 2.2% |
| $50,000 to $74,999 | 40.7% | 56.2% |
| $75,000 to $99,999 | 31.9% | 24.9% |
| $100,000 to $124,999 | 17.0% | 12.4% |
| $125,000 to $149,999 | 5.8% | 2.9% |
| $150,000 and over | 2.4% | 1.3% |
When compared with the CPA, the proportion of Black employees is higher in the $50,000 to $74,999 salary range and lower in all other salary ranges of $75,000 and over. In the salary range under $50,000, the proportion of Black employees is 2.2%, at par with the CPA.
Compared to March 2022, in March 2023 the proportion of Black employees:
- increased in the salary range of $50,000 to $74,999 (from 55.0% to 56.2%)
- decreased in the $75,000 to $99,999 salary range (from 26.0% to 24.9%)
- decreased in the $100,000 to $124,999 salary range (from 12.6% to 12.4%)
- decreased in the $125,000 to $149,999 salary range (from 3.2% to 2.9%)
Trends in hires, promotions and separations for Black employees
| Fiscal year | All employees | Members of visible minorities | Black employees | Percent of all employees | Percent of members of visible minorities |
|---|---|---|---|---|---|
| 2016–17 | 16,081 | 2,875 | 456 | 2.8 | 15.9 |
| 2017–18 | 19,249 | 3,402 | 580 | 3.0 | 17.0 |
| 2018–19 | 23,334 | 4,510 | 1,045 | 4.5 | 23.2 |
| 2019–20 | 24,901 | 5,302 | 1,236 | 5.0 | 23.3 |
| 2020–21 | 24,229 | 5,148 | 1,234 | 5.1 | 24.0 |
| 2021–22 | 28,929 | 6,723 | 1,629 | 5.6 | 24.2 |
| 2022–23 | 33,361 | 8,960 | 2,372 | 7.1 | 26.5 |
| Fiscal year | All employees | Members of visible minorities | Black employees | Percent of all employees | Percent of members of visible minorities |
|---|---|---|---|---|---|
| 2016–17 | 17,487 | 2,788 | 470 | 2.7 | 16.9 |
| 2017–18 | 20,660 | 3,560 | 601 | 2.9 | 16.9 |
| 2018–19 | 25,489 | 4,770 | 844 | 3.3 | 17.7 |
| 2019–20 | 27,211 | 5,405 | 997 | 3.7 | 18.4 |
| 2020–21 | 24,919 | 5,227 | 1,048 | 4.2 | 20.0 |
| 2021–22 | 29,295 | 6,818 | 1,394 | 4.8 | 20.4 |
| 2022–23 | 33,194 | 8,024 | 1,658 | 5.0 | 20.7 |
| Fiscal year | All employees | Members of visible minorities | Black employees | Percent of all employees | Percent of members of visible minorities |
|---|---|---|---|---|---|
| 2016–17 | 12,491 | 1,490 | 357 | 2.9 | 24.0 |
| 2017–18 | 12,937 | 1,310 | 257 | 2.0 | 19.6 |
| 2018–19 | 12,898 | 1,260 | 227 | 1.8 | 18.0 |
| 2019–20 | 13,043 | 1,371 | 271 | 2.1 | 19.8 |
| 2020–21 | 12,446 | 1,354 | 297 | 2.4 | 21.9 |
| 2021–22 | 16,687 | 2,033 | 465 | 2.8 | 22.9 |
| 2022–23 | 17,510 | 2,478 | 591 | 3.4 | 23.8 |
The share of hires of Black employees has continuously increased since 2016–17, from 2.8% in 2016–17 to 7.1% in 2022–23, which represents an increase of 4.3 percentage points. The share of promotions has also increased by 2.3 percentage points. The share of separations saw a decrease from 2016–17 to 2018–19 and then increased until 2022–23. The share of separations has increased by 0.6 percentage points compared to the previous year.
| Executive level | All employees | Members of visible minorities | Number | % of all employees | % of members of visible minorities |
|---|---|---|---|---|---|
| EX-01 | 3,935 | 637 | 117 | 3.0 | 18.4 |
| EX-02 | 1,986 | 288 | 48 | 2.4 | 16.7 |
| EX-03 | 1,323 | 184 | 30 | 2.3 | 16.3 |
| EX-04 | 269 | 41 | table 0 note * | table 0 note * | table 0 note * |
| EX-05 | 130 | 15 | table 0 note * | table 0 note * | table 0 note * |
| Total | 7,643 | 1,165 | 203 | 2.7 | 17.4 |
Table 0 Notes
|
|||||
Black executives represent 17.4% of the total number of visible minorities executives, or 2.7% of the total population of executives. The EX‑01 level has the highest representation of Black employees.
| Year | Total population | Number of Black executives | Percentage of Black executives |
|---|---|---|---|
| March 2017 | 5,341 | 73 | 1.4% |
| March 2018 | 5,565 | 78 | 1.4% |
| March 2019 | 5,887 | 96 | 1.6% |
| March 2020 | 6,212 | 99 | 1.6% |
| March 2021 | 6,717 | 128 | 1.9% |
| March 2022 | 7,200 | 168 | 2.3% |
| March 2023 | 7,643 | 203 | 2.7% |
The representation of Black executives increased from 1.4% of the total executive population as of March 2017 to 2.7% in March 2023.
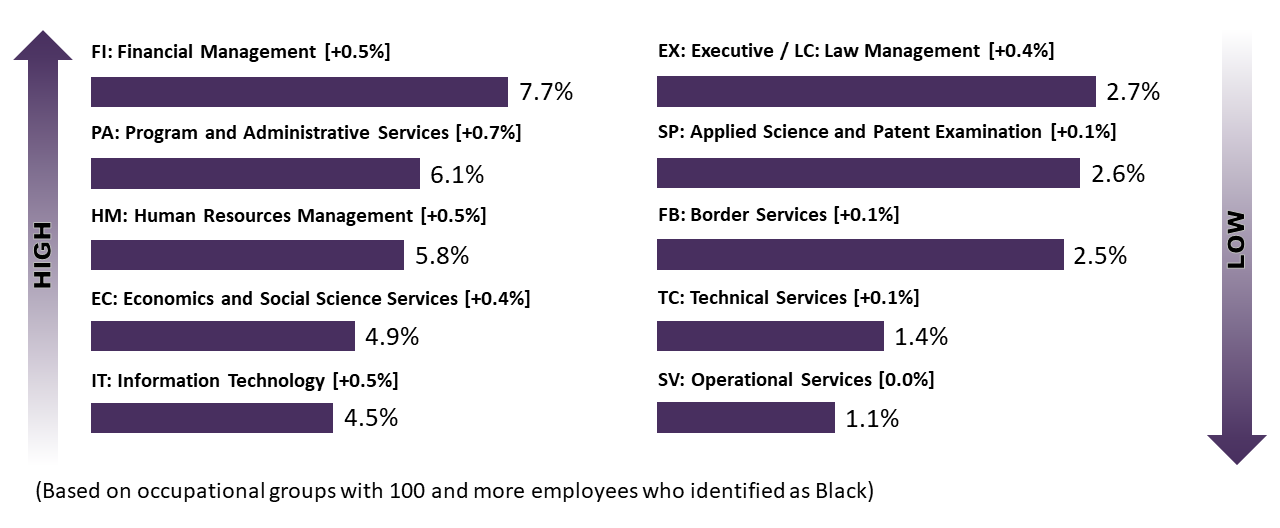
Figure 22 - Text version
Note: Based on occupational groups with 100 and more employees who identified as Black.
Note: Figures in square brackets represent the change since March 2022.
Highest proportion of Black employee
- FI: Financial Management: 7.7% [increase of 0.5 percentage points]
- PA: Program and Administrative Services: 6.1% [increase of 0.7 percentage points]
- HM: Human Resources Management: 5.8% [increase of 0.5 percentage points]
- EC: Economics and Social Science Services: 4.9% [increase of 0.4 percentage points]
- IT: Information Technology: 4.5% [increase of 0.5 percentage points]
Lowest proportion of Black employees
- EX: Executive / LC: Management: 2.7% [increase of 0.4 percentage points]
- SP: Applied Science and Patent Examination: 2.6% [increase of 0.1 percentage points]
- FB: Border Services: 2.5% [increase of 0.1 percentage points]
- TC: Technical Services: 1.4% [increase of 0.1 percentage points]
- SV: Operational Services: 1.1% [0.0 percentage points]
The highest representation of Black employees was in the Financial Management (FI) group, with an increase of 0.5 percentage points from the previous year. The lowest representation of Black employees can be found in the Operational Services (SV) and Technical Services (TC) groups.
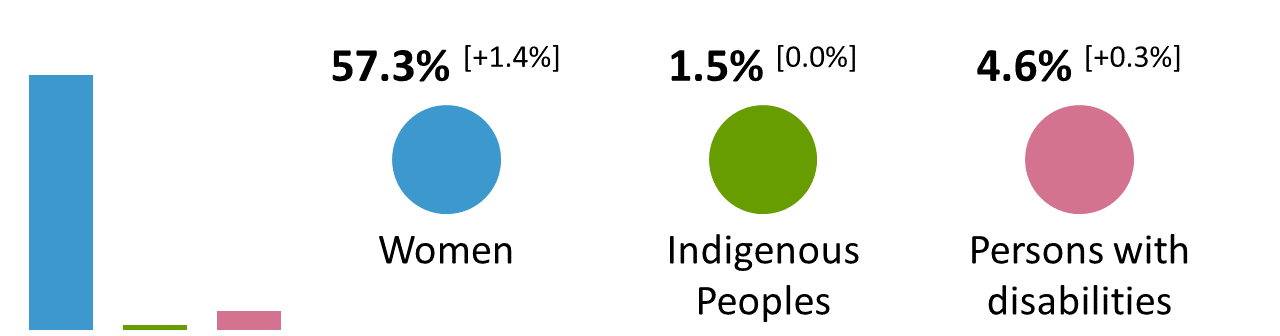
Of the 4.6% of employees who self-identified as Black:
- 57.3% (6,739) are women, an increase of 1.4 percentage points from last year
- 1.5% (177) self-identified as Indigenous, unchanged from last year
- 4.6% (537) self-identified as a person with disabilities, an increase of 0.3 percentage points from last year
Initiatives to support Black employees
In Budget 2022, the Government of Canada proposed $3.7 million over four years in recognition of career advancement barriers facing Black employees, as well as distinct mental health challenges. Budget 2023 proposed a further $45.9 million over three years to TBS, starting in 2023–24, to create a Mental Health Fund for Black public servants. This funding is to establish dedicated career development programs, including a program to prepare Black public service leaders for executive positions. In addition, a Task Force for Black employees was created within OCHRO to lead the design and implementation of this work. Consultations with Black employees and networks on the design and implementation of policy and program options will focus on:
- ideas
- proposals
- best practices for improving career and leadership development
- identification of mental health needs and supports for Black employees in the public service
The Task Force will focus on facilitating the engagement processes, drafting and submitting proposals for approval, and implementing policy and program initiatives.
Appendix: statistical tables of employment equity data covered under section 21 of the Employment Equity Act
Table 1: distribution of public service of Canada employees by designated group and department or agency
The following table includes information (as of March 31, 2023) regarding indeterminate employees, terms of three months or more, and seasonal employees of organizations captured under the Financial Administration Act, Schedules I and IV (core public administration).
| Department or agency | All employees | Women (Overall WFA 53.7%) |
Indigenous Peoples (Overall WFA 3.8%) |
Persons with disabilities (Overall WFA 9.2%) |
Members of visible minorities (Overall WFA 17.3%) |
||||
|---|---|---|---|---|---|---|---|---|---|
| Number | % | Number | % | Number | % | Number | % | ||
| Employment and Social Development Canada | 37,763 | 25,493 | 67.5 | 1,688 | 4.5 | 3,163 | 8.4 | 11,160 | 29.6 |
| National Defencetable 1 note † | 26,322 | 11,169 | 42.4 | 914 | 3.5 | 1,471 | 5.6 | 3,001 | 11.4 |
| Correctional Service Canada | 18,099 | 9,186 | 50.8 | 1,946 | 10.8 | 1,252 | 6.9 | 2,402 | 13.3 |
| Public Services and Procurement Canada | 17,267 | 10,363 | 60.0 | 631 | 3.7 | 1,115 | 6.5 | 3,387 | 19.6 |
| Canada Border Services Agency | 15,175 | 7,157 | 47.2 | 567 | 3.7 | 834 | 5.5 | 3,047 | 20.1 |
| Fisheries and Oceans Canadatable 1 note ‡ | 13,795 | 6,136 | 44.5 | 711 | 5.2 | 717 | 5.2 | 1,238 | 9.0 |
| Immigration, Refugees and Citizenship Canada | 10,683 | 6,885 | 64.4 | 302 | 2.8 | 673 | 6.3 | 4,219 | 39.5 |
| Health Canadatable 1 note ¥ | 9,360 | 6,083 | 65.0 | 253 | 2.7 | 697 | 7.4 | 2,980 | 31.8 |
| Royal Canadian Mounted Police (Civilian Staff) | 9,060 | 6,478 | 71.5 | 486 | 5.4 | 416 | 4.6 | 1,564 | 17.3 |
| Shared Services Canada | 8,348 | 2,967 | 35.5 | 295 | 3.5 | 639 | 7.7 | 1,941 | 23.3 |
| Environment and Climate Change Canada | 7,507 | 4,006 | 53.4 | 252 | 3.4 | 531 | 7.1 | 1,587 | 21.1 |
| Indigenous Services Canada | 7,252 | 5,026 | 69.3 | 2,065 | 28.5 | 510 | 7.0 | 1,363 | 18.8 |
| Global Affairs Canada | 6,738 | 3,809 | 56.5 | 417 | 6.2 | 321 | 4.8 | 1,893 | 28.1 |
| Statistics Canada | 6,093 | 3,056 | 50.2 | 200 | 3.3 | 561 | 9.2 | 1,854 | 30.4 |
| Transport Canada | 5,992 | 2,755 | 46.0 | 262 | 4.4 | 308 | 5.1 | 1,195 | 19.9 |
| Innovation, Science and Economic Development Canada | 5,788 | 2,961 | 51.2 | 161 | 2.8 | 383 | 6.6 | 1,592 | 27.5 |
| Department of Justice Canada | 5,199 | 3,534 | 68.0 | 236 | 4.5 | 405 | 7.8 | 1,273 | 24.5 |
| Agriculture and Agri-Food Canada | 4,991 | 2,640 | 52.9 | 195 | 3.9 | 323 | 6.5 | 1,005 | 20.1 |
| Natural Resources Canada | 4,895 | 2,404 | 49.1 | 192 | 3.9 | 497 | 10.2 | 1,113 | 22.7 |
| Public Health Agency of Canada | 3,783 | 2,661 | 70.3 | 129 | 3.4 | 259 | 6.8 | 1,090 | 28.8 |
| Veterans Affairs Canada | 3,491 | 2,567 | 73.5 | 147 | 4.2 | 281 | 8.0 | 358 | 10.3 |
| Treasury Board of Canada Secretariat | 2,378 | 1,478 | 62.2 | 74 | 3.1 | 216 | 9.1 | 589 | 24.8 |
| Crown-Indigenous Relations and Northern Affairs Canadatable 1 note ¥ | 1,993 | 1,343 | 67.4 | 336 | 16.9 | 129 | 6.5 | 371 | 18.6 |
| Immigration and Refugee Board of Canada | 1,952 | 1,271 | 65.1 | 50 | 2.6 | 109 | 5.6 | 796 | 40.8 |
| Canadian Heritage | 1,907 | 1,313 | 68.9 | 101 | 5.3 | 155 | 8.1 | 360 | 18.9 |
| Public Safety Canada | 1,435 | 867 | 60.4 | 85 | 5.9 | 148 | 10.3 | 307 | 21.4 |
| Infrastructure Canada | 1,194 | 738 | 61.8 | 46 | 3.9 | 104 | 8.7 | 316 | 26.5 |
| Public Prosecution Service of Canada | 1,139 | 748 | 65.7 | 85 | 7.5 | 90 | 7.9 | 246 | 21.6 |
| Privy Council Office | 1,103 | 638 | 57.8 | 46 | 4.2 | 76 | 6.9 | 252 | 22.8 |
| Elections Canada | 943 | 500 | 53.0 | 28 | 3.0 | 69 | 7.3 | 202 | 21.4 |
| Library and Archives Canada | 927 | 581 | 62.7 | 43 | 4.6 | 45 | 4.9 | 91 | 9.8 |
| Public Service Commission of Canada | 904 | 599 | 66.3 | 42 | 4.6 | 133 | 14.7 | 219 | 24.2 |
| Department of Finance Canada | 893 | 426 | 47.7 | 21 | 2.4 | 49 | 5.5 | 184 | 20.6 |
| Canadian Space Agency | 759 | 346 | 45.6 | 15 | 2.0 | 56 | 7.4 | 150 | 19.8 |
| Courts Administration Service | 746 | 486 | 65.1 | 18 | 2.4 | 45 | 6.0 | 203 | 27.2 |
| Canada School of Public Service | 688 | 454 | 66.0 | 32 | 4.7 | 60 | 8.7 | 150 | 21.8 |
| Atlantic Canada Opportunities Agency | 598 | 387 | 64.7 | 25 | 4.2 | 55 | 9.2 | 45 | 7.5 |
| Administrative Tribunals Support Service of Canada | 592 | 390 | 65.9 | 12 | 2.0 | 37 | 6.3 | 116 | 19.6 |
| Canadian Radio-television and Telecommunications Commission | 518 | 274 | 52.9 | 20 | 3.9 | 35 | 6.8 | 115 | 22.2 |
| Western Economic Diversification Canadatable 1 note £ | 475 | 277 | 58.3 | 31 | 6.5 | 28 | 5.9 | 130 | 27.4 |
| Canadian Grain Commission | 439 | 211 | 48.1 | 24 | 5.5 | 19 | 4.3 | 125 | 28.5 |
| lmpact Assessment Agency of Canadatable 1 note § | 422 | 285 | 67.5 | 20 | 4.7 | 29 | 6.9 | 84 | 19.9 |
| Women and Gender Equality Canada | 414 | 352 | 85.0 | 22 | 5.3 | 46 | 11.1 | 96 | 23.2 |
| Parole Board of Canada | 412 | 318 | 77.2 | 24 | 5.8 | 30 | 7.3 | 60 | 14.6 |
| Canada Economic Development for Quebec Regions | 354 | 205 | 57.9 | 6 | 1.7 | 29 | 8.2 | 76 | 21.5 |
| Canadian Transportation Agency | 291 | 160 | 55.0 | 9 | 3.1 | 28 | 9.6 | 57 | 19.6 |
| Offices of the Information and Privacy Commissioners of Canada | 290 | 182 | 62.8 | 16 | 5.5 | 20 | 6.9 | 50 | 17.2 |
| Federal Economic Development Agency for Southern Ontario | 287 | 174 | 60.6 | 10 | 3.5 | 37 | 12.9 | 86 | 30.0 |
| Canadian Human Rights Commission | 269 | 199 | 74.0 | 7 | 2.6 | 47 | 17.5 | 64 | 23.8 |
| Registrar of the Supreme Court of Canada | 219 | 136 | 62.1 | 10 | 4.6 | 21 | 9.6 | 34 | 15.5 |
| Transportation Safety Board of Canada | 200 | 79 | 39.5 | table 1 note * | table 1 note * | 11 | 5.5 | 24 | 12.0 |
| Office of the Commissioner of Official Languages | 155 | 99 | 63.9 | table 1 note * | table 1 note * | 7 | 4.5 | 16 | 10.3 |
| Office of the Governor General’s Secretary | 151 | 92 | 60.9 | table 1 note * | table 1 note * | 13 | 8.6 | 27 | 17.9 |
| Canadian Northern Economic Development Agency | 108 | 68 | 63.0 | 27 | 25.0 | 8 | 7.4 | 27 | 25.0 |
| Veterans Review and Appeal Board | 88 | 58 | 65.9 | table 1 note * | table 1 note * | 6 | 6.8 | 0 | 0.0 |
| Patented Medicine Prices Review Board Canada | 80 | 46 | 57.5 | table 1 note * | table 1 note * | 6 | 7.5 | 18 | 22.5 |
| Civilian Review and Complaints Commission for the RCMP | 80 | 52 | 65.0 | table 1 note * | table 1 note * | table 1 note * | table 1 note * | 17 | 21.3 |
| Canadian Dairy Commission | 70 | 38 | 54.3 | table 1 note * | table 1 note * | table 1 note * | table 1 note * | 11 | 15.7 |
| Office of the Commissioner for Federal Judicial Affairs Canada | 54 | 37 | 68.5 | table 1 note * | table 1 note * | table 1 note * | table 1 note * | table 1 note * | table 1 note * |
| Accessibility Standards Canada | 47 | 24 | 51.1 | table 1 note * | table 1 note * | 17 | 36.2 | 9 | 19.1 |
| Military Grievances External Review Committee | 45 | 28 | 62.2 | table 1 note * | table 1 note * | 6 | 13.3 | 8 | 17.8 |
| Office of the Public Sector Integrity Commissioner of Canada | 35 | 20 | 57.1 | table 1 note * | table 1 note * | table 1 note * | table 1 note * | 7 | 20.0 |
| International Joint Commission | 29 | 16 | 55.2 | 0 | 0.0 | table 1 note * | table 1 note * | table 1 note * | table 1 note * |
| Military Police Complaints Commission of Canada | 28 | 18 | 64.3 | table 1 note * | table 1 note * | table 1 note * | table 1 note * | 8 | 28.6 |
| Office of the Commissioner of Lobbying of Canada | 26 | 14 | 53.8 | 0 | 0.0 | table 1 note * | table 1 note * | table 1 note * | table 1 note * |
| Canadian Intergovernmental Conference Secretariat | 25 | 12 | 48.0 | 0 | 0.0 | table 1 note * | table 1 note * | table 1 note * | table 1 note * |
| RCMP External Review Committee | 24 | 15 | 62.5 | 0 | 0.0 | table 1 note * | table 1 note * | table 1 note * | table 1 note * |
| Copyright Board Canada | 16 | table 1 note * | table 1 note * | 0 | 0.0 | table 1 note * | table 1 note * | table 1 note * | table 1 note * |
| Secretariat of the National Security and Intelligence Committee of Parliamentarians | 8 | table 1 note * | table 1 note * | 0 | 0.0 | 0 | 0.0 | table 1 note * | table 1 note * |
| Total | 253,411 | 143,406 | 56.6 | 13,363 | 5.3 | 17,410 | 6.9 | 55,034 | 21.7 |
Notes
|
|||||||||
Table 2: distribution of public service of Canada employees by designated group and region of work
The following table includes information (as of March 31, 2023) regarding indeterminate employees, terms of three months or more, and seasonal employees of organizations captured under the Financial Administration Act, Schedules I and IV (core public administration).
| Region of work | All employees | Women | Indigenous Peoples | Persons with disabilities | Members of visible minorities | ||||
|---|---|---|---|---|---|---|---|---|---|
| Number | % | Number | % | Number | % | Number | % | ||
| Newfoundland and Labrador | 4,264 | 2,222 | 52.1 | 328 | 7.7 | 289 | 6.8 | 129 | 3.0 |
| Prince Edward Island | 2,393 | 1,538 | 64.3 | 70 | 2.9 | 191 | 8.0 | 96 | 4.0 |
| Nova Scotia | 10,591 | 5,145 | 48.6 | 619 | 5.8 | 878 | 8.3 | 788 | 7.4 |
| New Brunswick | 10,339 | 6,273 | 60.7 | 381 | 3.7 | 628 | 6.1 | 414 | 4.0 |
| Quebec (without the NCR)table 2 note † | 26,754 | 14,842 | 55.5 | 708 | 2.6 | 1,304 | 4.9 | 4,810 | 18.0 |
| NCR (Quebec)table 2 note † | 34,782 | 20,335 | 58.5 | 1,867 | 5.4 | 2,523 | 7.3 | 7,779 | 22.4 |
| NCR (Ontario)table 2 note † | 83,418 | 47,236 | 56.6 | 3,076 | 3.7 | 6,317 | 7.6 | 20,431 | 24.5 |
| NCRtable 2 note † | 118,200 | 67,571 | 57.2 | 4,943 | 4.2 | 8,840 | 7.5 | 28,210 | 23.9 |
| Ontario (without the NCR)table 2 note † | 30,329 | 17,430 | 57.5 | 1,452 | 4.8 | 2,054 | 6.8 | 8,795 | 29.0 |
| Manitoba | 8,005 | 4,712 | 58.9 | 1,282 | 16.0 | 557 | 7.0 | 1,380 | 17.2 |
| Saskatchewan | 5,254 | 3,218 | 61.2 | 958 | 18.2 | 348 | 6.6 | 637 | 12.1 |
| Alberta | 12,454 | 7,214 | 57.9 | 1,035 | 8.3 | 906 | 7.3 | 2,902 | 23.3 |
| British Columbia | 20,221 | 10,541 | 52.1 | 1,148 | 5.7 | 1,154 | 5.7 | 5,797 | 28.7 |
| Yukon | 372 | 235 | 63.2 | 55 | 14.8 | 27 | 7.3 | 48 | 12.9 |
| Northwest Territories | 464 | 275 | 59.3 | 81 | 17.5 | 21 | 4.5 | 72 | 15.5 |
| Nunavut | 291 | 170 | 58.4 | 145 | 49.8 | 14 | 4.8 | 40 | 13.7 |
| Outside Canada | 1,494 | 765 | 51.2 | 83 | 5.6 | 48 | 3.2 | 402 | 26.9 |
| Not availabletable 2 note ¥ | 1,986 | 1,255 | 63.2 | 75 | 3.8 | 151 | 7.6 | 514 | 25.9 |
| Total | 253,411 | 143,406 | 56.6 | 13,363 | 5.3 | 17,410 | 6.9 | 55,034 | 21.7 |
Notes
|
|||||||||
Table 3.1: distribution of public service of Canada employees by designated group and occupational groups in force
The following table includes information (as of March 31, 2023) regarding indeterminate employees, terms of three months or more, and seasonal employees of organizations captured under the Financial Administration Act, Schedules I and IV (core public administration). Classification is based on the effective classification which includes acting assignments.
| Occupational group in force | All employees | Women | Men | Indigenous Peoples | Persons with disabilities | Members of visible minorities | |||||
|---|---|---|---|---|---|---|---|---|---|---|---|
| Number | % | Number | % | Number | % | Number | % | Number | % | ||
| AI: Air Traffic Control | 10 | table 3.1 note * | table 3.1 note * | table 3.1 note * | table 3.1 note * | 0 | 0.0 | 0 | 0.0 | 0 | 0.0 |
| AO: Aircraft Operations | 381 | 38 | 10.0 | 343 | 90.0 | 15 | 3.9 | 7 | 1.8 | 11 | 2.9 |
| AU: Auditing | 186 | 98 | 52.7 | 88 | 47.3 | table 3.1 note * | table 3.1 note * | 7 | 3.8 | 51 | 27.4 |
| AV: Commerce and Purchasing | 7,421 | 3,956 | 53.3 | 3,460 | 46.6 | 331 | 4.5 | 499 | 6.7 | 1,569 | 21.1 |
| CX: Correctional Services | 7,118 | 2,042 | 28.7 | 5,073 | 71.3 | 798 | 11.2 | 303 | 4.3 | 1,040 | 14.6 |
| EB: Education and Library Science | 1,279 | 863 | 67.5 | 415 | 32.4 | 137 | 10.7 | 64 | 5.0 | 213 | 16.7 |
| EC: Economics and Social Science Services | 24,742 | 14,798 | 59.8 | 9,938 | 40.2 | 1,030 | 4.2 | 2,016 | 8.1 | 6,908 | 27.9 |
| EL: Electronics | 1,108 | 75 | 6.8 | 1,031 | 93.1 | 40 | 3.6 | 57 | 5.1 | 133 | 12.0 |
| EX: Executive | 7,275 | 3,896 | 53.6 | 3,377 | 46.4 | 381 | 5.2 | 556 | 7.6 | 1,097 | 15.1 |
| FB: Border Services | 10,111 | 4,090 | 40.5 | 6,021 | 59.5 | 422 | 4.2 | 490 | 4.8 | 1,769 | 17.5 |
| FI: Financial Management | 6,208 | 3,538 | 57.0 | 2,668 | 43.0 | 196 | 3.2 | 253 | 4.1 | 2,195 | 35.4 |
| FS: Foreign Service | 1,867 | 1,056 | 56.6 | 811 | 43.4 | 90 | 4.8 | 76 | 4.1 | 468 | 25.1 |
| HM: Human Resources Management | 5,018 | 4,119 | 82.1 | 898 | 17.9 | 251 | 5.0 | 584 | 11.6 | 1,078 | 21.5 |
| IT: Information Technology | 19,300 | 4,348 | 22.5 | 14,941 | 77.4 | 657 | 3.4 | 1,311 | 6.8 | 5,134 | 26.6 |
| LC: Law Management | 368 | 243 | 66.0 | 125 | 34.0 | 16 | 4.3 | 30 | 8.2 | 68 | 18.5 |
| LP: Law Practitioner | 3,485 | 2,051 | 58.9 | 1,427 | 40.9 | 150 | 4.3 | 260 | 7.5 | 750 | 21.5 |
| NR: Architecture, Engineering and Land Survey | 4,575 | 1,176 | 25.7 | 3,399 | 74.3 | 86 | 1.9 | 171 | 3.7 | 1,233 | 27.0 |
| PA: Program and Administrative Services | 110,536 | 80,082 | 72.4 | 30,404 | 27.5 | 7,034 | 6.4 | 8,939 | 8.1 | 25,192 | 22.8 |
| PM:MCO: Negotiation, Mediation and Conciliation Officer | 50 | 30 | 60.0 | 20 | 40.0 | 0 | 0.0 | table 3.1 note * | table 3.1 note * | table 3.1 note * | table 3.1 note * |
| PO: Police Operations Support | 477 | 335 | 70.2 | 141 | 29.6 | 21 | 4.4 | table 3.1 note * | table 3.1 note * | 65 | 13.6 |
| PR: Non-Supervisory Printing Services | 2 | table 3.1 note * | table 3.1 note * | table 3.1 note * | table 3.1 note * | 0 | 0.0 | 0 | 0.0 | 0 | 0.0 |
| RE: Research | 2,703 | 922 | 34.1 | 1,779 | 65.8 | 39 | 1.4 | 105 | 3.9 | 662 | 24.5 |
| RO: Radio Operations | 268 | 83 | 31.0 | 185 | 69.0 | 20 | 7.5 | 12 | 4.5 | 6 | 2.2 |
| SH: Health Services | 3,906 | 3,173 | 81.2 | 729 | 18.7 | 264 | 6.8 | 184 | 4.7 | 586 | 15.0 |
| SO: Ships’ Officers | 1,318 | 193 | 14.6 | 1,125 | 85.4 | 21 | 1.6 | 20 | 1.5 | 49 | 3.7 |
| SP: Applied Science and Patent Examination | 10,146 | 5,621 | 55.4 | 4,523 | 44.6 | 228 | 2.2 | 477 | 4.7 | 2,632 | 25.9 |
| SR(C): Ship Repair Chargehands and Production Supervisors - East | 65 | table 3.1 note * | table 3.1 note * | table 3.1 note * | table 3.1 note * | table 3.1 note * | table 3.1 note * | 7 | 10.8 | table 3.1 note * | table 3.1 note * |
| SR(E): Ship Repair - East | 624 | 56 | 9.0 | 568 | 91.0 | 25 | 4.0 | 26 | 4.2 | 17 | 2.7 |
| SR(W): Ship Repair - West | 647 | 36 | 5.6 | 609 | 94.1 | 19 | 2.9 | 14 | 2.2 | 21 | 3.2 |
| SV: Operational Services | 10,175 | 2,162 | 21.2 | 8,002 | 78.6 | 543 | 5.3 | 395 | 3.9 | 591 | 5.8 |
| TC: Technical Services | 10,958 | 3,602 | 32.9 | 7,353 | 67.1 | 534 | 4.9 | 517 | 4.7 | 1,388 | 12.7 |
| TR: Translation | 858 | 651 | 75.9 | 207 | 24.1 | 7 | 0.8 | 18 | 2.1 | 59 | 6.9 |
| UT: University Teaching | 213 | 62 | 29.1 | 150 | 70.4 | table 3.1 note * | table 3.1 note * | 6 | 2.8 | 42 | 19.7 |
| Unknown | 13 | 6 | 46.2 | 7 | 53.8 | 0 | 0.0 | 0 | 0.0 | table 3.1 note * | table 3.1 note * |
| Total | 253,411 | 143,406 | 56.6 | 109,889 | 43.4 | 13,363 | 5.3 | 17,410 | 6.9 | 55,034 | 21.7 |
Notes
|
|||||||||||
Table 3.2: distribution of public service of Canada employees by designated group and (outdated) occupational category
The following table includes information (as of March 31, 2023) regarding indeterminate employees, terms of three months or more, and seasonal employees of organizations captured under the Financial Administration Act, Schedules I and IV (core public administration). Classification is based on the effective classification which includes acting assignments.
| Occupational category (outdated) | All employees | Women | Indigenous Peoples | Persons with disabilities | Members of visible minorities | ||||
|---|---|---|---|---|---|---|---|---|---|
| Number | % | Number | % | Number | % | Number | % | ||
| Executives | 7,643 | 4,139 | 54.2 | 397 | 5.2 | 586 | 7.7 | 1,165 | 15.2 |
|
EX (Executive)
|
7,275 | 3,896 | 53.6 | 381 | 5.2 | 556 | 7.6 | 1,097 | 15.1 |
|
LC (Law Management)table 3.2 note †
|
368 | 243 | 66.0 | 16 | 4.3 | 30 | 8.2 | 68 | 18.5 |
| Scientific and Professional | 51,197 | 28,732 | 56.1 | 1,918 | 3.7 | 3,290 | 6.4 | 13,073 | 25.5 |
| Administrative and Foreign Service | 133,282 | 84,170 | 63.2 | 7,351 | 5.5 | 10,111 | 7.6 | 31,624 | 23.7 |
| Technical | 14,081 | 4,024 | 28.6 | 649 | 4.6 | 613 | 4.4 | 1,591 | 11.3 |
| Administrative Support | 17,976 | 13,610 | 75.7 | 1,215 | 6.8 | 1,572 | 8.7 | 4,074 | 22.7 |
| Operational | 29,219 | 8,725 | 29.9 | 1,833 | 6.3 | 1,238 | 4.2 | 3,504 | 12.0 |
| Undetermined | 13 | 6 | 46.2 | 0 | 0.0 | 0 | 0.0 | 3 | 23.1 |
| Total | 253,411 | 143,406 | 56.6 | 13,363 | 5.3 | 17,410 | 6.9 | 55,034 | 21.7 |
Notes
|
|||||||||
Table 4: distribution of public service of Canada employees by designated group and salary range
The following table includes information (as of March 31, 2023) regarding indeterminate employees, terms of three months or more, and seasonal employees of organizations captured under the Financial Administration Act, Schedules I and IV (core public administration).
| Salary range ($) | All employees | Women | Indigenous Peoples | Persons with disabilities | Members of visible minorities | |||||||||
|---|---|---|---|---|---|---|---|---|---|---|---|---|---|---|
| Number | % of all employees | Number | % of salary range | % of EEtable 4 note † group | Number | % of salary range | % of EEtable 4 note † group | Number | % of salary range | % of EEtable 4 note † group | Number | % of salary range | % of EEtable 4 note † group | |
| Under 50,000 | 5,506 | 2.2 | 3,731 | 67.8 | 2.6 | 309 | 5.6 | 2.3 | 456 | 8.3 | 2.6 | 1,149 | 20.9 | 2.1 |
| 50,000 to 54,999 | 17,514 | 6.9 | 12,562 | 71.7 | 8.8 | 1,079 | 6.2 | 8.1 | 1,496 | 8.5 | 8.6 | 4,733 | 27.0 | 8.6 |
| 55,000 to 59,999 | 16,746 | 6.6 | 10,942 | 65.3 | 7.6 | 902 | 5.4 | 6.7 | 1,169 | 7.0 | 6.7 | 3,878 | 23.2 | 7.0 |
| 60,000 to 64,999 | 20,458 | 8.1 | 13,088 | 64.0 | 9.1 | 1,136 | 5.6 | 8.5 | 1,642 | 8.0 | 9.4 | 5,001 | 24.4 | 9.1 |
| 65,000 to 69,999 | 23,218 | 9.2 | 15,044 | 64.8 | 10.5 | 1,307 | 5.6 | 9.8 | 1,623 | 7.0 | 9.3 | 5,661 | 24.4 | 10.3 |
| 70,000 to 74,999 | 25,292 | 10.0 | 15,684 | 62.0 | 10.9 | 1,344 | 5.3 | 10.1 | 1,708 | 6.8 | 9.8 | 5,789 | 22.9 | 10.5 |
| 75,000 to 79,999 | 16,021 | 6.3 | 8,392 | 52.4 | 5.9 | 971 | 6.1 | 7.3 | 1,096 | 6.8 | 6.3 | 3,226 | 20.1 | 5.9 |
| 80,000 to 84,999 | 11,295 | 4.5 | 4,450 | 39.4 | 3.1 | 622 | 5.5 | 4.7 | 540 | 4.8 | 3.1 | 2,096 | 18.6 | 3.8 |
| 85,000 to 89,999 | 22,431 | 8.9 | 11,515 | 51.3 | 8.0 | 1,293 | 5.8 | 9.7 | 1,362 | 6.1 | 7.8 | 4,524 | 20.2 | 8.2 |
| 90,000 to 94,999 | 22,142 | 8.7 | 11,992 | 54.2 | 8.4 | 1,259 | 5.7 | 9.4 | 1,575 | 7.1 | 9.0 | 4,344 | 19.6 | 7.9 |
| 95,000 to 99,999 | 8,853 | 3.5 | 4,881 | 55.1 | 3.4 | 482 | 5.4 | 3.6 | 598 | 6.8 | 3.4 | 1,892 | 21.4 | 3.4 |
| 100,000 to 104,999 | 12,844 | 5.1 | 6,702 | 52.2 | 4.7 | 662 | 5.2 | 5.0 | 832 | 6.5 | 4.8 | 2,660 | 20.7 | 4.8 |
| 105,000 to 109,999 | 9,098 | 3.6 | 3,683 | 40.5 | 2.6 | 324 | 3.6 | 2.4 | 526 | 5.8 | 3.0 | 1,977 | 21.7 | 3.6 |
| 110,000 to 114,999 | 8,511 | 3.4 | 4,891 | 57.5 | 3.4 | 409 | 4.8 | 3.1 | 631 | 7.4 | 3.6 | 1,573 | 18.5 | 2.9 |
| 115,000 to 119,999 | 6,834 | 2.7 | 3,369 | 49.3 | 2.3 | 261 | 3.8 | 2.0 | 484 | 7.1 | 2.8 | 1,597 | 23.4 | 2.9 |
| 120,000 to 124,999 | 5,895 | 2.3 | 2,624 | 44.5 | 1.8 | 227 | 3.9 | 1.7 | 320 | 5.4 | 1.8 | 1,320 | 22.4 | 2.4 |
| 125,000 to 149,999 | 14,596 | 5.8 | 6,767 | 46.4 | 4.7 | 533 | 3.7 | 4.0 | 958 | 6.6 | 5.5 | 2,668 | 18.3 | 4.8 |
| 150,000 and over | 6,157 | 2.4 | 3,089 | 50.2 | 2.2 | 243 | 3.9 | 1.8 | 394 | 6.4 | 2.3 | 946 | 15.4 | 1.7 |
| Total | 253,411 | 100.0 | 143,406 | 56.6 | 100.0 | 13,363 | 5.3 | 100.0 | 17,410 | 6.9 | 100.0 | 55,034 | 21.7 | 100.0 |
Notes
|
||||||||||||||
Table 5: hires into, promotions within and separations from the public service of Canada by designated group
The following table includes information (as of fiscal year 2022–23) regarding indeterminate employees, terms of three months or more, and seasonal employees of organizations captured under the Financial Administration Act, Schedules I and IV (core public administration).
| Action type | All employees | Women | Indigenous Peoples | Persons with disabilities | Members of visible minorities | ||||
|---|---|---|---|---|---|---|---|---|---|
| Number | % | Number | % | Number | % | Number | % | ||
| Hires | 33,361 | 20,378 | 61.1 | 1,471 | 4.4 | 2,295 | 6.9 | 8,960 | 26.9 |
| Promotions | 33,194 | 20,975 | 63.2 | 1,698 | 5.1 | 2,230 | 6.7 | 8,024 | 24.2 |
| Separations | 17,510 | 9,835 | 56.2 | 897 | 5.1 | 1,202 | 6.9 | 2,478 | 14.2 |
Notes
|
|||||||||
Table 6: distribution of public service of Canada employees by designated group and age range
The following table includes information (as of March 31, 2023) regarding indeterminate employees, terms of three months or more, and seasonal employees of organizations captured under the Financial Administration Act, Schedules I and IV (core public administration).
| Age range (years) | All employees | Women | Indigenous Peoples | Persons with disabilities | Members of visible minorities | |||||||||
|---|---|---|---|---|---|---|---|---|---|---|---|---|---|---|
| Number | % of all employees | Number | % of age range | % of EEtable 6 note † group | Number | % of age range | % of EEtable 6 note † group | Number | % of age range | % of EEtable 6 note † group | Number | % of age range | % of EEtable 6 note † group | |
| Under 20 | 150 | 0.1 | 71 | 47.3 | 0.0 | table 6 note * | table 6 note * | table 6 note * | table 6 note * | table 6 note * | table 6 note * | 10 | 6.7 | 0.0 |
| 20 to 24 | 6,782 | 2.7 | 4,061 | 59.9 | 2.8 | 340 | 5.0 | 2.5 | 395 | 5.8 | 2.3 | 1,699 | 25.1 | 3.1 |
| 25 to 29 | 26,400 | 10.4 | 15,963 | 60.5 | 11.1 | 1,202 | 4.6 | 9.0 | 1,647 | 6.2 | 9.5 | 7,758 | 29.4 | 14.1 |
| 30 to 34 | 29,974 | 11.8 | 17,465 | 58.3 | 12.2 | 1,397 | 4.7 | 10.5 | 1,709 | 5.7 | 9.8 | 7,641 | 25.5 | 13.9 |
| 35 to 39 | 33,529 | 13.2 | 19,231 | 57.4 | 13.4 | 1,670 | 5.0 | 12.5 | 1,955 | 5.8 | 11.2 | 7,891 | 23.5 | 14.3 |
| 40 to 44 | 38,762 | 15.3 | 22,697 | 58.6 | 15.8 | 1,956 | 5.0 | 14.6 | 2,397 | 6.2 | 13.8 | 8,513 | 22.0 | 15.5 |
| 45 to 49 | 38,183 | 15.1 | 22,134 | 58.0 | 15.4 | 2,140 | 5.6 | 16.0 | 2,673 | 7.0 | 15.4 | 7,714 | 20.2 | 14.0 |
| 50 to 54 | 33,765 | 13.3 | 18,609 | 55.1 | 13.0 | 2,055 | 6.1 | 15.4 | 2,606 | 7.7 | 15.0 | 6,077 | 18.0 | 11.0 |
| 55 to 59 | 26,190 | 10.3 | 13,790 | 52.7 | 9.6 | 1,580 | 6.0 | 11.8 | 2,193 | 8.4 | 12.6 | 4,294 | 16.4 | 7.8 |
| 60 to 64 | 13,955 | 5.5 | 6,840 | 49.0 | 4.8 | 764 | 5.5 | 5.7 | 1,300 | 9.3 | 7.5 | 2,311 | 16.6 | 4.2 |
| 65 to 69 | 4,480 | 1.8 | 2,022 | 45.1 | 1.4 | 219 | 4.9 | 1.6 | 400 | 8.9 | 2.3 | 872 | 19.5 | 1.6 |
| 70+ | 1,241 | 0.5 | 523 | 42.1 | 0.4 | table 6 note * | table 6 note * | table 6 note * | table 6 note * | table 6 note * | table 6 note * | 254 | 20.5 | 0.5 |
| Total | 253,411 | 100.0 | 143,406 | 56.6 | 100.0 | 13,363 | 5.3 | 100.0 | 17,410 | 6.9 | 100.0 | 55,034 | 21.7 | 100.0 |
Notes
|
||||||||||||||
Table 7: representation in the public service of Canada by designated group and year
The following table includes information (as of March 31, 2023) regarding indeterminate employees, terms of three months or more, and seasonal employees of organizations captured under the Financial Administration Act, Schedules I and IV (core public administration).
| Public service representation | All employees | Women | Indigenous Peoples | Persons with disabilities | Members of visible minorities | ||||
|---|---|---|---|---|---|---|---|---|---|
| Number | % | Number | % | Number | % | Number | % | ||
| As of March 31, 2023 | 253,411 | 143,406 | 56.6 | 13,363 | 5.3 | 17,410 | 6.9 | 55,034 | 21.7 |
| As of March 31, 2022 | 236,133 | 132,299 | 56.0 | 12,336 | 5.2 | 14,573 | 6.2 | 47,728 | 20.2 |
| As of March 31, 2021 | 228,345 | 127,043 | 55.6 | 11,977 | 5.2 | 12,893 | 5.6 | 43,122 | 18.9 |
| As of March 31, 2020 | 214,120 | 117,760 | 55.0 | 10,888 | 5.1 | 11,087 | 5.2 | 38,145 | 17.8 |
| As of March 31, 2019 | 203,268 | 111,332 | 54.8 | 10,435 | 5.1 | 10,622 | 5.2 | 34,004 | 16.7 |
| As of March 31, 2018 | 192,467 | 105,465 | 54.8 | 9,876 | 5.1 | 10,181 | 5.3 | 30,273 | 15.7 |
| As of March 31, 2017 | 185,484 | 101,136 | 54.5 | 9,726 | 5.2 | 10,259 | 5.5 | 28,058 | 15.1 |
| As of March 31, 2016 | 181,674 | 98,846 | 54.4 | 9,358 | 5.2 | 10,092 | 5.6 | 26,336 | 14.5 |
| As of March 31, 2015 | 180,681 | 98,051 | 54.3 | 9,232 | 5.1 | 10,204 | 5.6 | 24,849 | 13.8 |
| As of March 31, 2014 | 181,356 | 98,078 | 54.1 | 9,239 | 5.1 | 10,390 | 5.7 | 23,919 | 13.2 |
| As of March 31, 2013 | 188,342 | 102,124 | 54.2 | 9,491 | 5.0 | 10,871 | 5.8 | 23,812 | 12.6 |
| As of March 31, 2012 | 198,793 | 108,620 | 54.6 | 9,785 | 4.9 | 11,418 | 5.7 | 23,978 | 12.1 |
| As of March 31, 2011 | 202,631 | 111,051 | 54.8 | 9,486 | 4.7 | 11,388 | 5.6 | 22,998 | 11.3 |
| As of March 31, 2010 | 202,386 | 110,867 | 54.8 | 9,307 | 4.6 | 11,620 | 5.7 | 21,567 | 10.7 |
| As of March 31, 2009 | 195,667 | 107,089 | 54.7 | 8,892 | 4.5 | 11,468 | 5.9 | 19,264 | 9.8 |
| As of March 31, 2008 | 186,754 | 101,589 | 54.4 | 8,190 | 4.4 | 11,001 | 5.9 | 17,207 | 9.2 |
| As of March 31, 2007 | 179,540 | 96,816 | 53.9 | 7,610 | 4.2 | 10,192 | 5.7 | 15,787 | 8.8 |
| As of March 31, 2006 | 176,630 | 95,013 | 53.8 | 7,381 | 4.2 | 10,169 | 5.8 | 15,112 | 8.6 |
| As of March 31, 2005 | 165,856 | 88,702 | 53.5 | 6,886 | 4.2 | 9,626 | 5.8 | 13,498 | 8.1 |
| As of March 31, 2004 | 165,976 | 88,175 | 53.1 | 6,723 | 4.1 | 9,452 | 5.7 | 13,001 | 7.8 |
| As of March 31, 2003 | 163,314 | 86,162 | 52.8 | 6,426 | 3.9 | 9,155 | 5.6 | 12,058 | 7.4 |
| As of March 31, 2002 | 157,510 | 82,663 | 52.5 | 5,980 | 3.8 | 8,331 | 5.3 | 10,772 | 6.8 |
| As of March 31, 2001 | 149,339 | 77,785 | 52.1 | 5,316 | 3.6 | 7,621 | 5.1 | 9,143 | 6.1 |
| As of March 31, 2000table 7 note * (Revenue Canada excluded) |
141,253 | 72,549 | 51.4 | 4,639 | 3.3 | 6,687 | 4.7 | 7,764 | 5.5 |
| As of March 31, 1999 (Revenue Canada included) |
178,340 | 91,856 | 51.5 | 5,124 | 2.9 | 8,137 | 4.6 | 10,557 | 5.9 |
| As of March 31, 1998 | 179,831 | 90,801 | 50.5 | 4,770 | 2.7 | 6,943 | 3.9 | 9,260 | 5.1 |
Table 7 Notes
|
|||||||||
| Workforce availability | All employees | Women | Indigenous Peoples | Persons with disabilities | Members of visible minorities | ||||
|---|---|---|---|---|---|---|---|---|---|
| Number | % | Number | % | Number | % | Number | % | ||
| 2016 Census and 2017 Canadian Survey on Disability (based on Canadian citizens and permanent residents) - based on population data as of March 31, 2023 | n/atable 7b note * | n/atable 7b note * | 53.7 | n/atable 7b note * | 3.8 | n/atable 7b note * | 9.2 | n/atable 7b note * | 17.3 |
| 2016 Census and 2017 Canadian Survey on Disability (based on Canadian citizens and permanent residents) - based on population data as of March 31, 2022 | n/atable 7b note * | n/atable 7b note * | 53.3 | n/atable 7b note * | 3.8 | n/atable 7b note * | 9.1 | n/atable 7b note * | 17.2 |
| 2016 Census and 2017 Canadian Survey on Disability (based on Canadian citizens only) | n/atable 7b note * | n/atable 7b note * | 52.7 | n/atable 7b note * | 4.0 | n/atable 7b note * | 9.0 | n/atable 7b note * | 15.3 |
| 2011 National Household Survey and 2012 Canadian Survey on Disability | n/atable 7b note * | n/atable 7b note * | 52.5 | n/atable 7b note * | 3.4 | n/atable 7b note * | 4.4 | n/atable 7b note * | 13.0 |
| 2006 Census and Participation and Activity Limitation Survey (PALS) | n/atable 7b note * | n/atable 7b note * | 52.3 | n/atable 7b note * | 3.0 | n/atable 7b note * | 4.0 | n/atable 7b note * | 12.4 |
| 2001 Census and PALS | n/atable 7b note * | n/atable 7b note * | 52.2 | n/atable 7b note * | 2.5 | n/atable 7b note * | 3.6 | n/atable 7b note * | 10.4 |
| 1996 Census and 1991 Health and Activity Limitation Survey (HALS) | n/atable 7b note * | n/atable 7b note * | 48.7 | n/atable 7b note * | 1.7 | n/atable 7b note * | 4.8 | n/atable 7b note * | 8.7 |
| 1991 Census and HALS | n/atable 7b note * | n/atable 7b note * | 47.3 | n/atable 7b note * | 2.6 | n/atable 7b note * | 4.8 | n/atable 7b note * | 9.0 |
Table 7b Notes
|
|||||||||
Notes
- The source of the representation data is the Treasury Board of Canada Secretariat Employment Equity Data Bank, which is populated with self-identification information provided by employees.
- The data in this and other tables in this report cover employees identified for the purpose of employment equity in the Employment Equity Regulations and the Employment Equity Act.
- The estimates of workforce availability are based on information from the 2016 Census of Canada and the 2017 Canadian Survey on Disability and the post-Census Participation and Activity Limitation Survey (PALS).
- Workforce availability estimates have been updated and now include only Canadian citizens and permanent residents in those occupations in the Canadian workforce that correspond to occupations in the core public administration.